. 2022 Apr 25;6(1):28.
doi: 10.1038/s41698-022-00270-y.

Plasma cell-free RNA profiling distinguishes cancers from pre-malignant conditions in solid and hematologic malignancies

Affiliations

Plasma cell-free RNA profiling distinguishes cancers from pre-malignant conditions in solid and hematologic malignancies

Breeshey Roskams-Hieter et al. NPJ Precis Oncol. .

Abstract

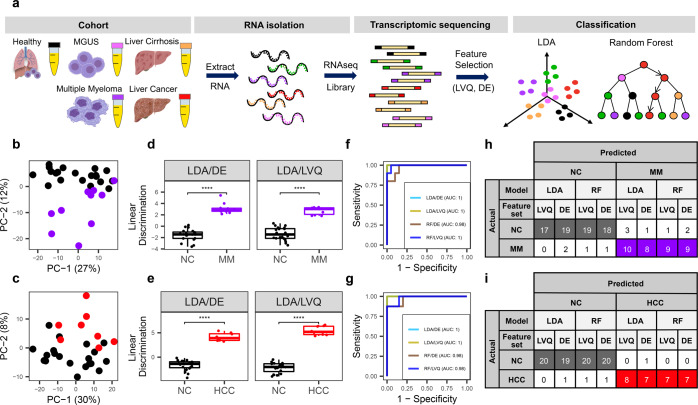
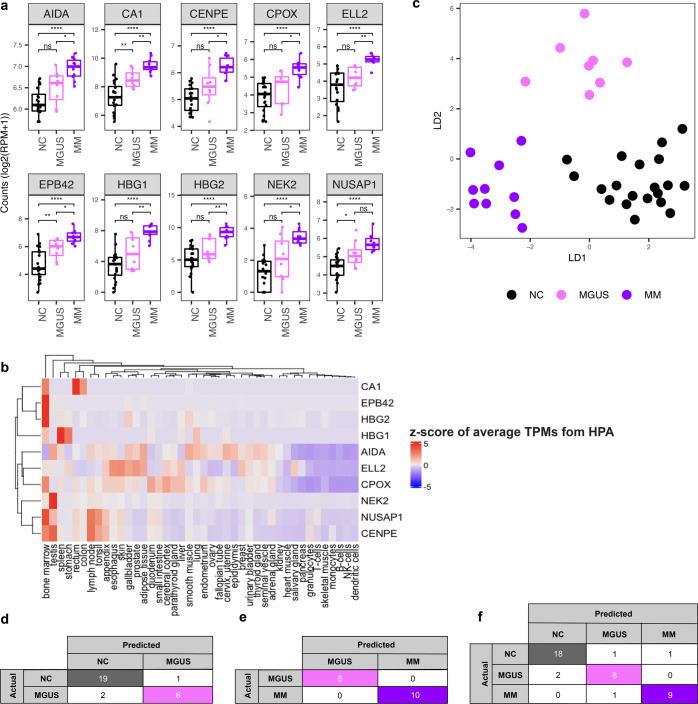
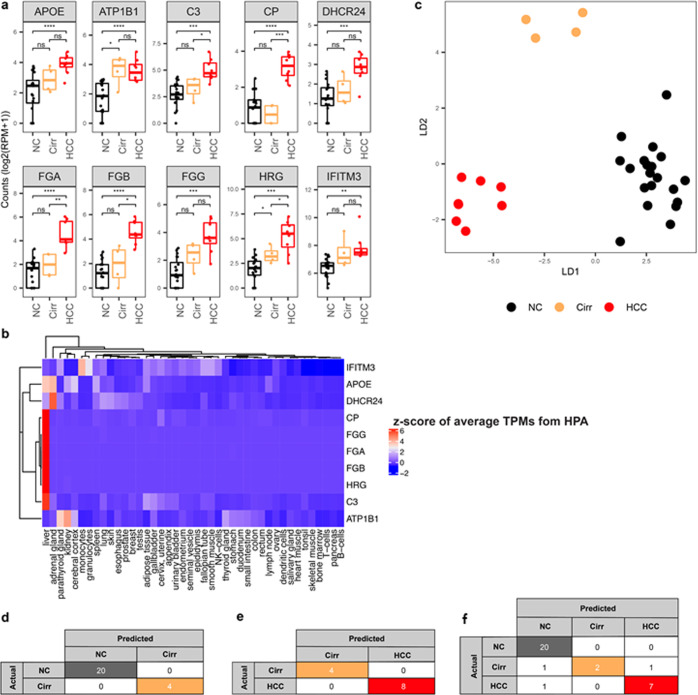
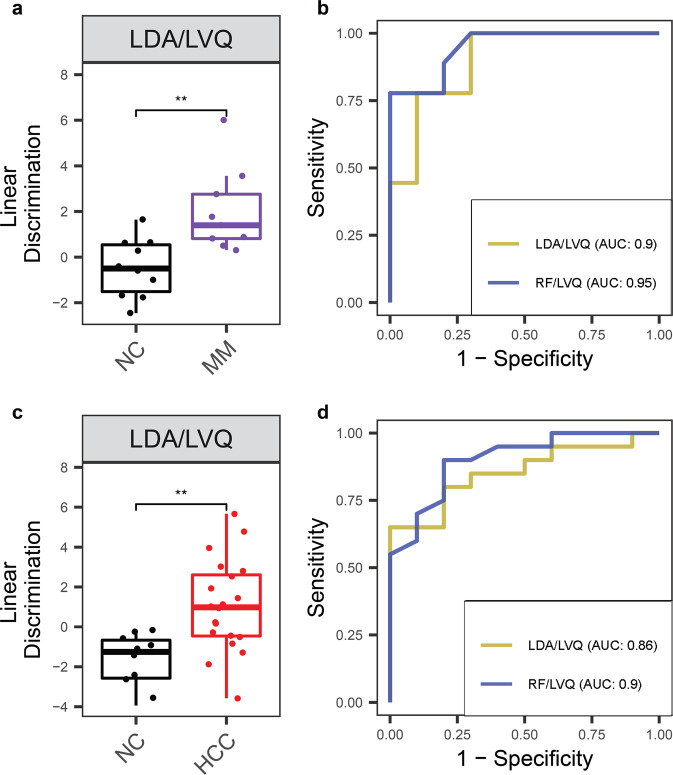
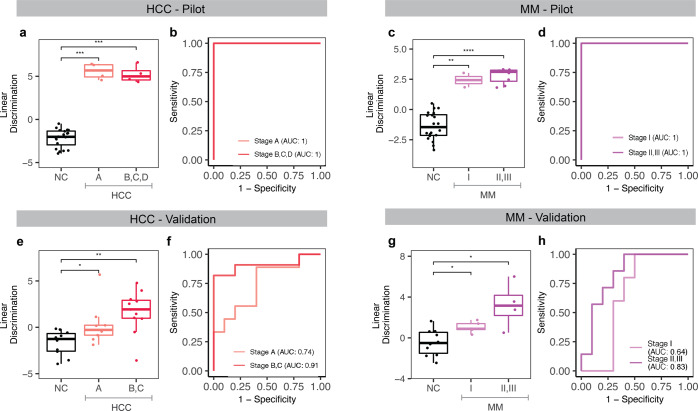
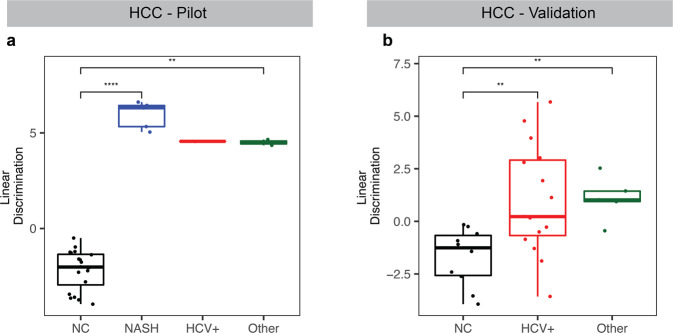
Cell-free RNA (cfRNA) in plasma reflects phenotypic alterations of both localized sites of cancer and the systemic host response. Here we report that cfRNA sequencing enables the discovery of messenger RNA (mRNA) biomarkers in plasma with the tissue of origin-specific to cancer types and precancerous conditions in both solid and hematologic malignancies. To explore the diagnostic potential of total cfRNA from blood, we sequenced plasma samples of eight hepatocellular carcinoma (HCC) and ten multiple myeloma (MM) patients, 12 patients of their respective precancerous conditions, and 20 non-cancer (NC) donors. We identified distinct gene sets and built classification models using Random Forest and linear discriminant analysis algorithms that could distinguish cancer patients from premalignant conditions and NC individuals with high accuracy. Plasma cfRNA biomarkers of HCC are liver-specific genes and biomarkers of MM are highly expressed in the bone marrow compared to other tissues and are related to cell cycle processes. The cfRNA level of these biomarkers displayed a gradual transition from noncancerous states through precancerous conditions and cancer. Sequencing data were cross-validated by quantitative reverse transcription PCR and cfRNA biomarkers were validated in an independent sample set (20 HCC, 9 MM, and 10 NC) with AUC greater than 0.86. cfRNA results observed in precancerous conditions require further validation. This work demonstrates a proof of principle for using mRNA transcripts in plasma with a small panel of genes to distinguish between cancers, noncancerous states, and precancerous conditions.


Conflict of interest statement

Oregon Health and Science University has filed patent applications based on this work. The authors declare no competing interests.

Figures

Fig. 1
Fig. 1. cfRNA profiles distinguish between cancer vs. healthy donors.
a Schematic overview of the cfRNA profiling workflow starting from plasma collected from the patients and NC donors in EDTA-coated tubes, cfRNA extraction, sequencing, feature selection, and classification. b, c PCA analysis using the top 500 genes with the largest variance across NC and MM (b) or HCC samples (c). d, e Linear discriminant analysis (LDA) using DE genes with padj <0.01 and top ten most important genes identified by LVQ analysis. P value is derived from the Wilcoxon test. Center-line indicates the median value across all patients in that group, and the hinges represent the lower (Q1) and upper (Q3) quartile, with whiskers extending to the minimum and maximum of the resulting distribution. f, g ROC curves of the two classification models LDA and Random Forest (RF) model with two feature sets DE and LVQ. h, i LOOCV with the two models LDA and RF with two feature set DE and LVQ. DE genes are listed in Supplementary Table 3 and LVQ genes are listed in Supplementary Table 5.
Fig. 2
Fig. 2. cfRNA profiles distinguish between non-cancer, MGUS, and multiple myeloma donors.
a Boxplots of representative top ten most significant genes resulted from the LVQ analysis for MM versus NC. P value was calculated for each pair by the t-test. Center-line indicates the median value across all patients in that group, and the hinges represent the lower (Q1) and upper (Q3) quartile, with whiskers extending to the minimum and maximum of the resulting distribution. b Heatmap of z-score across publicly available tissue-level expression data from the Human Protein Atlas (HPA) for the top ten LVQ genes identified in MM vs. NC. c LDA plot using ten genes from pairwise analysis across NC - MGUS and NC - MM pairs using the LVQ method. df LOOCV using the Random Forest (RF) model with top ten LVQ genes to discriminate MGUS and NC (d), MM vs MGUS (e), and three groups NC, MGUS, and MM (f). Genes included in the RF analysis are listed in Supplementary Table 5.
Fig. 3
Fig. 3. cfRNA profiles distinguish between non-cancer, liver cirrhosis, and liver cancer donors.
a Boxplots of representative top ten most significant genes resulted from the LVQ analysis for HCC vs. NC. P value was calculated for each pair by the t-test. Center-line indicates the median value across all patients in that group, and the hinges represent the lower (Q1) and upper (Q3) quartile, with whiskers extending to the minimum and maximum of the resulting distribution. b Heatmap of z-score across publicly available tissue-level expression data from the Human Protein Atlas (HPA) for the top ten LVQ genes identified in HCC vs. NC (c) LDA plot using top ten genes identified from each pairwise analysis between NC - Cirr and NC - HCC samples using the LVQ method. df LOOCV using the RF model with top ten LVQ genes to discriminate Cirr and NC (d), HCC vs Cirr (e), and three groups NC, Cirr, and HCC (f). Genes included in the RF analysis are listed in Supplementary Table 5.
Fig. 4
Fig. 4. qRT-PCR of cfRNA biomarkers is concordant with RNA-sequencing data.
a Correlation plot of qRT-PCR data compared to RNA-sequencing data. P value was calculated by t-test. b, c qRT-PCR Ct values of top four LVQ genes identified from MM versus NC (b) and top 5 LVQ genes identified from HCC versus NC (c). Center-line for boxplots in both b and c indicates the median value across all patients in that group, and the hinges represent the lower (Q1) and upper (Q3) quartile, with whiskers extending to the minimum and maximum of the resulting distribution.
Fig. 5
Fig. 5. cfRNA biomarkers and classification models validated in independent sample set.
a, c Linear discriminant analysis in the validation cohort using top ten LVQ genes identified and classification models trained on the pilot cohort for MM versus NC, and HCC versus NC. P value was calculated for each pair by the Wilcoxon rank-sum test. Center-line indicates the median value across all patients in that group, and the hinges represent the lower (Q1) and upper (Q3) quartile, with whiskers extending to the minimum and maximum of the resulting distribution. b, d ROC curves of these same classification models, trained on the pilot sample set and tested with the validation sample set, using the top ten LVQ genes identified from the pilot sample set.
Fig. 6
Fig. 6. cfRNA biomarkers show clinical stage-dependent discrimination in pilot and validation sample sets.
ad Linear discriminant analysis using the top ten LVQ genes and model trained in the pilot cohort shows significant discrimination and classification by clinical stage in both HCC (a, b) and MM (c, d). eh When classifying the independent validation cohort with these same models, we see stage-dependent classification for both HCC (e, f) and MM (g, h). P value for each pair in (a, c, e, g) was calculated by the Wilcoxon rank-sum test, and elements of the boxplots include the median value across all patients in that group shown by the center-line and the hinges which represent the lower (Q1) and upper (Q3) quartile, with whiskers extending to the minimum and maximum of the resulting distribution.
Fig. 7
Fig. 7. cfRNA biomarkers for HCC show discrimination between various etiologies.
a Linear discriminant analysis trained on the pilot cohort with the top ten LVQ genes show significant discrimination between NC and HCC on the background of NASH, HCV+, and other etiologies in the pilot cohort and the validation cohort (b). P value for each pair was calculated by the Wilcoxon rank-sum test. Center-line in each boxplot indicates the median value across all patients in that group, and the hinges represent the lower (Q1) and upper (Q3) quartile, with whiskers extending to the minimum and maximum of the resulting distribution.

References

    1. SEER. Cancer Stat Facts: Liver and Intrahepatic Bile Duct Cancer (National Cancer Institute, 2018)
    1. Howlader N. et al. SEER Cancer Statistics Review, 1975–2018 (National Cancer Institute, 2021)
    1. Kyle RA, Rajkumar SV. Management of monoclonal gammopathy of undetermined significance (MGUS) and smoldering multiple myeloma (SMM) Oncol. 2011;25:578–586. - PMC - PubMed
    1. Dhodapkar MV. MGUS to myeloma: a mysterious gammopathy of underexplored significance. Blood. 2016;128:2599. doi: 10.1182/blood-2016-09-692954. - DOI - PMC - PubMed
    1. Llovet JM, et al. Hepatocellular carcinoma. Nat. Rev. Dis. Prim. 2016;2:16018. doi: 10.1038/nrdp.2016.18. - DOI - PubMed