. 2022 Jun;28(6):1232-1239.
doi: 10.1038/s41591-022-01768-5. Epub 2022 Apr 25.

Swarm learning for decentralized artificial intelligence in cancer histopathology

Affiliations

Swarm learning for decentralized artificial intelligence in cancer histopathology

Oliver Lester Saldanha et al. Nat Med. 2022 Jun.

Abstract

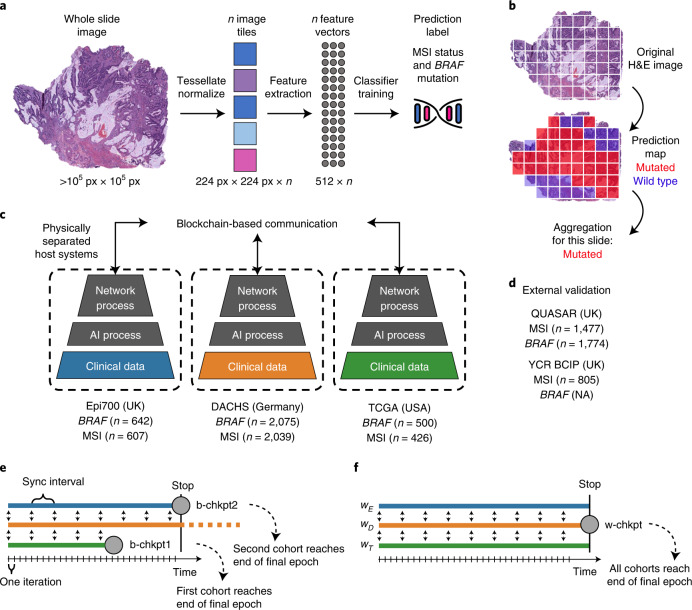
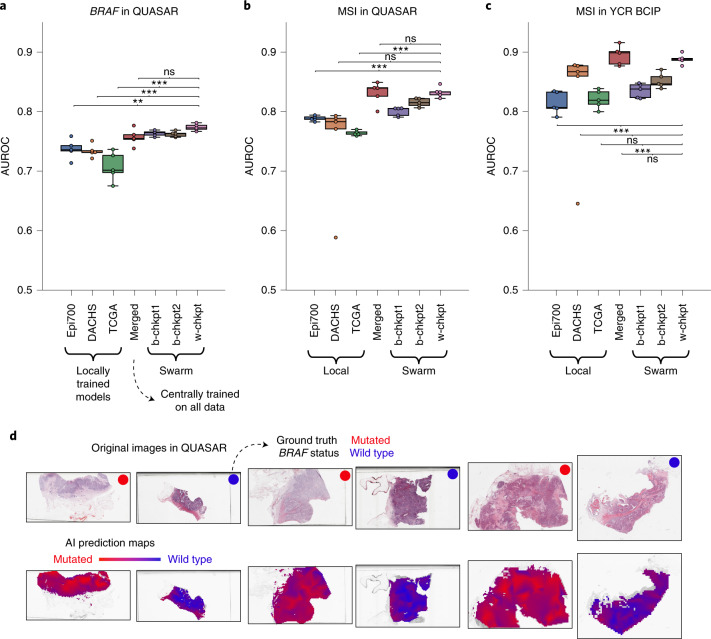
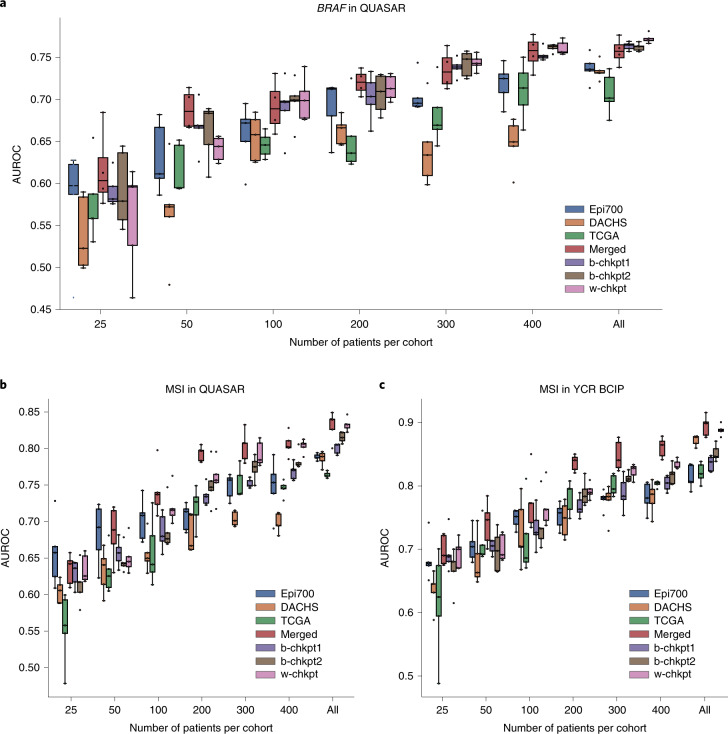
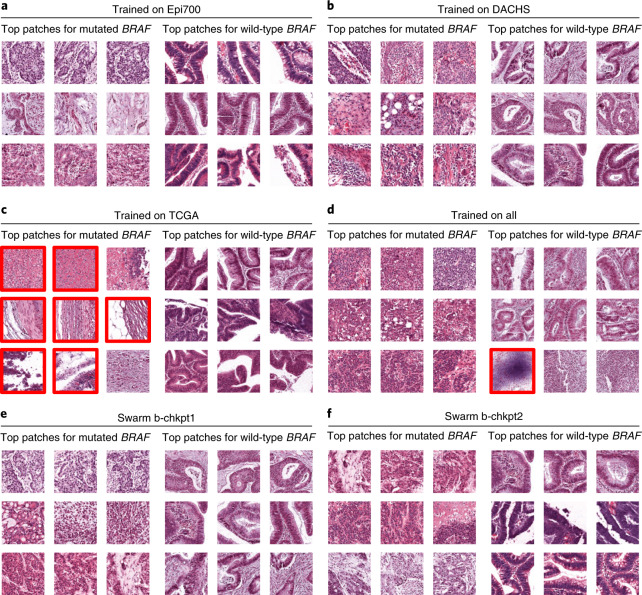
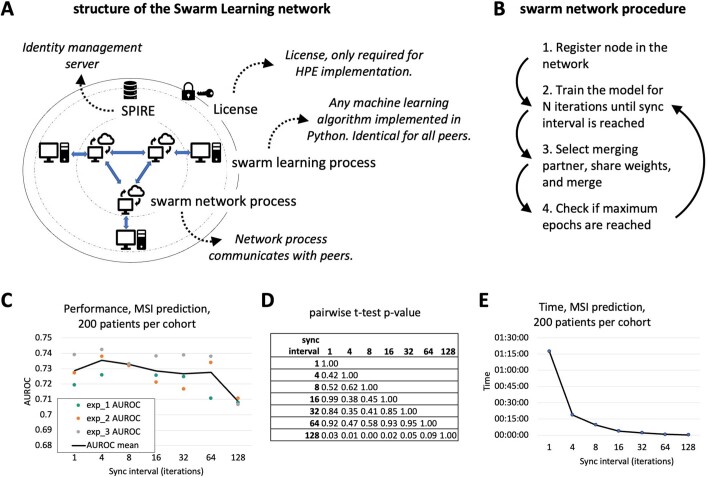
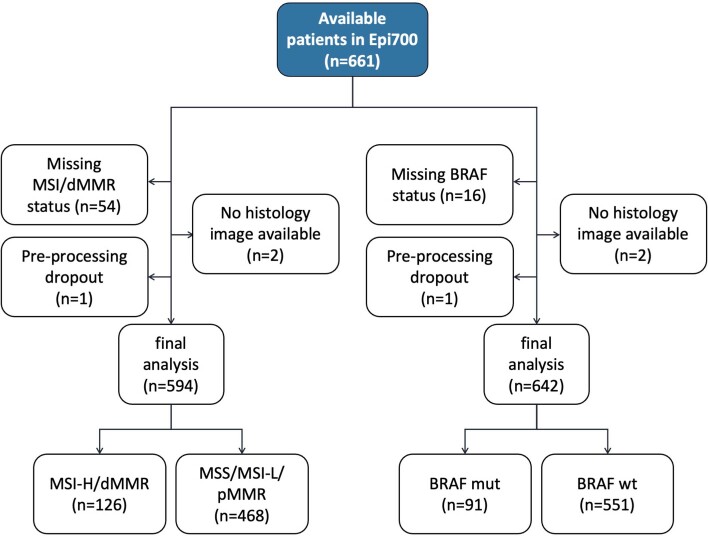
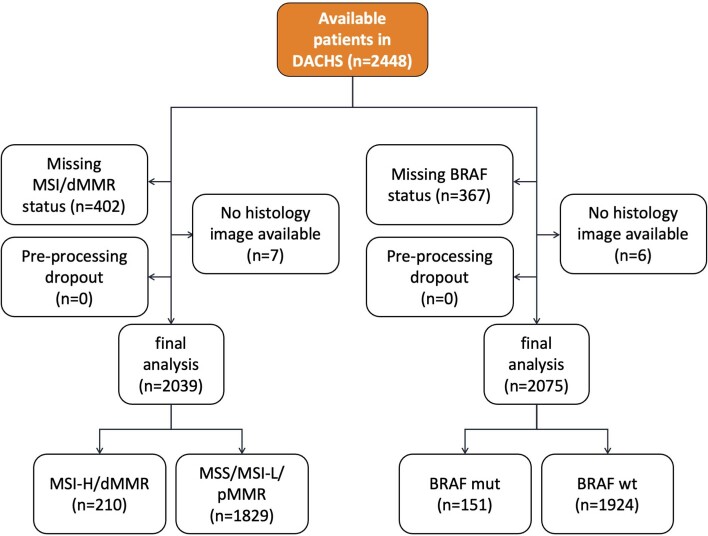
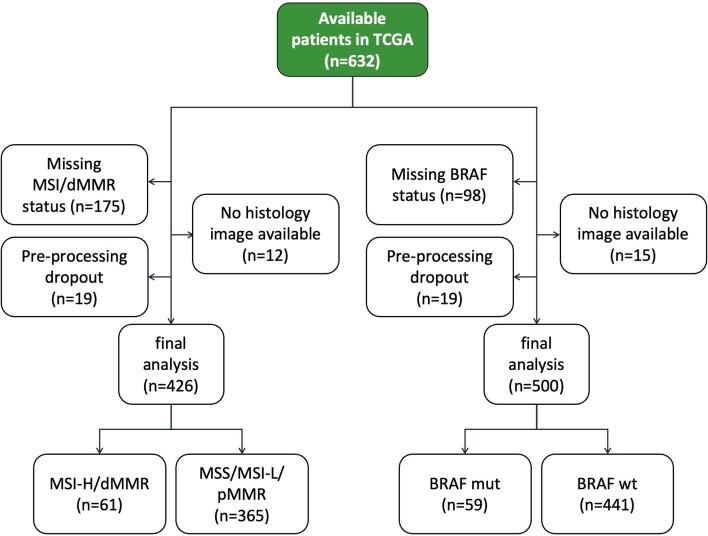
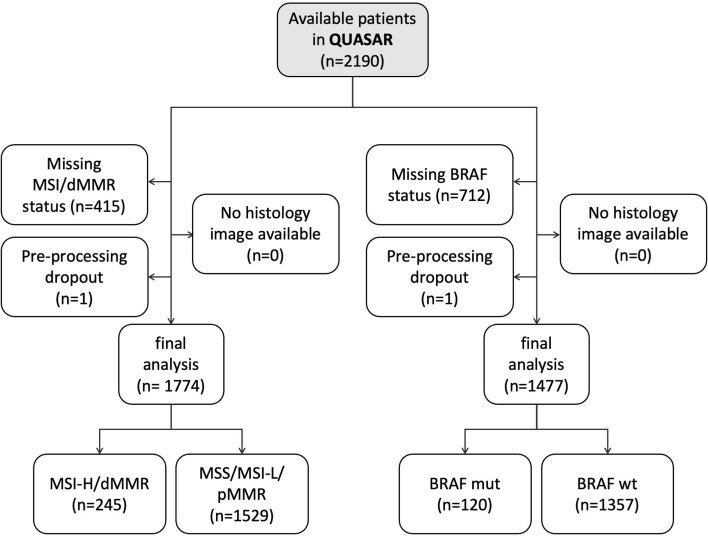
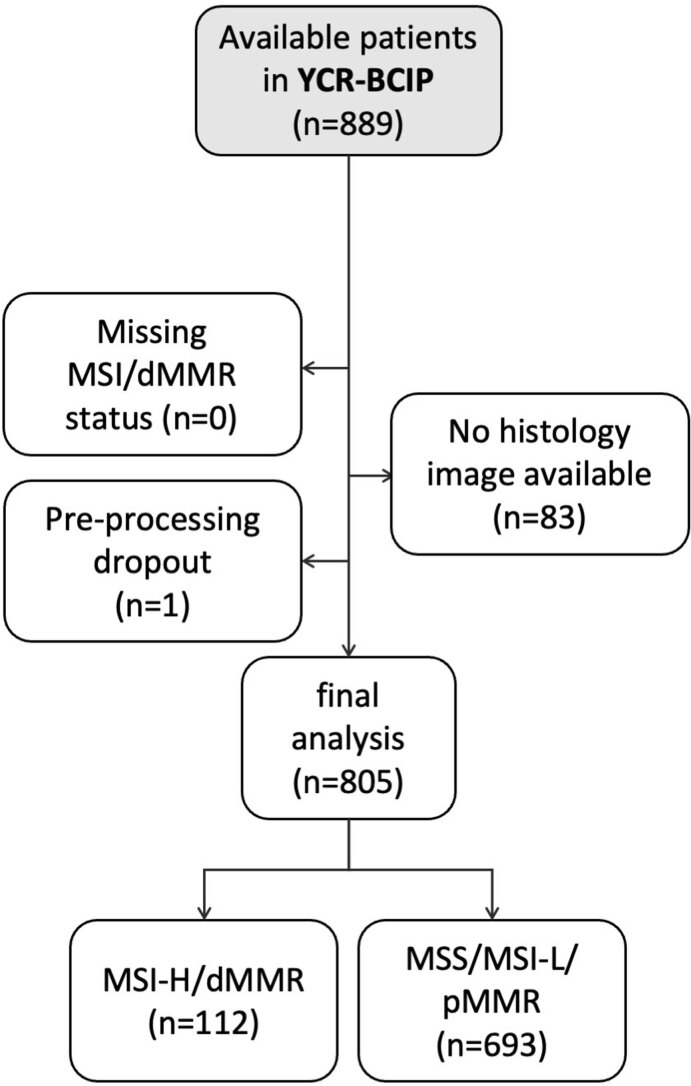
Artificial intelligence (AI) can predict the presence of molecular alterations directly from routine histopathology slides. However, training robust AI systems requires large datasets for which data collection faces practical, ethical and legal obstacles. These obstacles could be overcome with swarm learning (SL), in which partners jointly train AI models while avoiding data transfer and monopolistic data governance. Here, we demonstrate the successful use of SL in large, multicentric datasets of gigapixel histopathology images from over 5,000 patients. We show that AI models trained using SL can predict BRAF mutational status and microsatellite instability directly from hematoxylin and eosin (H&E)-stained pathology slides of colorectal cancer. We trained AI models on three patient cohorts from Northern Ireland, Germany and the United States, and validated the prediction performance in two independent datasets from the United Kingdom. Our data show that SL-trained AI models outperform most locally trained models, and perform on par with models that are trained on the merged datasets. In addition, we show that SL-based AI models are data efficient. In the future, SL can be used to train distributed AI models for any histopathology image analysis task, eliminating the need for data transfer.


Conflict of interest statement

J.N.K. declares consulting services for Owkin, France, and Panakeia, UK. P.Q. and N.P.W. declare research funding from Roche, and P.Q. declares consulting and speaker services for Roche. M.S.-T. has recently received honoraria for advisory work in relation to the following companies: Incyte, MindPeak, MSD, BMS and Sonrai; these are all unrelated to this work. No other potential conflicts of interest are reported by any of the authors. The authors received advice from the HPE customer support team when performing this study, but HPE did not have any role in study design, conducting the experiments, interpretation of the results or decision to submit for publication.

Figures

Fig. 1
Fig. 1. Schematic of the deep learning and SL workflows.
a, Histology image analysis workflow for training. b, Histology image analysis workflow for model deployment (inference). c, SL workflow and training cohorts included in this study. On three physically separate bare-metal servers (dashed line), three different sets of clinical data reside. Each server runs an AI process (a program that trains a model on the data) and a network process (a program that handles communication with peers via blockchain). d, Test cohorts included in this study. e, Schematic of the basic SL experiment. For basic SL, the number of epochs is equal for all cohorts, and weights are equal for all cohorts. f, Schematic of the weighted SL experiment. For weighted SL, the number of epochs is larger for small cohorts, and weights are smaller for small cohorts (wE = weight for the Epi700 cohort, wD = weight for the DACHS cohort, wT = weight for the TCGA cohort). Icon credits: a, OpenMoji (CC BY-SA 4.0); c,d, Twitter Twemoji (CC-BY 4.0).
Fig. 2
Fig. 2. AI-based prediction of molecular alterations by local, merged and swarm models.
a, Classification performance (AUROC) for prediction of BRAF mutational status at the patient level in the QUASAR dataset. Total cohort sizes (number of patients, for BRAF mutational status) in the training set are 642 for Epi700, 2,075 for DACHS and 500 for TCGA. Total cohort size (number of patients, for BRAF mutational status) in the test set is 1,477 for QUASAR. b, AUROC for prediction of MSI status in QUASAR. Total cohort sizes (number of patients, for MSI/dMMR) in the training sets are 594 for Epi700, 2,039 for DACHS and 426 for TCGA. Total cohort size (number of patients, for MSI/dMMR status) in the test set is 1,774 for QUASAR. c, AUROC for prediction of MSI status in the YCR BCIP dataset. Total cohort sizes (number of patients, for MSI/dMMR status) in the training sets are identical to those in b. Total cohort size (number of patients, for MSI/dMMR status) in the test set is 805 for YCR BCIP. In ac, the boxes show the median values and quartiles, the whiskers show the rest of the distribution (except for points identified as outliers), and all original data points are shown. d, Model examination through slide heatmaps of tile-level predictions for representative cases in the QUASAR cohort. *P < 0.05; **P < 0.01; ***P < 0.001; ns, not significant (P > 0.05). Exact P values are available in Supplementary Table 1 (for a), Supplementary Table 2 (for b) and Supplementary Table 3 (for c). All statistical comparisons were made using two-sided t-tests without correction for multiple testing.
Fig. 3
Fig. 3. SL models are data efficient.
a, Classification performance (AUROC) for prediction of BRAF mutational status at the patient level in the QUASAR cohort. Total cohort sizes (number of patients, for BRAF mutational status) in the training sets are 642 for Epi700, 2,075 for DACHS and 500 for TCGA. Total cohort size (number of patients, for BRAF mutational status) in the test set is 1,477 for QUASAR. b, Classification performance (AUROC) for prediction of MSI/dMMR status at the patient level in the QUASAR cohort. Total cohort sizes (number of patients, for MSI/dMMR) in the training sets are 594 for Epi700, 2,039 for DACHS and 426 for TCGA. Total cohort size (number of patients, for MSI/dMMR status) in the test set is 1,774 for QUASAR. c, Classification performance (AUROC) for prediction of MSI/dMMR status at the patient level in the YCR BCIP cohort. Total cohort sizes (number of patients, for MSI/dMMR status) in the training sets are identical to those in b. Total cohort size (number of patients, for MSI/dMMR status) in the test set is 805 for YCR BCIP. In ac, the boxes show the median values and quartiles, the whiskers show the rest of the distribution (except for points identified as outliers), and all original data points are shown.
Fig. 4
Fig. 4. Highly predictive image patches for BRAF prediction.
All patches are from the QUASAR test set and were obtained using the median model (out of five repetitions) trained on 300 randomly selected patients per training cohort. af, Model trained on Epi700 (a), model trained on DACHS (b), model trained on TCGA (c), model trained on all three datasets (d), swarm chkpt1 (e), swarm chkpt2 (f). Tiles with red borders contain artifacts or more than 50% nontumor tissue.
Extended Data Fig. 1
Extended Data Fig. 1. Workflow details and effect of synchronization interval.
(a) Schematic of the structure of the Swarm Learning network in HPE Swarm Learning which was used in this study. (b) Schematic of the training procedure in Swarm Learning. (c) Evaluation of synchronization (sync) interval on the model performance. (d) Pairwise (two-sided) t-tests yielded non-significant (p > 0.05) p-values for all pairwise comparisons of the AUROCs obtained with 1, 4, 8, 16, 32 and 64 iterations between sync events. (e) Time for training with different sync internal. Abbreviations: WSI = whole slide images, MSI = microsatellite instability, SL = swarm learning, SN = swarm network, SPIRE = SPIFFE Runtime Environment. All statistical comparisons were made with two-sided t-tests without correction for multiple testing.
Extended Data Fig. 2
Extended Data Fig. 2. CONSORT chart for Epi700.
Initial patient number in this dataset, exclusions and missing values, and final patient number.
Extended Data Fig. 3
Extended Data Fig. 3. CONSORT chart for DACHS.
Initial patient number in this dataset, exclusions and missing values, and final patient number.
Extended Data Fig. 4
Extended Data Fig. 4. CONSORT chart for TCGA.
Initial patient number in this dataset, exclusions and missing values, and final patient number.
Extended Data Fig. 5
Extended Data Fig. 5. CONSORT chart for QUASAR.
Initial patient number in this dataset, exclusions and missing values, and final patient number.
Extended Data Fig. 6
Extended Data Fig. 6. CONSORT chart for YCR-BCIP.
Initial patient number in this dataset, exclusions and missing values, and final patient number.
Extended Data Fig. 7
Extended Data Fig. 7. Results of the blinded reader study.
For each model (seven model types, BRAF and MSI/dMMR prediction tasks, positive and negative class), a blinded observer scored the presence of five relevant histopathological patterns or structures in the highly scoring image tiles. (a) Presence of relevant patterns or structures in highly scoring tiles in the BRAF mutated class for BRAF prediction models trained on 300 patients per cohort, as scored by the blinded observer. P-values indicate a two-sided comparison between the three local models and the three Swarm-trained models for each feature. (b) Presence of relevant patterns or structures in highly scoring tiles in the MSI/dMMR for MSI status prediction models trained on 300 patients per cohort, as scored by the blinded observer. (c) Same experiment as panel (A), but for the models which were trained on all patients in all cohorts. (d) Same experiment as panel (B), but for the models which were trained on all patients in all cohorts. Abbreviations: MSI = mismatch repair deficiency, B-Chkpt = basic Swarm Learning experiment checkpoint, W-Chkpt = weighted Swarm Learning experiment checkpoint, TILs = tumor-infiltrating lymphocytes, Poor Diff. = poor differentiation, Crohn’s like = Crohn’s like lymphoid reaction, N/A = not applicable (division by zero). All statistical comparisons were made with two-sided t-tests without correction for multiple testing.

Comment in

References

    1. Kleppe A, et al. Designing deep learning studies in cancer diagnostics. Nat. Rev. Cancer. 2021;21:199–211. doi: 10.1038/s41568-020-00327-9. - DOI - PubMed
    1. Boehm KM, Khosravi P, Vanguri R, Gao J, Shah SP. Harnessing multimodal data integration to advance precision oncology. Nat. Rev. Cancer. 2022;22:114–126. doi: 10.1038/s41568-021-00408-3. - DOI - PMC - PubMed
    1. Echle A, et al. Deep learning in cancer pathology: a new generation of clinical biomarkers. Br. J. Cancer. 2021;124:686–696. doi: 10.1038/s41416-020-01122-x. - DOI - PMC - PubMed
    1. Elemento O, Leslie C, Lundin J, Tourassi G. Artificial intelligence in cancer research, diagnosis and therapy. Nat. Rev. Cancer. 2021;21:747–752. doi: 10.1038/s41568-021-00399-1. - DOI - PubMed
    1. Benjamens S, Dhunnoo P, Meskó B. The state of artificial intelligence-based FDA-approved medical devices and algorithms: an online database. npj Digit. Med. 2020;3:118. doi: 10.1038/s41746-020-00324-0. - DOI - PMC - PubMed

Publication types