. 2023 Feb;55(2):751-766.
doi: 10.3758/s13428-022-01813-8. Epub 2022 Apr 25.

Determining the value of preferred goods based on consumer demand in a home-cage based test for mice

Affiliations

Determining the value of preferred goods based on consumer demand in a home-cage based test for mice

Pia Kahnau et al. Behav Res Methods. 2023 Feb.

Abstract

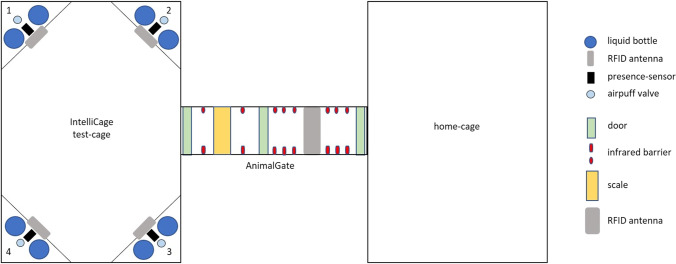
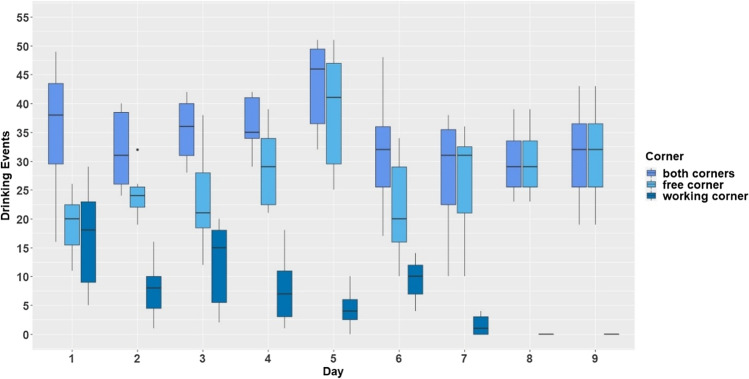
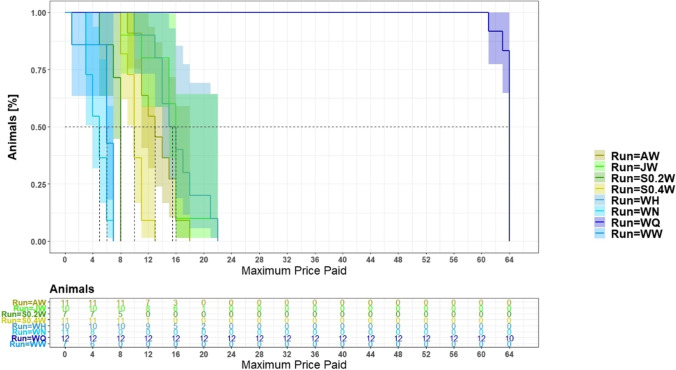
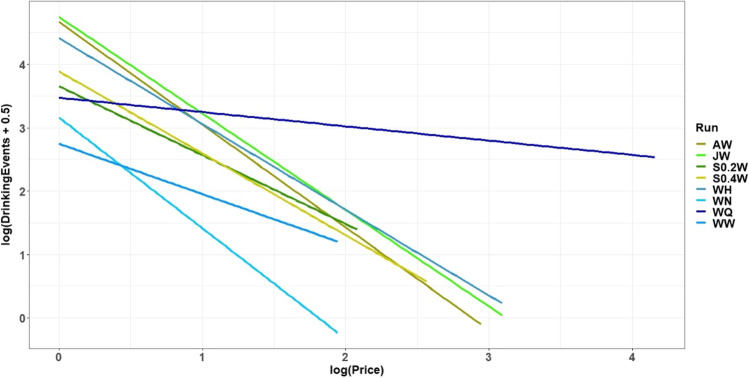
From the preference of one good over another, the strength of the preference cannot automatically be inferred. While money is the common denominator to assess the value of goods in humans, it appears difficult at first glance to put a price tag on the decisions of laboratory animals. Here we used consumer demand tests to measure how much work female mice expend to obtain access to different liquids. The mice could each choose between two liquids, one of which was free. The amount of work required to access the other liquid, by contrast, increased daily. In this way, the value of the liquid can be determined from a mouse's microeconomic perspective. The unique feature is that our test was carried out in a home-cage based setup. The mice lived in a group but could individually access the test-cage, which was connected to the home-cage via a gate. Thereby the mice were able to perform their task undisturbed by group members and on a self-chosen schedule with minimal influence by the experimenter. Our results show that the maximum number of nosepokes depends on the liquids presented. Mice worked incredibly hard for access to water while a bitter-tasting solution was offered for free whereas they made less nosepokes for sweetened liquids while water was offered for free. The results demonstrate that it is possible to perform automated and home-cage based consumer demand tests in order to ask the mice not only what they like best but also how strong their preference is.

Keywords: Consumer demand; Group housing; Home-cage; IntelliCage; Mice; Preference test.


Figures

Fig. 1
Fig. 1
Automated and home-cage-based test setup. The test setup consisted of a test-cage (IntelliCage), a gate (AnimalGate) and a home-cage. The IntelliCage contained bedding but no nesting or food. Within the IntelliCage each of the four corners was equipped with two water dispensers, one radio frequency identification (RFID) antenna, one presence-sensor, and one air-puff valve (air puffs were, however, not used during the consumer demand test). The AnimalGate contained three doors, eight infrared barriers, one scale and one RFID antenna. The home-cage contained bedding, nesting, two shelters, and food which was available ad libitum
Fig. 2
Fig. 2
Time the mice spent within the IntelliCage for the runs WW, WQ, and AW (W = water, Q = quinine, A = almond milk). The data for days 53 and 54 of run WQ are missing due to technical problems with the AnimalGate. On the y-axis, time spent in the IC by the mice is shown in minutes. The x-axis shows the experimental days, which can be equated with the price (number of nosepokes) for the liquids within the working corner
Fig. 3
Fig. 3
Number of entries the mice made during the run WQ. The data for days 53 and 54 of run WQ are missing due to technical problems with the AnimalGate. On the y-axis, the IC entries are shown. The x-axis shows the experimental days, which can be equated with the price for the liquids within the working corner. The number of IC entries are shown on a logarithmic scale, while the labels are retained on the original scale. The dashed lines mark the days on which the setup was cleaned
Fig. 4
Fig. 4
Visit duration in working corner for run WQ (W = water, Q = quinine). On the y-axis, the time the mice spent within the working corner is shown. The x-axis shows the price the mice had to pay for the access to water. The price can be equated with the experimental days. The visit duration is shown on a logarithmic scale, while the original scale is retained for the axis labels
Fig. 5
Fig. 5
Comparison of drinking events for water in run WW (W = water). The y-axis shows the drinking events which the mice made within the working corner and the free corner. The x-axis shows the experimental day. The day can be equated with the price the mice had to pay for access to water in the working corner while water within the free corner was available for the price of one nosepoke for all days
Fig. 6
Fig. 6
Proportion of mice with specific maximum price paid in the different runs. The highlighted areas are the confidence intervals. The y-axis shows the animals which paid the required price. The x-axis shows the price the mice had to pay for the access to the liquids. The price is to be equated with the experimental days. W = water, A = almond milk, Q = quinine, N = NaCl, S = sucrose, H = HCl, J = apple juice. For order of runs and sample sizes, see Table 1
Fig. 7
Fig. 7
Consumer demand curves. The data are plotted logarithmically. On the x-axis are the required nosepoke numbers for the access to the different liquids (price). On the y-axis are the values for the number of drinking events for each liquid. The curves end at the maximum number of nosepokes that was reached by any of the mice (A = almond milk, W = water, Q = quinine, N = NaCl, S = sucrose, H = HCl, J = apple juice)

References

    1. Acosta J, Bussi IL, Esquivel M, Höcht C, Golombek DA, Agostino PV. Circadian modulation of motivation in mice. Behavioural Brain Research. 2020;382(January):112471. doi: 10.1016/j.bbr.2020.112471. - DOI - PubMed
    1. Ago A, Gonda T, Takechi M, Takeuchi T, Kawakami K. Preferences for paper bedding material of the laboratory mice. Experimental Animals. 2002;51(2):157–161. doi: 10.1538/expanim.51.157. - DOI - PubMed
    1. Banjanin S, Mrosovsky N. Preferences of mice, Mus Musculus, for different types of running wheel. Laboratory Animals. 2000;34(3):313–318. doi: 10.1258/002367700780384681. - DOI - PubMed
    1. Bates D, Machler M, Bolker B, Walker S. Fitting linear mixed-effects models using {lme4} Journal of Statistical Software. 2015;67(1):1–48. doi: 10.18637/jss.v067.i01. - DOI
    1. Canty, A., & Ripley, B. D. (2021). boot: Bootstrap R (S-plus) function. R Package. Version 1.3–28.

Publication types

LinkOut - more resources