. 2022 Aug;102(2):293-306.
doi: 10.1016/j.kint.2022.02.038. Epub 2022 Apr 22.

Reticulon-1A mediates diabetic kidney disease progression through endoplasmic reticulum-mitochondrial contacts in tubular epithelial cells

Affiliations

Reticulon-1A mediates diabetic kidney disease progression through endoplasmic reticulum-mitochondrial contacts in tubular epithelial cells

Yifan Xie et al. Kidney Int. 2022 Aug.

Abstract

Recent epidemiological studies suggest that some patients with diabetes progress to kidney failure without significant albuminuria and glomerular injury, suggesting a critical role of kidney tubular epithelial cell (TEC) injury in diabetic kidney disease (DKD) progression. However, the major risk factors contributing to TEC injury and progression in DKD remain unclear. We previously showed that expression of endoplasmic reticulum-resident protein Reticulon-1A (RTN1A) increased in human DKD, and the increased RTN1A expression promoted TEC injury through endoplasmic reticulum (ER) stress response. Here, we show that TEC-specific RTN1A overexpression worsened DKD in mice, evidenced by enhanced tubular injury, tubulointerstitial fibrosis, and kidney function decline. But RTN1A overexpression did not exacerbate diabetes-induced glomerular injury or albuminuria. Notably, RTN1A overexpression worsened both ER stress and mitochondrial dysfunction in TECs under diabetic conditions by regulation of ER-mitochondria contacts. Mechanistically, ER-bound RTN1A interacted with mitochondrial hexokinase-1 and the voltage-dependent anion channel-1 (VDAC1), interfering with their association. This disengagement of VDAC1 from hexokinase-1 resulted in activation of apoptotic and inflammasome pathways, leading to TEC injury and loss. Thus, our observations highlight the importance of ER-mitochondrial crosstalk in TEC injury and the salient role of RTN1A-mediated ER-mitochondrial contact regulation in DKD progression.

Keywords: diabetic kidney disease; endoplasmic reticulum stress; endoplasmic reticulum-mitochondrial contacts; kidney tubular epithelial cells.


Conflict of interest statement

DISCLOSURES: The authors have declared that no conflict of interest exists.

Figures

Figure 1:
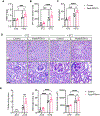
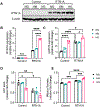
Figure 1:. TEC-specific RTN1A overexpression accelerated renal function decline in STZ-induced diabetic mice.
(A) Kidney-to-body weight (K/BW) ratio at 29 weeks post-diabetes induction in control and Pax8-RTN1A mice. (B) Total 24-hour urinary albumin excretion at 29 weeks post-diabetes induction. (C) Blood urea nitrogen (BUN) levels at 29 weeks post-diabetes induction. (D) Representative images of periodic acid-Schiff (PAS)-stained kidneys at 100x (top) and 400x magnifications (scale bars: 20μm, top panel, and 10μm, bottom panel). (E) Quantification of average tubular injury score, mesangial matrix fraction (%) and the glomerular area is shown per mouse (n=5 mice per group).*p<0.05, **p<0.01, ***p<0.001, and ****p<0.0001 between indicated groups by two-way ANOVA with Tukey's post hoc analysis or nonparametric Mann-Whitney test (for tubular injury scores).
Figure 2:
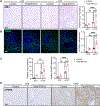
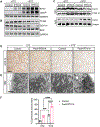
Figure 2:. TEC-specific RTN1A overexpression accelerated renal fibrosis in STZ-induced diabetic mice.
(A) Masson's trichrome-stained kidney sections of control and Pax8-RTN1A mice. Scale bar, 25μm. (B) Representative image of collagen 1A immunostained kidney sections. DNA is counterstained in blue. Scale bar, 30μm. (C) Quantification of average fold change in collagen 1A+ area is shown per mouse (n=5 mice per group, 10-12 fields evaluated per mouse). *p<0.05, ***p<0.001, and ****p<0.0001 between indicated groups by two-way ANOVA with Tukey's post hoc analysis.
Figure 3:
Figure 3:. TEC-specific RTN1A overexpression accelerated tubular injury and death in STZ-induced diabetic mice.
(A) Representative image of KIM-1 immunostaining shows significant KIM-1 staining only in the diabetic Pax8-RTN1A mouse kidneys. Scale bar, 30μm. Real-time PCR analysis of Havcr1 in kidney cortices of control and Pax8-RTN1A mice is shown on the right (n=3 mice per group). (B) TUNEL-stained kidney sections. DNA is counterstained in blue. Scale bar, 10μm. Quantification of average TUNEL+ cells per field per mouse is shown on the right (n=5 mice per group, 10-12 fields evaluated per mouse). (C) Real-time PCR analysis of ER stress markers Chop and Gadd34 in kidney cortices of mice (n=3 mice per group). (D) Representative images of phosphorylated PERK (p-PERK) in kidney sections of control and Pax8-RTN1A mice. Scale bar, 20μm. *p<0.05, **p<0.01, ***p<0.001, and ****p<0.0001 between indicated groups by two-way ANOVA with Tukey’s post hoc analysis.
Figure 4:
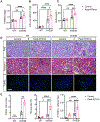
Figure 4:. TEC-specific RTN1A overexpression accelerated renal function decline and renal fibrosis in OVE26 diabetic mice. Nondiabetic (WT) and diabetic OVE26 mice were evaluated at 24 weeks of age.
(A) Kidney-to-body weight (K/BW) ratio. (B) Total 24-hour urinary albumin excretion. (C) Blood urea nitrogen (BUN) levels. (D) Representative images of periodic acid-Schiff (PAS)-, Masson's trichrome-, and TUNEL-stained kidneys. Scale bars: 30μm. (E) Quantification of average tubular injury score, trichrome-stained fibrosis area (%), and TUNEL+ cells per field is shown per mouse (n=5 mice per group). *p<0.05, **p<0.01, ***p<0.001, and ****p<0.0001 between indicated groups by two-way ANOVA with Tukey's post hoc analysis or nonparametric Mann-Whitney test (for tubular injury scores).
Figure 5:
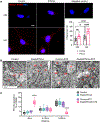
Figure 5:. RTN1A overexpression increased the EMC contact sites cultured cells and reduced the distance of EMCs in tubular cells in vivo.
(A) Representative images of in situ proximity ligation assay targeting IP3R3-VDAC1 interaction in control or RTN1A overexpressing HK2 cells that were cultured high mannitol (HM, 25mM+5mM glucose) or high glucose (HG, 30mM) media for 24 hours. PLA red fluorescent dots indicate the location and extent of IP3R3-VDAC1 interaction. Nuclei were stained with DAPI. Each picture is representative of a typical cell staining observed in 10 fields chosen at random. Scale bar, 10μm. Quantification of the PLA signal per cell is shown on the right (average number of dots per cell, n=10 fields per condition). *p<0.05, **p<0.01, and ****p<0.0001 between indicated groups by two-way ANOVA with Tukey’s post hoc analysis. (B) Representative transmission EM images of areas of mitochondria-ER appositions in control and diabetic mice. Examples of distances are indicated. Scale bar, 20μm. (C) Quantification of the relative amount of OMM in contact with ER for each distance category (less than 5, between 6-10, and between 11-20nm). n=10-50 mitochondria in 10 fields per group. ****p<0.0001 compared to all groups by two-way ANOVA with Tukey’s post hoc analysis.
Figure 6:
Figure 6:. RTN1A enhances high glucose-induced ER stress and mitochondrial dysfunction in HK2 cells in high glucose conditions.
Control or RTN1A-overexpressing HK2 cells were incubated with media containing normal glucose (NG, 5mM), high mannitol (HM, 25mM+5mM glucose), or high glucose (HG, 30mM) for 24 hours. (A-B) Western blot analysis of RTN1A and densitometric analysis of RTN1A expression normalized to β-actin, shown as fold change to NG control. N.S., not significant. (C) Real-time PCR analysis of GPR78 expression in cells. (D) Average fold change in ATP levels. (E) Average fold change in MitoSOX signals. *p<0.05, **p<0.01, ***p<0.001, and ****p<0.0001 between indicated groups by two-way ANOVA with Tukey's post hoc analysis.
Figure 7:
Figure 7:. TEC-specific RTN1A overexpression exacerbates mitochondrial dysfunction in kidney cells in STZ-induced diabetic mice.
(A) Western blot analysis of RTN1A and CHOP in lysates of kidney cortices of control and diabetic mice. (B) Western blot analysis of BAX, TFAM, and COX IV in kidneys of control and diabetic mice. (C) Western blot analysis of cytochrome C in the mitochondrial (mito) and cytoplasmic (cyto) fractions of lysates of kidney cortices. Mitochondrial COX IV protein was used to normalize mitochondrial protein loading, and β-actin was used to normalize cytoplasmic protein loading. (D) Representative images of COX IV immunostaining in kidneys of mice. Some non-specific nuclear staining of COX IV was also noted in all samples. Scale bar, 30μm. (E) Representative images of transmission electron microscopy of mitochondria in TECs of mice. Scale bar, 2μm. (F) The quantification of the mitochondrial morphologic changes (n=3 mice per group, ***p<0.001 and ****p<0.0001 between indicated groups by two-way ANOVA with Tukey’s post hoc analysis.).
Figure 8:
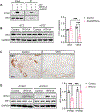
Figure 8:. RTN1A interacts with HK1, and increased RTN1A is associated with reduced HK1 expression in DKD.
(A) Immunoprecipitation (IP) using FLAG-tagged RTN1A overexpressing HK2 cell lysates and western blot analysis using anti-FLAG and anti-HK1 antibodies. Input lysates are shown on the left. (B) Western blot analysis of RTN1A and HK1 expression in kidney cortices of control and diabetic mice. Densitometric analysis is shown on the right (n=3 mice per group). (C) Representative images of HK1 immunostaining in control or DKD biopsy sample. Scale bar, 50μm. (D) Western blot analysis of RTN1A and HK1 expression in HK2 cells with or without PYR41 treatment (25μM for 24 hours).
Figure 9:
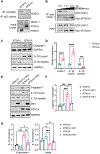
Figure 9:. RTN1A competes for HK1 and VDAC1 interaction to activate the inflammasome pathway.
(A) Top: Lysates of HK2 cells overexpressing RTN1A or RTN1C were immunoprecipitated (IP) with anti-HK1 antibody or control IgG and immunoblotted with VDAC1 antibody. Bottom: Input lysates were immunoblotted with VDAC1, RTN1A, and RTN1C antibodies. (B) Immunoprecipitation was performed using purified recombinant proteins (DDK-tagged HK1, His-tagged VDAC1, and Myc-tagged RTN1A). Interaction of HK1 and VDAC1 was assessed with increasing amounts of RTN1A (B) or RTN1C (C) using anti-His antibody and immunoblotted with DDK and Myc antibodies. (C-D) Western blot and densitometric analysis of Caspase-1 in HK2 cells with RTN1A or RTN1C overexpression. (D-G) Western blot and densitometric analysis of Caspase-1 and IL-1β HK2 cells overexpressing RTN1C or RTN1A with or without HK1 overexpression. *p<0.05, **p<0.01, ***p<0.001, and ****p<0.0001 between indicated groups by one-way ANOVA with Tukey's post hoc analysis.

Similar articles

Cited by

References

    1. Collins AJ, Foley RN, Herzog C, et al. US Renal Data System 2010 Annual Data Report. Am J Kidney Dis 57: A8, e1–526. - PubMed
    1. Mauer M, Zinman B, Gardiner R, et al. ACE-I and ARBs in early diabetic nephropathy. Journal of the renin-angiotensin-aldosterone system : JRAAS 2002; 3: 262–269. - PubMed
    1. Bonventre JV. Can we target tubular damage to prevent renal function decline in diabetes? Semin Nephrol 2012; 32: 452–462. - PMC - PubMed
    1. Fioretto P, Mauer M. Histopathology of diabetic nephropathy. Semin Nephrol 2007; 27: 195–207. - PMC - PubMed
    1. Garofolo M, Russo E, Miccoli R, et al. Albuminuric and non-albuminuric chronic kidney disease in type 1 diabetes: Association with major vascular outcomes risk and all-cause mortality. J Diabetes Complications 2018; 32: 550–557. - PubMed

Publication types