. 2022 Jul:61:101499.
doi: 10.1016/j.molmet.2022.101499. Epub 2022 Apr 22.

Loss of UCP1 function augments recruitment of futile lipid cycling for thermogenesis in murine brown fat

Affiliations

Loss of UCP1 function augments recruitment of futile lipid cycling for thermogenesis in murine brown fat

Josef Oeckl et al. Mol Metab. 2022 Jul.

Abstract

Objective: Classical ATP-independent non-shivering thermogenesis enabled by uncoupling protein 1 (UCP1) in brown adipose tissue (BAT) is activated, but not essential for survival, in the cold. It has long been suspected that futile ATP-consuming substrate cycles also contribute to thermogenesis and can partially compensate for the genetic ablation of UCP1 in mouse models. Futile ATP-dependent thermogenesis could thereby enable survival in the cold even when brown fat is less abundant or missing.

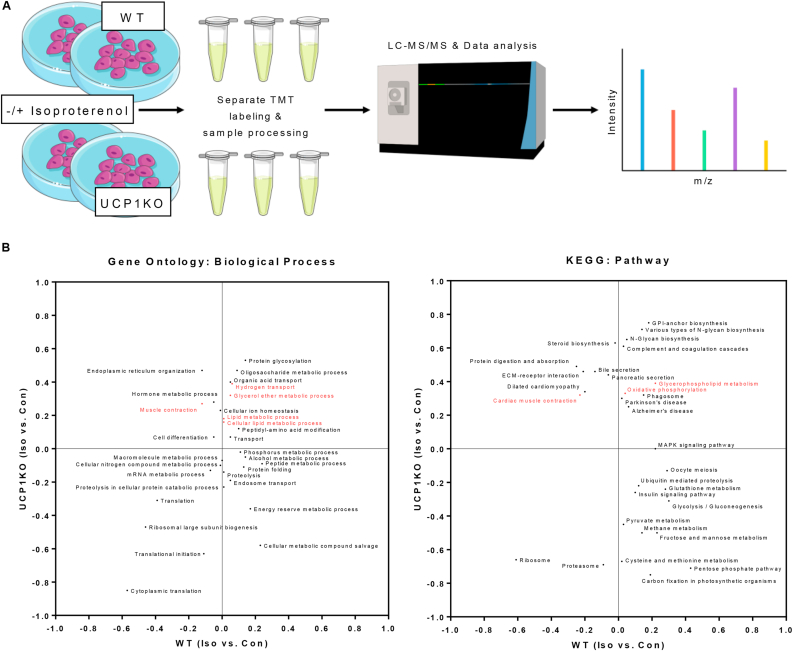
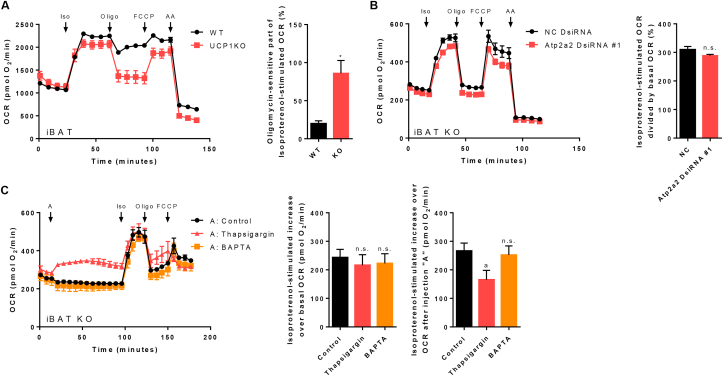
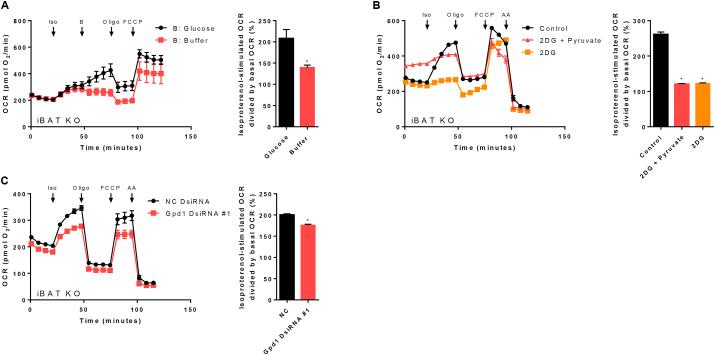
Methods: In this study, we explore different potential sources of UCP1-independent thermogenesis and identify a futile ATP-consuming triglyceride/fatty acid cycle as the main contributor to cellular heat production in brown adipocytes lacking UCP1. We uncover the mechanism on a molecular level and pinpoint the key enzymes involved using pharmacological and genetic interference.

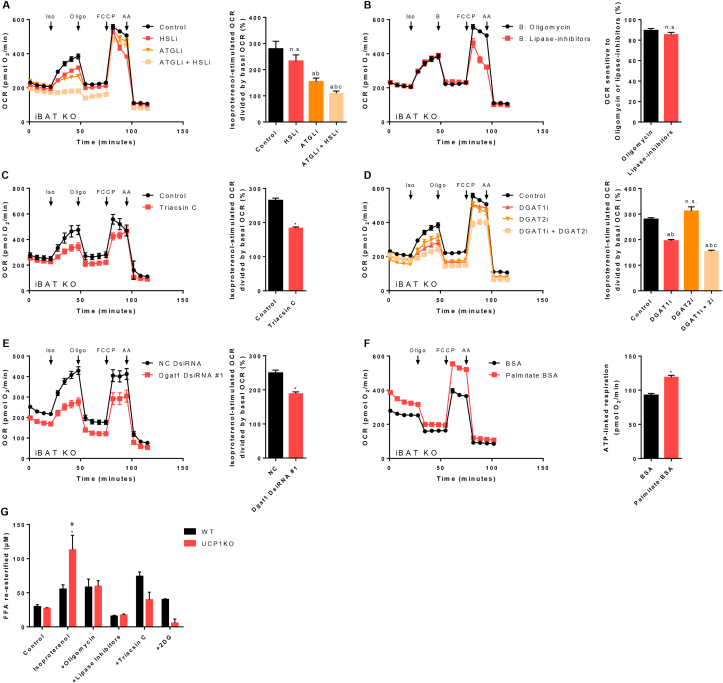
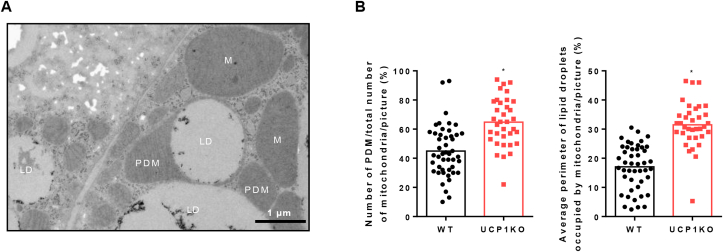
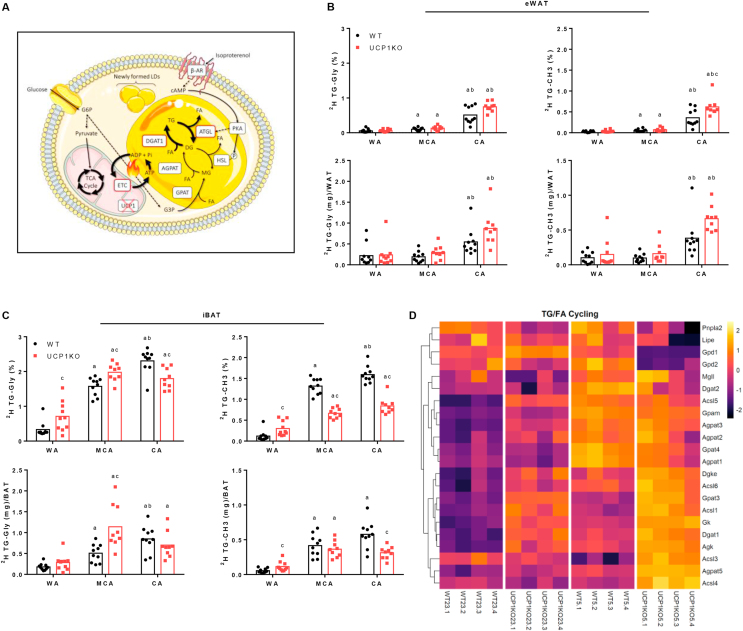
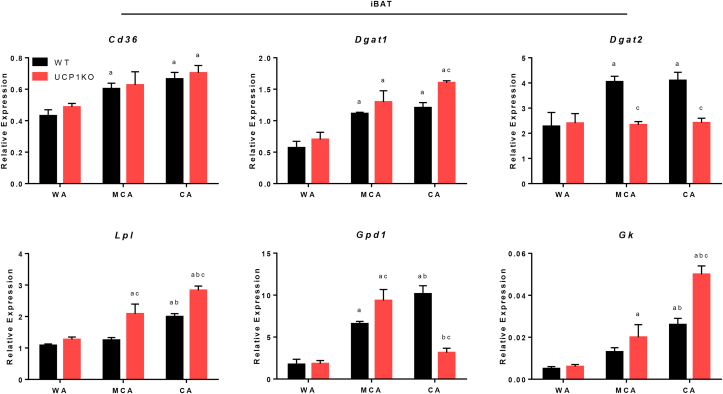
Results: ATGL is the most important lipase in terms of releasing fatty acids from lipid droplets, while DGAT1 accounts for the majority of fatty acid re-esterification in UCP1-ablated brown adipocytes. Furthermore, we demonstrate that chronic cold exposure causes a pronounced remodeling of adipose tissues and leads to the recruitment of lipid cycling capacity specifically in BAT of UCP1-knockout mice, possibly fueled by fatty acids from white fat. Quantification of triglyceride/fatty acid cycling clearly shows that UCP1-ablated animals significantly increase turnover rates at room temperature and below.

Conclusion: Our results suggest an important role for futile lipid cycling in adaptive thermogenesis and total energy expenditure.

Keywords: Brown adipose tissue; Fatty acids; Futile substrate cycle; Lipolysis; Re-esterification; UCP1-independent thermogenesis.


Figures

Figure 1
Figure 1
Proteins associated with futile calcium and lipid cycling are acutely upregulated during active lipolysis in brown UCP1-knockout adipocytes. A) Schematic depiction of sample generation, processing, and subsequent proteome analysis. Primary cultures of fully differentiated 129Sv/S1 brown wild type (WT) and UCP1-knockout (UCP1KO) adipocytes were stimulated with 500 nM isoproterenol (Iso) for 30 min. WT and UCP1KO samples were processed and analyzed separately. Pathway enrichment comparing Iso versus no treatment (Con) was performed within each genotype. The complete set of processed mass spectrometry data can be found in Supp. Table 2. B) Two-dimensional annotation enrichment analysis showing biological processes and pathways, which are significantly regulated upon adrenergic stimulation in at least one of the two genotypes. Terms that are preferentially upregulated in stimulated UCP1KO adipocytes and downregulated or not affected in WT cells are located above the x-axis and near or to the left of the y-axis. Values between 0 < x ≤ 1 indicate an upregulation after the addition of isoproterenol, whereas values between −1 ≤ x < 0 indicate a downregulation. Terms related to futile substrate cycles are highlighted in red. Not all terms are displayed due to overlapping points. The complete set of pathways can be found in Supp. Table 3. n = 5 independent biological experiments.
Figure 2
Figure 2
Futile calcium cycling does not contribute to cellular thermogenesis in murine brown UCP1-knockout adipocytes. A) Seahorse XF24 extracellular flux measurement of primary cultures of fully differentiated 129Sv/S1 brown wild type (WT) and UCP1-knockout (UCP1KO) adipocytes and quantification of the oligomycin-sensitive part of stimulated oxygen consumption rate (OCR). n = 10–12 wells from two independent biological experiments. A two-tailed Welch-test was applied. Asterisk (∗) indicates a significant difference between the two groups. Isoproterenol (Iso), oligomycin (Oligo), carbonyl cyanide-4-(trifluoromethoxy)phenylhydrazone (FCCP), antimycin A (AA). B) & C) XF96 extracellular flux measurements of primary cultures of fully differentiated 129Sv/S1 brown UCP1KO adipocytes. B) Atp2a2 was knocked down in brown UCP1KO adipocytes with DsiRNA as described in “Material & Methods” and the isoproterenol-induced increase in OCR was calculated. n = 17–25 wells from three independent biological experiments. A two-tailed t-test was applied. Not statistically significant (n.s.). C) Brown UCP1KO adipocytes were acutely treated with thapsigargin (5 μM final) or BAPTA (20 μM final) for 1 h and the response to isoproterenol was monitored (left). Compounds were added as an injection via port “A”. The isoproterenol-induced increase in OCR over basal OCR (middle) and over OCR after the addition of compounds (right) was calculated. n = 18–23 wells from three independent biological experiments. One-way ANOVA followed by Tukey's HSD was applied. “a” indicates a significant difference from the control group. Not statistically significant (n.s.).
Figure 3
Figure 3
A futile cycle of lipolysis and re-esterification of fatty acids mediates non-shivering thermogenesis in brown UCP1-knockout adipocytes. A) – F) XF96 extracellular flux measurements of primary cultures of fully differentiated 129Sv/S1 brown UCP1-knockout (UCP1KO) adipocytes. A) Cells were pre-treated with an HSL inhibitor (HSLi, 20 μM final), an ATGL inhibitor (ATGLi, 40 μM final), or both inhibitors (ATGLi + HSLi) for 1 h prior to the measurement and inhibitors were present in the assay medium throughout the measurement. Isoproterenol-induced increase in oxygen consumption rate (OCR) was calculated. n = 18–24 wells from three independent biological experiments. One-way ANOVA followed by Tukey's HSD was applied. “a” indicates a significant difference from the control group, “b” from the HSLi group, and “c” from the ATGLi group. Not statistically significant (n.s.). B) Oligomycin delivered via the second injection (port “B”) was replaced with a combination of the ATGL and the HSL inhibitor. Portion of stimulated OCR sensitive to oligomycin or lipase-inhibitors was calculated. n = 21 wells from three independent biological experiments. A two-tailed t-test was applied. Not statistically significant (n.s.). C) Cells were pre-treated with a long-chain acyl-CoA synthetase inhibitor (Triacsin C, 5 μM final) for 1 h prior to the measurement and triacsin C was present in the assay medium throughout the measurement. Isoproterenol-induced increase in oxygen consumption rate (OCR) was calculated. n = 15–22 wells from three independent biological experiments. A two-tailed t-test was applied. Asterisk (∗) indicates a significant difference between the two groups. D) Cells were pre-treated with a DGAT1 inhibitor (DGAT1i, 40 μM final), a DGAT2 inhibitor (DGAT2i, 40 μM final), or both inhibitors (DGAT1i + DGAT2i) for 16 h prior to the measurement and inhibitors were present in the assay medium throughout the measurement. Isoproterenol-induced increase in oxygen consumption rate (OCR) was calculated. n = 20–21 wells from three independent biological experiments. One-way ANOVA followed by Tukey's HSD was applied. “a” indicates a significant difference from the control group, “b” from the DGAT2i group, and “c” from the DGAT1i group. Not statistically significant (n.s.). E) Dgat1 was knocked down in brown UCP1KO adipocytes with DsiRNA as described in “Material & Methods” and the isoproterenol-induced increase in OCR was calculated. n = 27–30 wells from three independent biological experiments. A two-tailed t-test was applied. Asterisk (∗) indicates a significant difference between the two groups. F) Palmitate conjugated to bovine serum albumin (Palmitate:BSA, 160 μM Palmitate:28 μM BSA final) or just BSA (28 μM final) was added to the BSA-free assay medium immediately prior to starting the measurement and ATP-linked OCR was quantified. n = 37–43 wells from three independent biological experiments. A two-tailed t-test was applied. Asterisk (∗) indicates a significant difference between the two groups. G) 129Sv/S1 brown wild type (WT) and UCP1KO cells were pre-treated as described in “Material & Methods”, glycerol and free fatty acids (FFAs) in the medium were quantified, and the amount of re-esterified FFA was calculated. 2-deoxyglucose (2DG, 50 mM final). n = two independent biological experiments (within each experiment, the content of 8 wells of each treatment level was pooled). Kruskal–Wallis two-way ANOVA followed by multiple comparisons with a Bonferroni-corrected Mann–Whitney U test was applied. Asterisk (∗) indicates a significant difference from the control group of the respective genotype. Number sign (#) indicates a significant difference between the two genotypes within one treatment level.
Figure 4
Figure 4
Glycolysis fuels UCP1-independent thermogenesis in brown adipocytes lacking UCP1. A) – C) XF96 extracellular flux measurements of primary cultures of fully differentiated 129Sv/S1 brown UCP1-knockout (UCP1KO) adipocytes. A) Cells were assayed in glucose-free medium. Glucose (25 mM final) or buffer was delivered via the second injection (port “B”) and the isoproterenol-induced increase in OCR was calculated. n = 10–16 wells from two independent biological experiments. A two-tailed t-test was applied. Asterisk (∗) indicates a significant difference between the two groups. B) Cells were pre-treated with 2-deoxyglucose (2DG, 50 mM final) or a combination of 2DG and pyruvate (2DG + Pyruvate; 2DG 50 mM final, pyruvate 5 mM final). Isoproterenol-induced increase in OCR was calculated. n = 16–28 wells from three independent biological experiments. One-way ANOVA followed by Tukey's HSD was applied. Asterisk (∗) indicates a significant difference from the control group. C) Gpd1 was knocked down in brown UCP1KO adipocytes with DsiRNA as described in “Material & Methods” and the isoproterenol-induced increase in OCR was calculated. n = 28–31 wells from three independent biological experiments. A two-tailed t-test was applied. Asterisk (∗) indicates a significant difference between the two groups.
Figure 5
Figure 5
Brown UCP1-knockout adipocytes have a higher number of peridroplet mitochondria and mitochondria are tightly associated with lipid droplets. A) Representative electron micrograph of a fully differentiated 129Sv/S1 brown UCP1-knockout (UCP1KO) cell including lipid droplets, mitochondria, and peridroplet mitochondria (PDM). Scale bar represents 1 μm “LD” indicates a lipid droplet, “M” a mitochondrion, and “PDM” a peridroplet mitochondrion. B) (Left) Relative proportion of PDM in relation to the total number of mitochondria in 129Sv/S1 brown wild type (WT) and UCP1KO adipocytes. (Right) Relative proportion of lipid droplet perimeter occupied by mitochondria. n = 35–46 pictures from two independent biological experiments. A two-tailed t-test was applied. Asterisk (∗) indicates a significant difference between the two groups.
Figure 6
Figure 6
Futile lipid cycling is recruited for non-shivering thermogenesis in adipose tissues of UCP1-knockout mice. A) Graphical summary of futile triglyceride/fatty acid (TG/FA) cycling in adipocytes. In response to a cold sensation, norepinephrine, here mimicked by isoproterenol, binds to adrenergic receptors and triggers the downstream cAMP-PKA-signalling cascade, which leads to the activation of lipolysis. ATGL and HSL-mediated hydrolysis of TGs and diglycerides (DGs) causes an immediate increase in cellular FA levels. The majority of newly released FA in brown UCP1KO adipocytes is re-esterified onto DGs and possibly to a lesser extent onto monoglycerides (MGs) as well as G3P. In this setting, more glucose is taken up to replenish the TCA cycle, maintain protonmotive force, and most importantly to provide G3P backbones serving as FA acceptor molecules. Primarily DGAT1 but potentially also other acyltransferases, such as glycerol-3-phosphate acyltransferases (GPATs) and 1-acylglycerol-3-phosphate O-acyltransferase (AGPATs), catalyze the esterification of FA derived from intracellular TG stores or taken up from the circulation, which is preceded by the ATP-dependent activation. The breakdown of TGs is simultaneously counterbalanced by re-synthesis, and thus lipid flux in both directions accelerates causing ATP turnover to increase without altering metabolite levels. Thereby, ATP consumption, its anaerobic glycolytic provision, and generation of ATP via oxidative phosphorylation directly linked to the flux through the mitochondrial electron transport chain (ETC) can be adjusted by enhancing or reducing lipid flux, which represents the theoretical foundation of TG/FA cycling. This figure was created using Servier Medical Art templates, which are licensed under a Creative Commons Attribution 3.0 Unported License; https://smart.servier.com. B) Futile TG/FA cycling activity and de novo lipogenesis in epididymal white adipose tissue (eWAT) of C57BL/6J wild type (WT) and UCP1-knockout (UCP1KO) mice acclimated to different ambient temperatures: 30 °C “warm-acclimated” (WA), 20 °C “mild cold-acclimated” (MCA), or 6 °C “cold-acclimated” (CA), for at least three weeks. n = 9–10 animals from two independent experiments. Relative enrichment is shown in top panels; enrichment per depot considering total tissue weight (Table 3) is shown in bottom panels. A two-way ANOVA followed by Tukey's HSD was applied. “a” indicates a significant difference from the WA group of the respective genotype. “b” indicates a significant difference from the MCA group of the respective genotype. “c” indicates a significant difference between the two genotypes within one treatment level. C) Futile TG/FA cycling activity and de novo lipogenesis in interscapular brown adipose tissue (iBAT) of WA, MCA, and CA C57BL/6J WT and UCP1KO mice. n = 9–10 animals from two independent experiments. Relative enrichment is shown in top panels; enrichment per depot considering total tissue weight (Table 3) is shown in bottom panels. A two-way ANOVA followed by Tukey's HSD was applied. “a” indicates a significant difference from the WA group of the respective genotype. “b” indicates a significant difference from the MCA group of the respective genotype. “c” indicates a significant difference between the two genotypes within one treatment level. D) Regulation of proteins potentially involved in TG/FA cycling in iBAT of C57BL/6N WT and UCP1KO mice acclimated to 23 °C or 5 °C. The complete set of processed mass spectrometry data can be found in Supp. Table 4. n = 4 animals. Column labels represent individual mice: WT (WT23) and UCP1KO (UCP1KO23) mice acclimated to 23 °C, WT (WT5) and UCP1KO (UCP1KO5) mice acclimated to 5 °C. Row labels represent gene symbols of proteins. Normalized protein intensities were scaled by calculating z-scores for each protein. Cell color indicates z-score. Abbreviations: Long-chain acyl-CoA synthetase (Acsl), acylglycerol kinase (Agk), 1-acylglycerol-3-phosphate O-acyltransferase (Agpat), diacylglycerol O-acyltransferase (Dgat), diacylglycerol kinase epsilon (Dgke), glycerol kinase (Gk), mitochondrial glycerol-3-phosphate acyltransferase (Gpam), glycerol-3-phosphate acyltransferase (Gpat), glycerol-3-phosphate dehydrogenase (Gpd), hormone-sensitive lipase (Lipe), monoglyceride lipase (Mgll), adipose tissue triglyceride lipase (Pnpla2).
Figure 7
Figure 7
Expression of selected genes in iBAT of C57BL/6J wild type (WT) and UCP1-knockout (UCP1KO) mice acclimated to different ambient temperatures: 30 °C “warm-acclimated” (WA), 20 °C “mild cold-acclimated” (MCA), or 6 °C “cold-acclimated” (CA), for at least three weeks. n = 4–5 animals (data from one experiment; confirmed in two independent experiments). “a” indicates a significant difference from the WA group of the respective genotype. “b” indicates a significant difference from the MCA group of the respective genotype. “c” indicates a significant difference between the two genotypes within one treatment level. Abbreviations of genes: CD36 molecule (Cd36), diacylglycerol O-acyltransferase 1 (Dgat1), diacylglycerol O-acyltransferase 2 (Dgat2), glycerol kinase (Gk), glycerol-3-phosphate dehydrogenase 1 (Gpd1), lipoprotein lipase (Lpl).

References

    1. Newsholme E.A., Crabtree B. Substrate cycles in metabolic regulation and in heat generation. Biochem Soc Symp. 1976;(41):61–109. - PubMed
    1. Newsholme E.A. Substrate cycles: their metabolic, energetic and thermic consequences in man. Biochem Soc Symp. 1978;(43):183–205. - PubMed
    1. Newsholme E.A., Arch J.R., Brooks B., Surholt B. The role of substrate cycles in metabolic regulation. Biochem Soc Trans. 1983;11(1):52–56. - PubMed
    1. Newsholme E.A., Board Sounding. A possible metabolic basis for the control of body weight. N Engl J Med. 1980;302(7):400–405. - PubMed
    1. Newsholme E.A., Challiss R.A.J., Crabtree B. Substrate cycles: their role in improving sensitivity in metabolic control. Trends in Biochemical Sciences. 1984;9(6):277–280.

Publication types