

Ultra-processed foods and risk of all-cause mortality in renal transplant recipients
- PMID: 35470855
- PMCID: PMC9170470
- DOI: 10.1093/ajcn/nqac053
Ultra-processed foods and risk of all-cause mortality in renal transplant recipients
Abstract
Background: Renal transplant recipients (RTRs) have a 6-fold higher risk of mortality than age- and sex-matched controls. Whether high consumption of ultra-processed foods is associated with survival in RTRs is unknown.
Objectives: We aimed to study the association between high consumption of ultra-processed foods and all-cause mortality in stable RTRs.
Methods: We conducted a prospective cohort study in adult RTRs with a stable graft. Dietary intake was assessed using a validated 177-item FFQ. Food items were categorized according to the NOVA classification system and the proportion ultra-processed foods comprised of total food weight per day was calculated.
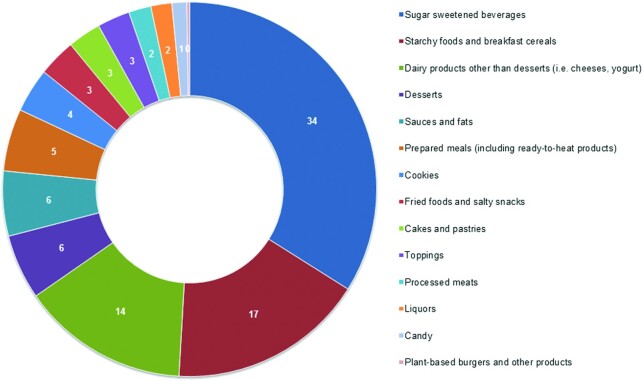
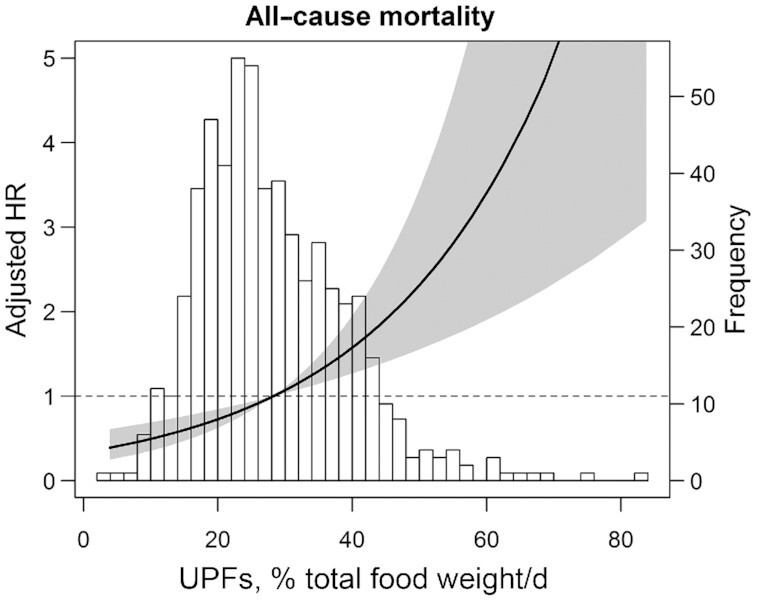
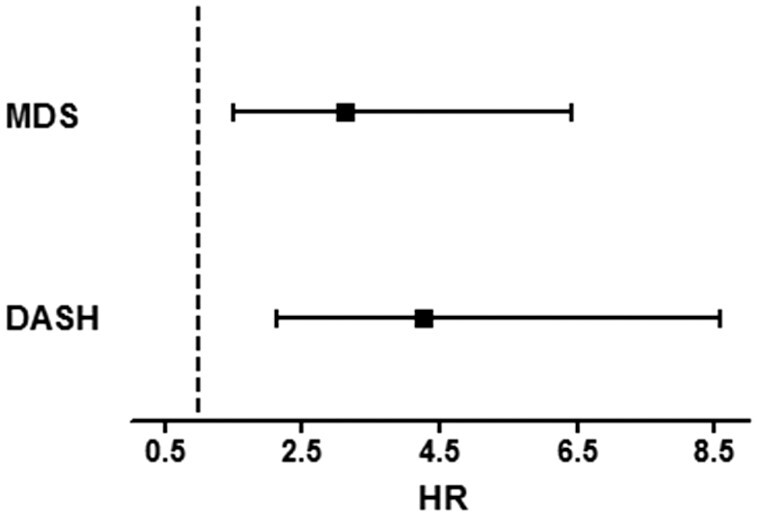
Results: We included 632 stable RTRs (mean ± SD age: 53.0 ± 12.7 y, 57% men). Mean ± SD consumption of ultra-processed foods was 721 ± 341 g/d (28% of total weight of food intake), whereas the intake of unprocessed and minimally processed foods, processed culinary ingredients, and processed foods accounted for 57%, 1%, and 14%, respectively. During median follow-up of 5.4 y [IQR: 4.9-6.0 y], 129 (20%) RTRs died. In Cox regression analyses, ultra-processed foods were associated with all-cause mortality (HR per doubling of percentage of total weight: 2.13; 95% CI: 1.46, 3.10; P < 0.001), independently of potential confounders. This association was independent from the quality of the overall dietary pattern, expressed by the Mediterranean Diet Score (MDS) or Dietary Approaches to Stop Hypertension (DASH) score. When analyzing ultra-processed foods by groups, only sugar-sweetened beverages (HR: 1.21; 95% CI: 1.05, 1.39; P = 0.007), desserts (HR: 1.24; 95% CI: 1.02, 1.49; P = 0.03), and processed meats (HR: 1.87; 95% CI: 1.22, 2.86; P = 0.004) were associated with all-cause mortality.
Conclusions: Consumption of ultra-processed foods, in particular sugar-sweetened beverages, desserts, and processed meats, is associated with a higher risk of all-cause mortality after renal transplantation, independently of low adherence to high-quality dietary patterns, such as the Mediterranean diet and the DASH diet.This trial was registered at clinicaltrials.gov as NCT02811835.
Keywords: NOVA; all-cause mortality; diet; renal transplant recipients; ultra-processed foods.
© The Author(s) 2022. Published by Oxford University Press on behalf of the American Society for Nutrition.
Figures
Comment in
-
Food processing in nutritional epidemiology: proceed with caution.Am J Clin Nutr. 2022 Jun 7;115(6):1455-1456. doi: 10.1093/ajcn/nqac069. Am J Clin Nutr. 2022. PMID: 35467720 No abstract available.
References
-
- Ponton P, Rupolo GP. Quality-of-life change after kidney transplantation. Transplant Proc. 2001;33(1–2):1887–9. - PubMed
-
- Wolfe RA, Ashby VB, Milford EL, Ojo AO, Ettenger RE, Agodoa LY, Held PJ, Port FK. Comparison of mortality in all patients on dialysis, patients on dialysis awaiting transplantation, and recipients of a first cadaveric transplant. N Engl J Med. 1999;341(23):1725–30. - PubMed
-
- Oterdoom LH, de Vries APJ, van Ree RM, Gansevoort RT, van Son WJ, van der Heide JJH, Navis G, de Jong PE, Gans ROB, Bakker SJL. N-terminal pro-B-type natriuretic peptide and mortality in renal transplant recipients versus the general population. Transplantation. 2009;87(10):1562–70. - PubMed
Publication types
MeSH terms
Associated data
LinkOut - more resources
Full Text Sources
Medical
Research Materials
Miscellaneous
