Observational Study
. 2022 Aug;304(2):450-459.
doi: 10.1148/radiol.210363. Epub 2022 Apr 26.

Quantitative CT Characteristics of Cluster Phenotypes in the Severe Asthma Research Program Cohorts

Collaborators, Affiliations
Observational Study

Quantitative CT Characteristics of Cluster Phenotypes in the Severe Asthma Research Program Cohorts

Abhaya P Trivedi et al. Radiology. 2022 Aug.

Abstract

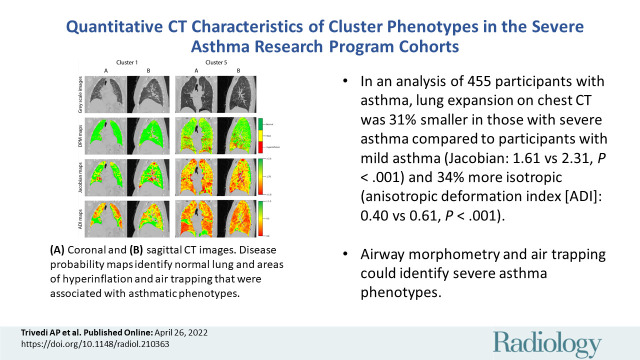
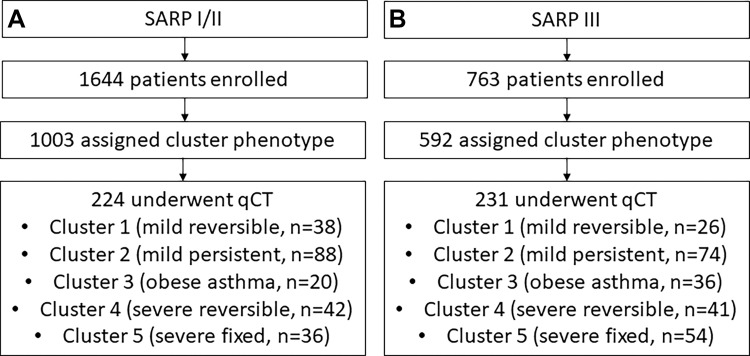
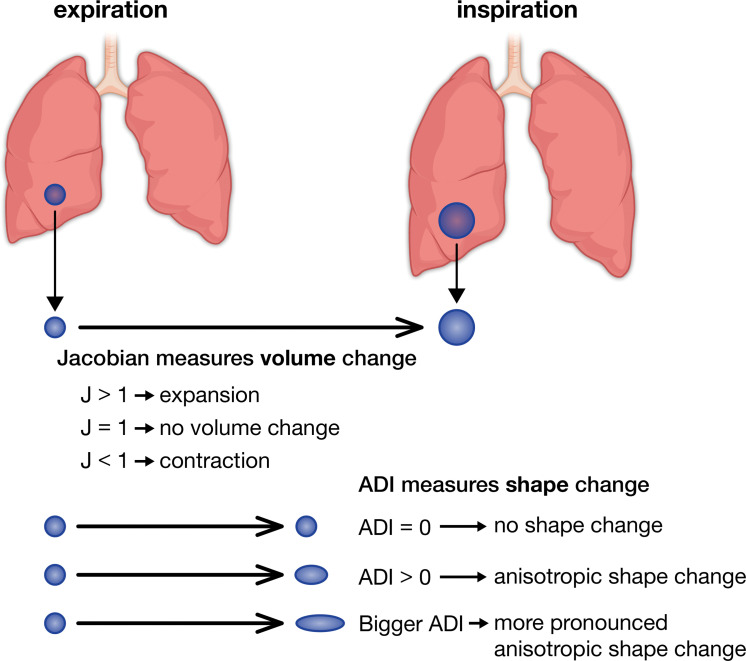
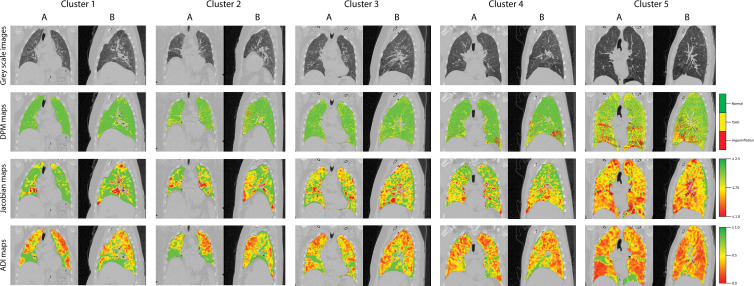
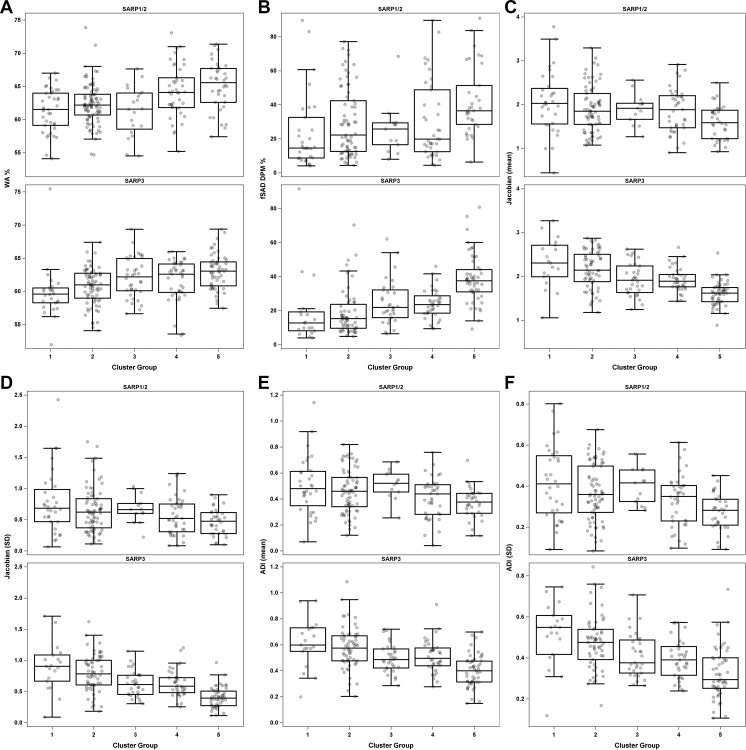
Background Clustering key clinical characteristics of participants in the Severe Asthma Research Program (SARP), a large, multicenter prospective observational study of patients with asthma and healthy controls, has led to the identification of novel asthma phenotypes. Purpose To determine whether quantitative CT (qCT) could help distinguish between clinical asthma phenotypes. Materials and Methods A retrospective cross-sectional analysis was conducted with the use of qCT images (maximal bronchodilation at total lung capacity [TLC], or inspiration, and functional residual capacity [FRC], or expiration) from the cluster phenotypes of SARP participants (cluster 1: minimal disease; cluster 2: mild, reversible; cluster 3: obese asthma; cluster 4: severe, reversible; cluster 5: severe, irreversible) enrolled between September 2001 and December 2015. Airway morphometry was performed along standard paths (RB1, RB4, RB10, LB1, and LB10). Corresponding voxels from TLC and FRC images were mapped with use of deformable image registration to characterize disease probability maps (DPMs) of functional small airway disease (fSAD), voxel-level volume changes (Jacobian), and isotropy (anisotropic deformation index [ADI]). The association between cluster assignment and qCT measures was evaluated using linear mixed models. Results A total of 455 participants were evaluated with cluster assignments and CT (mean age ± SD, 42.1 years ± 14.7; 270 women). Airway morphometry had limited ability to help discern between clusters. DPM fSAD was highest in cluster 5 (cluster 1 in SARP III: 19.0% ± 20.6; cluster 2: 18.9% ± 13.3; cluster 3: 24.9% ± 13.1; cluster 4: 24.1% ± 8.4; cluster 5: 38.8% ± 14.4; P < .001). Lower whole-lung Jacobian and ADI values were associated with greater cluster severity. Compared to cluster 1, cluster 5 lung expansion was 31% smaller (Jacobian in SARP III cohort: 2.31 ± 0.6 vs 1.61 ± 0.3, respectively, P < .001) and 34% more isotropic (ADI in SARP III cohort: 0.40 ± 0.1 vs 0.61 ± 0.2, P < .001). Within-lung Jacobian and ADI SDs decreased as severity worsened (Jacobian SD in SARP III cohort: 0.90 ± 0.4 for cluster 1; 0.79 ± 0.3 for cluster 2; 0.62 ± 0.2 for cluster 3; 0.63 ± 0.2 for cluster 4; and 0.41 ± 0.2 for cluster 5; P < .001). Conclusion Quantitative CT assessments of the degree and intraindividual regional variability of lung expansion distinguished between well-established clinical phenotypes among participants with asthma from the Severe Asthma Research Program study. © RSNA, 2022 Online supplemental material is available for this article. See also the editorial by Verschakelen in this issue.


Conflict of interest statement

Disclosures of Conflicts of Interest: A.P.T. Supported by Severe Asthma Research Program. C.H. Speaker payment or honoraria from VIDA Diagnostics. C.W.G. No relevant relationships. D.L. No relevant relationships. J.G.K. Previous grant to institution from NIH (2T32HL007317); consulting fees from Genentech. M.C.M. No relevant relationships. M.S. No relevant relationships. J.P.S. Stock options in VIDA Diagnostics that provides QCT analysis; employee of VIDA Diagnostics at the time of the QCT analysis. H.L. No relevant relationships. K.B.S. No relevant relationships. J.S. Stock and options held in VIDA Diagnostics; employee of VIDA Diagnostics. S.M. No relevant relationships. S.P. Stock options in VIDA; employee of VIDA. W.C.M. Grant to institution by NHLBI. E.R.B. Clinical trials administered through University of Arizona for AstraZeneca, Novartis, Regeneron, Sanofi, Genzyme; consulting fees from ALK-Abello, AstraZeneca, GlaxoSmithKline, Knopp Pharmaceuticals, Novartis, Regeneron, Sanofi, Genzyme; payment or honoraria from ALK-Abello, AstraZeneca, GlaxoSmithKline; financial support for the NHLBI SARP study activities at the Coordinating and Clinical Centers: AstraZeneca, Boehringer Ingelheim, Genentech, Sanofi-Genzyme-Regeneron, and TEVA; other financial or non-financial interests in NHLBI SARP. D.A.M. Supported for study activities at the Coordinating and Clinical Centers beyond the 3rd year of patient follow-up: AstraZeneca, Boehringer Ingelheim, Genentech, GlaxoSmithKline, Sanofi–Genzyme–Regeneron, and TEVA. E.I. Grant to institution by NHLBI. G.R.W. Payments made to institution from NIH, Boehringer Ingelheim, BTG, Interventional Medicine, Janssen Pharmaceuticals; consulting fees from PulmonX, Novartis, Janssen, Philips, Vertex; travel support through round trip plane ticket from Boston to Chicago from Philips; participation on a DataSafety Monitoring Board or Advisory Board from PulmonX; co-founder and equity share holder of Quantitative Imaging Solutions – a data analytics company. B.D.L. Supported by NHLBI and payments to institution for study activities at the Coordinating and Clinical Centers beyond the third year of patient follow-up: AstraZeneca, Boehringer Ingelheim, Genentech, GlaxoSmithKline, Sanofi–Genzyme–Regeneron, and TEVA; consulting fees from Gossamer Bio, Novartis, Pieris Pharmaceuticals. J.K.L. NIH funding to the University of Pittsburgh. S.E.W. Unrestricted funds to NHLBI, TEVA, and Boehringer Ingelheim to the University of Pittsburgh for support of Severe Asthma Research Program 3; multicenter clinical trials on anti-IL5R and anti-TSLP for AstraZeneca; multicenter clinical trial on Anti-IL33 for GSK; multicenter clinical trial on CRTH2 antagonist; multicenter clinical trial on anti-Eosinophil drug; consulting fees for anti-TSLP from AstraZeneca, for anti-IL-5 from GSK, for anti-TSLP from Novartis, for anti-IL-4R from Sanofi; participation on a DataSafety Monitoring Board or Advisory Board for University of Pittsburgh. J.V.F. Research grants from NHLBI/NIH paid to University of California, San Francisco; research grants paid to UCSF from the Severe Asthma Research program (SARP) Data Center using funds provided to SARP by Teva and Boehringer Ingelheim to support research in SARP; consulting fees from Sound Biologics for early stage drug development for asthma; inventor of WO2014153009A2 - Thiosaccharide mucolytic agents and WO2017197360 - "CT Mucus Score" - A new scoring system that quantifies airway mucus impaction using CT lung scans. Inventor - describes a mucus plug score on CT lung images; founder and board chairman for Aer Therapeutics; stock options in Connect Biopharma. M.L.S. Supported by NHLBI – SARP III and SARP IV; patents in CT mucus scoring; leadership or fiduciary role in Fleischner Society; shareholder in Stemina Biomarker Discovery, X-Vax, Healthmyne, Elucida Oncology, Elucent Medical; member of Radiology editorial board. S.B.F. Institution by NIH/NHLBI SARP 3, NIH/ORIP Pulmonary Ry Imaging Center S10; grants or contracts through institution/department form GE Healthcare; consulting fees from Polarean and Sanofi/Regeneron; payment or honoraria from Sanofi/Regeneron; receipt of services through institution from GE Healthcare. N.N.J. Grants or contracts from NIH funding; consulting fees from GSK, Pulmocide, and AstraZeneca. D.T.M. Supported for study activities at the Coordinating and Clinical Centers beyond the third year of patient follow-up: AstraZeneca, Boehringer Ingelheim, Genentech, GlaxoSmithKline, Sanofi–Genzyme–Regeneron, and TEVA; grant support to institution by NIH; consulting fees from Cohero Health; payments for participation on a DataSafety Monitoring Board or Advisory Board for NIH, Cystic Fibrosis Foundation, Biocryst, and Insmed. J.M.R. NIH grants and a grant from the Roy J. Carver Charitable Trust; royalties or licenses from VIDA Diagnostics; consulting fees from Desmarais; payment for expert testimony from Desmarais; U.S. Patent application 16/914,972 filed on June 27, 2019, and U.S. Patent application 62/846,394 filed on May 10, 2019; stock or stock options in VIDA Diagnostics. J.D.N. NIH grant support to the University of Iowa; grants or contracts from NIH (payments made to institution), VIDA (payments made to author), and Elsevier Publishers (future payments made to author); royalties or licenses from Elsevier Publishers; consulting fees from VIDA; payment or honoraria from VIDA and Elsevier Publishers; travel payments from VIDA; patents with VIDA and University of Iowa; participation with VIDA on multiple pharmaceutical trials; stock options in VIDA. E.A.H. NIH funding for lab to the radiology center for the multicenter study SARP; meeting attendance funded by NIH grant; founder and shareholder of VIDA Diagnostics; participation on the Siemens Photon Counting CT advisory committee. M.C. Payment to institution through the NIH/NHLBI Severe Asthma Research Program Grant; grants or contracts to institution from ALA, PCORI, AstraZeneca, GSK, Novartis, Pulmatrix, Sanofi-Aventis, Shionogi; royalties from Elsevier; consulting fees from Genentech, Teva, Sanofi-Aventis, Novartis; payment or honoraria from AstraZeneca, Genentech, GSK, Regeneron, Sanofi, and Teva; participation on a DataSafety Monitoring Board or Advisory Board for Pulmatrix, Gossamer Bio, ALA, AstraZeneca, Genentech, Chiesi. A.S. No relevant relationships.

Figures

None
Graphical abstract
Flowcharts show the enrollment of the study cohort from the overall
(A) Severe Asthma Research Program (SARP) I and II and (B) SARP III cohorts.
qCT = quantitative CT.
Figure 1:
Flowcharts show the enrollment of the study cohort from the overall (A) Severe Asthma Research Program (SARP) I and II and (B) SARP III cohorts. qCT = quantitative CT.
Visual representation of Jacobian (J) and anisotropic deformation
index (ADI) values. A Jacobian greater than 1 implies expansion of a voxel
between inspiration and expiration, a Jacobian of 1 implies no volume
change, and a Jacobian of less than 1 implies voxel contraction. An ADI of 0
implies that a voxel completely preserves its shape between inspiration and
expiration, while an increasing ADI implies more anisotropic
expansion.
Figure 2:
Visual representation of Jacobian (J) and anisotropic deformation index (ADI) values. A Jacobian greater than 1 implies expansion of a voxel between inspiration and expiration, a Jacobian of 1 implies no volume change, and a Jacobian of less than 1 implies voxel contraction. An ADI of 0 implies that a voxel completely preserves its shape between inspiration and expiration, while an increasing ADI implies more anisotropic expansion.
Representative (A) coronal and (B) sagittal gray-scale CT scans,
disease probability maps (DPMs), Jacobian maps, and anisotropic deformation
index (ADI) images from noncontrast CT scans in patients in the Severe
Asthma Research Program III cohort according to cluster. For DPMs, green
voxels represent normal lung tissue, yellow voxels represent functional air
trapping, and red voxels represent hyperinflation. For Jacobian and ADI
maps, voxels are represented on a gradient from green to yellow to red. For
Jacobian maps, green voxels represent Jacobian values greater than or equal
to 2.5, yellow voxels represent a Jacobian value of 1.75, and red voxels
represent Jacobian values less than or equal to 1.0. For ADI maps, green
voxels represent ADI values greater than or equal to 1.0, yellow voxels
represent an ADI of 0.5, and red voxels represent an ADI of 0. fSAD =
functional small airway disease.
Figure 3:
Representative (A) coronal and (B) sagittal gray-scale CT scans, disease probability maps (DPMs), Jacobian maps, and anisotropic deformation index (ADI) images from noncontrast CT scans in patients in the Severe Asthma Research Program III cohort according to cluster. For DPMs, green voxels represent normal lung tissue, yellow voxels represent functional air trapping, and red voxels represent hyperinflation. For Jacobian and ADI maps, voxels are represented on a gradient from green to yellow to red. For Jacobian maps, green voxels represent Jacobian values greater than or equal to 2.5, yellow voxels represent a Jacobian value of 1.75, and red voxels represent Jacobian values less than or equal to 1.0. For ADI maps, green voxels represent ADI values greater than or equal to 1.0, yellow voxels represent an ADI of 0.5, and red voxels represent an ADI of 0. fSAD = functional small airway disease.
Box plots of means and SDs for key quantitative CT (qCT) measurements
between clusters in Severe Asthma Research Program (SARP) I and II and SARP
III, including (A) wall area (WA) percentage, (B) functional small airway
disease (fSAD) on disease probability maps (DPM), (C) mean Jacobian, (D) SD
of Jacobian, (E) mean anisotropic deformation index (ADI), and (F) SD of
ADI.
Figure 4:
Box plots of means and SDs for key quantitative CT (qCT) measurements between clusters in Severe Asthma Research Program (SARP) I and II and SARP III, including (A) wall area (WA) percentage, (B) functional small airway disease (fSAD) on disease probability maps (DPM), (C) mean Jacobian, (D) SD of Jacobian, (E) mean anisotropic deformation index (ADI), and (F) SD of ADI.

Comment in

References

    1. Nurmagambetov T , Kuwahara R , Garbe P . The Economic Burden of Asthma in the United States, 2008-2013 . Ann Am Thorac Soc 2018. ; 15 ( 3 ): 348– 356 . - PubMed
    1. Hekking PW , Wener RR , Amelink M , Zwinderman AH , Bouvy ML , Bel EH . The prevalence of severe refractory asthma . J Allergy Clin Immunol 2015. ; 135 ( 4 ): 896– 902 . - PubMed
    1. Ivanova JI , Bergman R , Birnbaum HG , Colice GL , Silverman RA , McLaurin K . Effect of asthma exacerbations on health care costs among asthmatic patients with moderate and severe persistent asthma . J Allergy Clin Immunol 2012. ; 129 ( 5 ): 1229– 1235 . - PubMed
    1. Moore WC , Meyers DA , Wenzel SE , et al. . Identification of asthma phenotypes using cluster analysis in the Severe Asthma Research Program . Am J Respir Crit Care Med 2010. ; 181 ( 4 ): 315– 323 . - PMC - PubMed
    1. Moore WC , Hastie AT , Li X , et al. . Sputum neutrophil counts are associated with more severe asthma phenotypes using cluster analysis . J Allergy Clin Immunol 2014. ; 133 ( 6 ): 1557– 63.e5 . - PMC - PubMed

Publication types

Supplementary concepts