. 2022 Apr 26:11:e74277.
doi: 10.7554/eLife.74277.

A bidirectional switch in the Shank3 phosphorylation state biases synapses toward up- or downscaling

Affiliations

A bidirectional switch in the Shank3 phosphorylation state biases synapses toward up- or downscaling

Chi-Hong Wu et al. Elife. .

Abstract

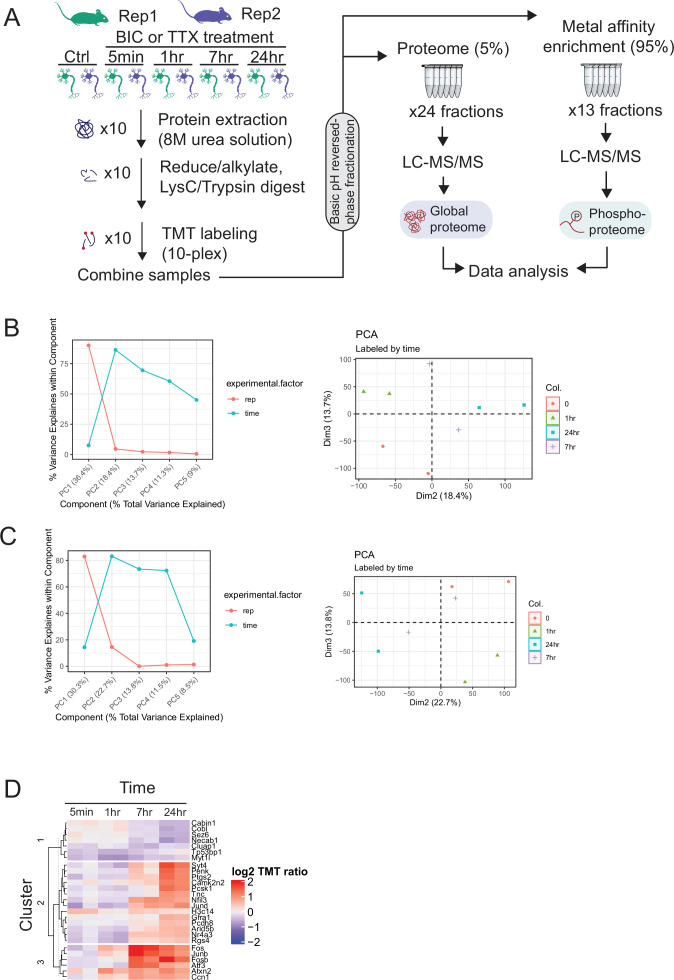
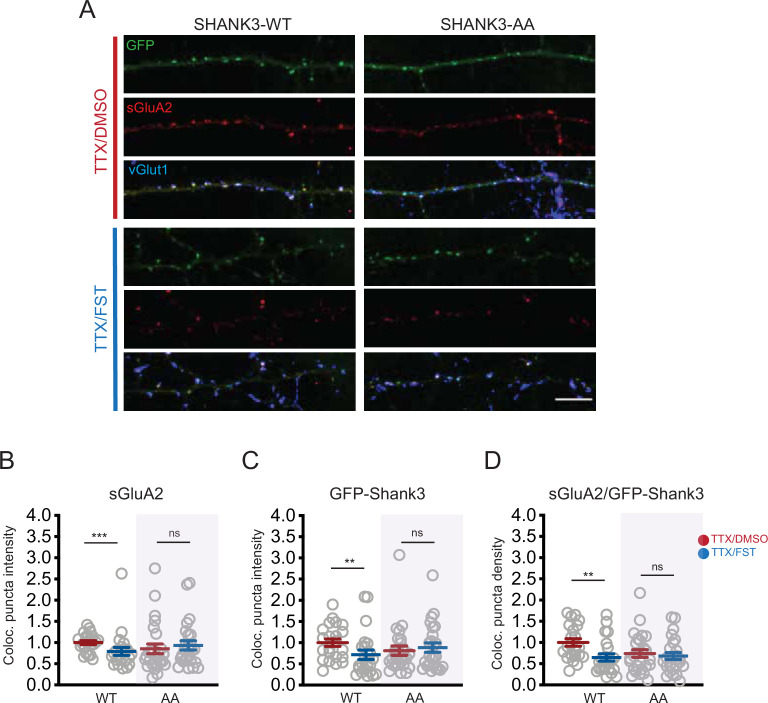
Homeostatic synaptic plasticity requires widespread remodeling of synaptic signaling and scaffolding networks, but the role of post-translational modifications in this process has not been systematically studied. Using deep-scale quantitative analysis of the phosphoproteome in mouse neocortical neurons, we found widespread and temporally complex changes during synaptic scaling up and down. We observed 424 bidirectionally modulated phosphosites that were strongly enriched for synapse-associated proteins, including S1539 in the autism spectrum disorder-associated synaptic scaffold protein Shank3. Using a parallel proteomic analysis performed on Shank3 isolated from rat neocortical neurons by immunoaffinity, we identified two sites that were persistently hypophosphorylated during scaling up and transiently hyperphosphorylated during scaling down: one (rat S1615) that corresponded to S1539 in mouse, and a second highly conserved site, rat S1586. The phosphorylation status of these sites modified the synaptic localization of Shank3 during scaling protocols, and dephosphorylation of these sites via PP2A activity was essential for the maintenance of synaptic scaling up. Finally, phosphomimetic mutations at these sites prevented scaling up but not down, while phosphodeficient mutations prevented scaling down but not up. These mutations did not impact baseline synaptic strength, indicating that they gate, rather than drive, the induction of synaptic scaling. Thus, an activity-dependent switch between hypo- and hyperphosphorylation at S1586 and S1615 of Shank3 enables scaling up or down, respectively. Collectively, our data show that activity-dependent phosphoproteome dynamics are important for the functional reconfiguration of synaptic scaffolds and can bias synapses toward upward or downward homeostatic plasticity.

Keywords: cell biology; homeostatic plasticity; mouse; neuroscience; phosphorylation; rat; synaptic scaling.


Conflict of interest statement

CW, VT, PJ, AG, HK, KK, MM, LL, SC, JC, GT No competing interests declared

Figures

Figure 1.
Figure 1.. The temporal phosphoproteome response induced by synaptic scaling protocols.
(A) Heatmap showing the abundance (log2 TMT ratios to control) of phosphosites with a significant response to tetrodotoxin (TTX) treatment (F-test, adj. p<0.1). Hierarchical clustering shows three major clusters with different temporal profiles. The number of significant phosphosites in each cluster is indicated. (B) Heatmap showing the abundance (log2 TMT ratios to control) of phosphosites with a significant response to bicuculline (BIC) treatment (F-test, adj. p<0.1). Hierarchical clustering shows four major clusters with different temporal profiles. The number of significant phosphosites in each cluster is indicated. (C) Network representation of pathway enrichment results from phosphosites showing a significant response to TTX or BIC treatment. (Top) Temporal profiles are shown for the three TTX clusters and four BIC clusters; thin lines represent individual phosphosites, while thick lines represent the cluster mean. (Bottom) Network showing pathways significantly enriched in each of the TTX/BIC clusters. Pathways are shown as nodes with colors of each node indicating the associated cluster or clusters. Edges connecting the nodes indicate a significant gene overlap between pathways (Jaccard Index > 0.5). Related pathways are clustered and the overall function is summarized in text. The synaptic signaling, neurogenesis, cell membrane, neuronal cell body, and synapse organization clusters show enrichment in response to TTX and BIC treatment in both upregulated and downregulated phosphosites. (D) Upset plot showing the number of unique and overlapping regulated phosphosites across BIC and TTX datasets with directionality. Groups highlighted in red represent a total of 424 phosphosites showing regulation in both BIC and TTX datasets, with opposite directionality. (E) Temporal profile of mouse Shank3 S1539 phosphosite abundance in response to TTX (left) and BIC (right), displaying opposite response to these treatments; different colors represent two biological replicates. Also see Figure 1—figure supplement 1, Figure 1—source data 1, and Figure 1—source data 2.
Figure 1—figure supplement 1.
Figure 1—figure supplement 1.. Proteome and phosphoproteome dynamics in synaptic signaling.
(A) Experimental workflow for deep proteome and phosphoproteome analysis of cortical neuron explants treated with tetrodotoxin (TTX) or bicuculline (BIC). (B) Principal component analysis (PCA) of the TTX phosphoproteome dataset. (Left) Percentage of variance explained by experimental factors in each principal component. Most of the variance is explained by the biological replicate, followed by the treatment time point. (Right) PCA plot shows grouping of replicates by time point in dimensions 2 and 3. (C) PCA of the BIC phosphoproteome dataset. (Left) Percentage of variance explained by experimental factors in each principal component. Most of the variance is explained by the biological replicate, followed by the treatment time point. (Right) PCA plot shows grouping of replicates by time point in dimensions 2 and 3. (D) Heatmap showing the abundance (log2 TMT ratios) of proteins with a significant response to BIC treatment (F-test, adj. p<0.1). The gene symbols of the 27 regulated proteins are shown next to the heatmap.
Figure 2.
Figure 2.. Neuronal activity bidirectionally modulates the phosphorylation state of Shank3.
(A) The experiment protocol for extraction of Shank3 from rat cultured neocortical neurons for further quantitative mass spectrometry (MS) or Western blot analyses. (B) Volcano plot of quantitative MS data showing Shank3 residues that were differentially phosphorylated in tetrodotoxin (TTX)-treated samples compared to untreated controls. The log2 values of fold changes, if below zero, indicated hypophosphorylation (paired t-test: S1586, adjusted p=0.034142, S1614/5, 0.014444). (C) Top: diagram showing the location of S1586 and S1615 within the rat Shank3 protein. Functional domains: ANK = ankyrin repeat; SH3 = SRC homology 3; PDZ = PSD-95/Disc Large/ZO-1; Pro-rich = proline rich; SAM = sterile alpha motif. Bottom: homology comparison of sequences flanking rat S1586 and S1615 (matching mouse S1539) across species (human Shank3: NP_001358973.1; rat Shank3: NP_067708.2; mouse Shank3: UniprotKB: Q4ACU6.3). Phosphosites of interest are labeled in red; the only residue not conserved is shown in blue. (D, E) Representative Western blot using an antibody specific for phosphorylated S1615, showing changes in Shank3 phosphorylation after 10 min (D) or 24 hr (E) treatment with TTX or picrotoxin (PTX). (F) Quantification of the fold change of Shank3 S1615 phosphorylation in (D). Dashed line indicates the baseline untreated control (one-sample t-test: TTX, ***p=0.0005, PTX, **p=0.0035, n = 5 and 10 biological replicates, respectively). (G) Quantification of the fold change of Shank3 S1615 phosphorylation in (E) (one-sample t-test: TTX, ****p<0.0001, PTX, p = 0.6336, n = 7 and 7 biological replicates, respectively). Solid colored horizontal lines indicate the mean, and error bars represent SEM. Also see Figure 2—figure supplement 1, Figure 2—source data 1, and Figure 2—source data 2.
Figure 2—figure supplement 1.
Figure 2—figure supplement 1.. Validation of the pS1615 antibody.
(A) Western blot image showing the intensity of pS1615 in HA-tagged wild-type Shank3 or the S1586A/S1615A (AA) mutant. One set of replicates were treated with the phosphatase inhibitor, okadaic acid (OKA, 500 nM) for 30 min before lysis. Untr., untransfected control; n = 3 biological replicates. (B) Western blot image showing the intensity of pS1615 in HA-tagged wild-type Shank3 with and without the treatment of lambda phosphatase (n = 4 biological replicates). Also see Figure 2—figure supplement 1—source data 1.
Figure 3.
Figure 3.. Phosphorylation state modulates activity-dependent changes in the synaptic enrichment of Shank3.
(A) Representative images of synaptic puncta colocalized with surface GluA2 (sGluA2) and Shank3 in neuron dendrites ± tetrodotoxin (TTX) (scale bar = 5 µm). (B) Quantification of synaptic sGluA2 intensity changes induced by scaling up and down protocols (number of neurons: untreated, n = 77, TTX, n = 40, picrotoxin [PTX], n = 29; Kruskal–Wallis test with post-hoc Dunn’s multiple comparison tests: Un vs. TTX, **p=0.0034, Un vs. PTX, *p=0.0408, TTX vs. PTX, ****p<0.0001). (C) Quantification of synaptic Shank3 intensity during scaling up and down protocols (Kruskal–Wallis test with post-hoc Dunn’s tests: Un vs. TTX, *p=0.0155, Un vs. PTX, *p=0.0205, TTX vs. PTX, ****p<0.0001). (D) Representative images of synaptic localization of wild-type Shank3 and Shank3 phospho-mutants (scale bar = 5 µm). (E) Quantification of synaptic intensity of Shank3 phospho-mutants (number of neurons: WT, n = 33, AA, n = 30, DD, n = 24; Kruskal–Wallis test with post-hoc Dunn’s tests: WT vs. AA, p>0.9999, WT vs. DD, *p=0.0395, AA vs. DD, **p=0.0039). (F) Quantification of the density of synaptic puncta containing Shank3 phospho-mutants (number of neurons: WT, n = 32, AA, n = 30, DD, n = 24; Kruskal–Wallis test: p=0.2814). For imaging experiments here and below, each data point represents a single pyramidal neuron, and data were collected from at least four independent experiments. Also see Figure 3—source data 1.
Figure 4.
Figure 4.. Increased PP2A activity maintains tetrodotoxin (TTX)-induced Shank3 hypophosphorylation.
(A) Diagram showing the potential roles of kinases and phosphatases in regulating activity-dependent Shank3 phosphorylation. (B) Representative Western blot showing the impacts of inhibiting CAMKII (KN62, KN93) or PKA (H89) on Shank3 phosphorylation at baseline and upon TTX treatment. (C) Quantification of S1615 phosphorylation in (B) (two-way ANOVA with post-hoc Tukey’s test: DMSO vs. KN62, p>0.9999, DMSO vs. KN93, p=0.8148, DMSO vs. H89, p=0.9112, DMSO vs. picrotoxin (PTX), *p=0.0406, PTX vs. PTX/KN62, **p=0.0040, PTX vs. PTX/KN93, ****p<0.0001, PTX vs. PTX/H89, ****p<0.0001, n = 5 biological replicates). Dashed line indicates the DMSO control. (D) Quantification of PP2A activity after 1 hr TTX treatment (Un, n = 5, TTX, n = 5; paired t-test: **p=0.0018). (E) Quantification of PP2A activity after 24 hr TTX treatment (Un, n = 7, TTX, n = 7; paired t-test: *p=0.0129). (F, G) Western blot analyses showing changes in S1615 phosphorylation after 1 hr (F) or 24 hr (G) TTX treatment, with inhibition of PP2A by okadaic acid (OKA, 50 nM) during the last hour of treatment. (H) Quantification of S1615 phosphorylation in (F) (two-way ANOVA with post-hoc Tukey’s test: Un vs. OKA, 0.1723, Un vs. TTX, **p=0.0076, Un vs. TTX/OKA, *p=0.0311, TTX vs. TTX/OKA, p=0.8942, n = 5 biological replicates). Dashed line indicates the baseline untreated control. (I) Quantification of S1615 phosphorylation in (G) (two-way ANOVA test with post-hoc Tukey’s test: Un vs. OKA, = 0.9979, Un vs. TTX, p=0.0503, Un vs. TTX/OKA, p>0.9999, TTX vs. TTX/OKA, p=0.0531, n = 8 biological replicates). Also see Figure 4—figure supplement 1, Figure 4—source data 1, and Figure 4—source data 2.
Figure 4—figure supplement 1.
Figure 4—figure supplement 1.. PP1 regulates baseline phosphorylation of Shank3.
(A) Western blot analysis showing changes in S1615 phosphorylation after 24 hr tetrodotoxin (TTX) treatment, with PP1 inhibition by okadaic acid (OKA, 500 nM) during the last hour of the regimen. (B) Quantification of S1615 phosphorylation in (A). Also see Figure 4—figure supplement 1—source data 1 and 2.
Figure 5.
Figure 5.. PP2A activity is required for tetrodotoxin (TTX)-induced synaptic enrichment of Shank3.
(A) Representative images of synaptic enrichment of endogenous Shank3 upon treatment with TTX and PP2A inhibitor fostriecin (FST) (scale bar = 10 µm). (B) Quantification of synaptic Shank3 intensity in (A) (number of neurons: DMSO, n = 26, FST, n = 28, TTX, n = 28, TTX/FST, n = 29; Kruskal–Wallis test with post-hoc Dunn’s tests: DMSO vs. FST, p>0.9999, DMSO vs. TTX, ***p=0.0002, FST vs. TTX/FST, p=0.1259, TTX vs. TTX/FST, p=0.1292). (C) Quantification of density of synapses containing Shank3 in (A) (Kruskal–Wallis test with post-hoc Dunn’s tests: DMSO vs. FST, p=0.9458, DMSO vs. TTX, **p=0.0051, FST vs. TTX/FST, p=0.2446, TTX vs. TTX/FST, *p=0.0273). (D) Representative images of synaptic enrichment of endogenous Shank3 upon treatment with TTX and PP1 inhibitor tautomycetin (TAUT) (scale bar = 10 µm). (E) Quantification of synaptic Shank3 intensity in (D) (number of neurons: DMSO, n = 26, TAUT, n = 21, TTX, n = 28, TTX/TAUT, n = 32; Kruskal–Wallis test with post-hoc Dunn’s tests: DMSO vs. TAUT, *p=0.0315, DMSO vs. TTX, ***p=0.0006, TAUT vs. TTX/TAUT, ***p=0.0002, TTX vs. TTX/TAUT, *p=0.0392). (F) Quantification of density of synapses containing Shank3 in (D) (Kruskal–Wallis test with post-hoc Dunn’s tests: DMSO vs. TAUT, p=0.2450, DMSO vs. TTX, *p=0.0116, TAUT vs. TTX/TAUT, p=0.6552, TTX vs. TTX/TAUT, ***p=0.0007). Also see Figure 5—figure supplement 1 and Figure 5—source data 1.
Figure 5—figure supplement 1.
Figure 5—figure supplement 1.. Inhibition of PP2A by okadaic acid (OKA) reverses tetrodotoxin (TTX)-induced synaptic enrichment of Shank3.
(A) Representative images of synaptic enrichment of endogenous Shank3 upon treatment with TTX and PP2A inhibitor OKA (50 nM, scale bar = 10 µm). (B) Quantification of synaptic Shank3 intensity in (A) (DMSO, n = 31, OKA, n = 29, TTX, n = 30, TTX/OKA, n = 26; Kruskal–Wallis test with post-hoc Dunn’s tests: DMSO vs. OKA, p=0.3286, DMSO vs. TTX, ***p=0.0002, OKA vs. TTX/OKA, p>0.9999, TTX vs. TTX/OKA, **p=0.0036). (C) Quantification of density of synapses containing Shank3 in (A) (Kruskal–Wallis test with post-hoc Dunn’s tests: DMSO vs. OKA, ****p<0.0001, DMSO vs. TTX, p=0.5125, OKA vs. TTX/OKA, p>0.9999, TTX vs. TTX/OKA, ****p<0.0001). Also see Figure 5—figure supplement 1—source data 1.
Figure 6.
Figure 6.. Changes in the phosphorylation state of Shank3 are crucial for bidirectional synaptic scaling.
(A, B) Representative miniature excitatory postsynaptic current (mEPSC) recordings from neurons overexpressing Shank3 WT (A) or DD mutant (B) during scaling up. (C) Quantification of average mEPSC amplitude in (A) (WT, n = 8, WT + tetrodotoxin [TTX], n = 9; unpaired two-tailed t-test: **p=0.0074). (D) Quantification of average mEPSC amplitude in (B) (number of neurons: DD, n = 12, DD + TTX, n = 14; unpaired two-tailed t-test: p=0.5708). (E, F) Representative traces of mEPSCs recorded from neurons overexpressing Shank3 WT (E) or AA mutant (F) during scaling down. (G) Quantification of average mEPSC amplitude in (E) (number of neurons: WT, n = 8, WT + bicuculline [BIC], n = 8; Mann–Whitney test: *p=0.0148). (H) Quantification of average mEPSC amplitude in (F) (AA, n = 9, AA + BIC, n = 14; unpaired two-tailed t-test: p=0.8612). Also see Figure 6—figure supplement 1, Figure 6—figure supplement 2, and Figure 6—source data 1.
Figure 6—figure supplement 1.
Figure 6—figure supplement 1.. Shank3 is required for synaptic scaling down.
(A) Quantification of average miniature excitatory postsynaptic current (mEPSC) amplitudes recorded from neurons depleted of Shank3. Scaling down was induced by 24 hr treatment with picrotoxin (PTX) (CTNL, n = 19, PTX, n = 19, KD, n = 18, KD/PTX, n = 16; unpaired t-test: CTNL vs. PTX, *p=0.041; Mann–Whitney test: KD vs. KD/PTX, p=0.8515). (B) Cumulative histogram of mEPSC amplitudes (two-sample Kolmogorov–Smirnov test: CTNL vs. PTX, **p=0.0017, PTX vs. KD/PTX, p=0.0624, CTNL vs. KD/PTX, p=0.0945). Also see Figure 6—figure supplement 1—source data 1.
Figure 6—figure supplement 2.
Figure 6—figure supplement 2.. Scaling up and down remain intact in neurons overexpressing Shank3 AA and DD, respectively.
(A) Representative images of changes in synaptic sGluA2 intensity in neurons overexpressing Shank3 WT and AA during scaling up (scale bar = 10 µM). (B) Quantification of average synaptic sGluA2 intensity in (A) (WT, n = 28, WT/tetrodotoxin [TTX], n = 30, AA, n = 34, AA/TTX, n = 28; Mann–Whitney test: WT vs. WT/TTX, ***p=0.0009, AA vs. AA/TTX, **p=0.0013). (C) Representative images of changes in synaptic sGluA2 intensity in neurons overexpressing Shank3 WT and DD during scaling down (scale bar = 10 µM). (D) Quantification of average synaptic sGluA2 intensity in (C) (WT, n = 41, WT/bicuculline [BIC], n = 45, DD, n = 29, DD/BIC, n = 30; Mann–Whitney test: WT vs. WT/BIC, *p=0.023, DD vs. DD/BIC, *p=0.030). Also see Figure 6—figure supplement 2—source data 1.
Figure 7.
Figure 7.. Brief PP2A inactivation reverses scaling up.
(A) Representative images showing the effects of 1 hr fostriecin (FST) treatment on synaptic sGluA2 intensity in neurons expressing Shank3 WT or AA, after 24 hr of tetrodotoxin (TTX) to scale up synaptic strengths (scale bar = 10 µm). (B) Quantification of synaptic sGluA2 intensity in (A) (number of cells: WT/TTX, n = 22, WT/TTX/FST, n = 23, AA/TTX, n = 26, AA/TTX/FST, n = 25; Mann–Whitney test: WT/TTX vs. WT/TTX/FST, ***p=0.0007, AA/TTX vs. AA/TTX/FST, p=0.3739). (C) Quantification of synaptic Shank3 intensity in (A) (Mann–Whitney test: WT/TTX vs. WT/TTX/FST, **p=0.0090, AA/TTX vs. AA/TTX/FST, p=0.7296). (D) Quantification of the density of puncta containing sGluA2 and Shank3 (Mann–Whitney test: WT/TTX vs. WT/TTX/FST, **p=0.0016, AA/TTX vs. AA/TTX/FST, p=0.7017). Each data point indicates a cell, and the total number (n) was pooled from five independent experiments. Also see Figure 7—source data 1.
Author response image 1.
Author response image 1.. Overexpressing wild-type Shank3 does not impact synaptic surface GluA2 intensity at baseline, or the magnitude of scaling up.
Quantification of average synaptic sGluA3 intensity in neurons overexpressing Shank3-WT or a control GFP vector with and without TTX treatment (EV UN, n = 40, EV TTX, n = 45, WT UN, n = 33, WT TTX, n = 34). EV, empty vector; WT, Shank3-WT; UN, untreated.
Author response image 2.
Author response image 2.. Overexpressing Shank3 phospho-mutants does not change mEPSC frequency at baseline or during the scaling protocols.
Quantification of average mEPSC frequency in neurons pooled from the dataset in Figure 6 (WT, n = 16, WT + TTX, n = 9, WT + BIC, n = 8, DD, n = 7, DD + TTX, n = 11, AA, n = 9, AA + BIC, n = 14; Kruskal- Wallis test: p = 0.2483).

References

    1. Abel T, Nguyen PV. Regulation of hippocampus-dependent memory by cyclic AMP-dependent protein kinase. Progress in Brain Research. 2008;169:97–115. doi: 10.1016/S0079-6123(07)00006-4. - DOI - PMC - PubMed
    1. Baron MK, Boeckers TM, Vaida B, Faham S, Gingery M, Sawaya MR, Salyer D, Gundelfinger ED, Bowie JU. An architectural framework that may lie at the core of the postsynaptic density. Science (New York, N.Y.) 2006;311:531–535. doi: 10.1126/science.1118995. - DOI - PubMed
    1. Beausoleil SA, Villén J, Gerber SA, Rush J, Gygi SP. A probability-based approach for high-throughput protein phosphorylation analysis and site localization. Nature Biotechnology. 2006;24:1285–1292. doi: 10.1038/nbt1240. - DOI - PubMed
    1. Betancur C, Buxbaum JD. SHANK3 haploinsufficiency: A “common” but underdiagnosed highly penetrant monogenic cause of autism spectrum disorders. Molecular Autism. 2013;4:17. doi: 10.1186/2040-2392-4-17. - DOI - PMC - PubMed
    1. Bialojan C, Takai A. Inhibitory effect of a marine-sponge toxin, okadaic acid, on protein phosphatases Specificity and kinetics. The Biochemical Journal. 1988;256:283–290. doi: 10.1042/bj2560283. - DOI - PMC - PubMed

Publication types