. 2022 Jun 8;7(11):e158895.
doi: 10.1172/jci.insight.158895.

Decoding the PITX2-controlled genetic network in atrial fibrillation

Affiliations

Decoding the PITX2-controlled genetic network in atrial fibrillation

Jeffrey D Steimle et al. JCI Insight. .

Abstract

Atrial fibrillation (AF), the most common sustained cardiac arrhythmia and a major risk factor for stroke, often arises through ectopic electrical impulses derived from the pulmonary veins (PVs). Sequence variants in enhancers controlling expression of the transcription factor PITX2, which is expressed in the cardiomyocytes (CMs) of the PV and left atrium (LA), have been implicated in AF predisposition. Single nuclei multiomic profiling of RNA and analysis of chromatin accessibility combined with spectral clustering uncovered distinct PV- and LA-enriched CM cell states. Pitx2-mutant PV and LA CMs exhibited gene expression changes consistent with cardiac dysfunction through cell type-distinct, PITX2-directed, cis-regulatory grammars controlling target gene expression. The perturbed network targets in each CM were enriched in distinct human AF predisposition genes, suggesting combinatorial risk for AF genesis. Our data further reveal that PV and LA Pitx2-mutant CMs signal to endothelial and endocardial cells through BMP10 signaling with pathogenic potential. This work provides a multiomic framework for interrogating the basis of AF predisposition in the PVs of humans.

Keywords: Arrhythmias; Cardiology; Epigenetics; Transcription.


Conflict of interest statement

Conflict of interest: JFM is a cofounder of and owns shares in Yap Therapeutics.

Figures

Figure 1
Figure 1. Single nuclei profiling of the pulmonary vein and left atrium.
(A) Experimental outline used to profile the transcriptome and chromatin accessibility of single nuclei of the left atrium (LA) and pulmonary vein (PV) from pools of 6- to 8-month-old Pitx2 control (Ctrl: Pitx2fl/+) and mutant (Mut: MCK-cre Pitx2fl/–) mice. (B) Uniform manifold approximation and projection (UMAP) representation of all filtered nuclei identified by single nuclei RNA-sequencing (snRNA-Seq) and color-coded and labeled in clusters. (C) UMAP representation of single nuclei assay for transposase-accessible chromatin using sequencing (snATAC-Seq) with colors and labels lifted from the snRNA-Seq (in B). (D) Percentage of total nuclei per sample from the 4 major clusters identified in the snRNA-Seq data set. (E) Percentage of total nuclei per sample identified in the snATAC-Seq data set. Adjusted P value (FDR) of significant comparisons (FDR < 1 × 10⁻⁵) between LA or PV control and mutant samples are presented.
Figure 2
Figure 2. Identification of PV-enriched cardiomyocyte populations.
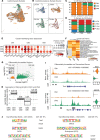
(A) Uniform manifold approximation and projection (UMAP) representation of the cardiomyocyte (CM) subsets alone. (B) UMAP of CM subsets separated and colored by sample source. (C) The percentage of each CM subset in each sample. (D) The percentage CM subset from a given sample source. (E) Top CM subset markers identified by multiple pairwise comparison. Full list of markers is in Supplemental Table 2. (F) Heatmap of top 20 parent Gene Ontology (GO) terms identified across the 3 CM subsets. Complete details and child terms can be found in Supplemental Table 3. (G) Volcano plot showing the distribution of differentially accessible regions (DARs) between CM1 and CM2 (Supplemental Table 4). (H) Odds ratio plot by Fisher’s exact test for the association between differentially expressed genes (DEGs) and DARs enriched in CM1 or CM2. Significance values represent the adjusted P value (FDR). (I) Genome browser views at Tbx5 (top) and Myh7b (bottom). Pseudo-bulk ATAC signal plotted for CM1 and CM2 with DARs highlighted. On the right, violin plots representing normalized RNA expression. (J) Top 3 differential motifs identified for CM1 DARs and CM2 DARs alongside the list of any differentially expressed transcription factors (DE TFs) corresponding to each identified motif family.
Figure 3
Figure 3. Systems biology approach to PITX2-dependent regulatory networks.
(A) Quantification of differentially expressed genes (DEGs) identified by subset comparing controls and Pitx2 mutants. Complete list including PV CM3 is in Supplemental Table 5. (B) Number of DEGs associated with a cis-regulatory element (CRE) with a PITX2 normalized motif score (NMS) > 1 for each subset. (C) The mean percentage of colocalized motifs by transcription factor (TF) family. Colocalization was defined as the occurrence of at least 1 motif at a PITX2-containing CRE (NMS > 1) associated with a DEG in the given comparison. Only expressed TFs in each cell type were considered. Complete breakdown for each expressed TF by comparison is located in Supplemental Figure 6. (D) Identification of differentially correlating TF family networks at PV CM1 by Pearson’s correlation coefficient. Detailed correlation heatmaps for PV CM1 along with LA CM1 and PV CM2 are located in Supplemental Figure 8.
Figure 4
Figure 4. Human AF GWAS enrichment in perturbed PITX2 networks.
(A) Enrichment scores of normalized and binned gene expression by cell subset for AF GWAS–associated genes. (B) Example AF-SNP loci (arrows) with coding genes within the 1 Mb window demonstrating top 20th percentile enrichment in CM1 (orange), CM2 (green), CM3 (red), or adipocytes (blue. (C) Venn diagram comparing the overlapping AF SNPs associated with at least 1 highly cell type–enriched gene (20th percentile). A total of 22 SNPs were not associated with any of the 4 cell types by our method. (D) Venn diagram comparing the 20th percentile cell type–enriched genes underlying the SNPs in C. (E) Enrichment scores by Fisher’s exact test for the overlap of previously identified Pitx2-dependent genes in CMs and adipocytes with the SNP-associated, cell type–enriched genes identified in D. Adjusted P value (FDR) for each enrichment test shown.
Figure 5
Figure 5. Aberrant cross-signaling between CMs and endothelium/endocardium in Pitx2 mutant LA and PV.
(A) Top 4 differentially expressed (control vs. Pitx2 mutant) networks identified for CMs. (B) Ligand-receptor expression in CMs, endocardium (EndoC), and endothelium (Endo). Boxed pairs demonstrate significant differential expression between controls (Ctrl) and Pitx2 mutants (Mut). (C) Predicted upstream regulators identified by Ingenuity Pathway Analysis (IPA) for differentially expressed genes (DEGs) comparing controls and Pitx2 mutants for Endo (left) and EndoC (right). A positive z score predicts addition or activation while negative z score predicts subtraction or inhibition of a pathway or ligand. A complete list of DEGs can be found in Supplemental Table 8. (D) Top 20 GO terms for up- and downregulated DEGs for Endo and EndoC. Complete details and child terms can be found in Supplemental Table 9.
Figure 6
Figure 6. Summary of PITX2’s role in the LA and PV.
(A) The single nuclei RNA-sequencing (snRNA-Seq) data identified 3 populations of cardiomyocytes (CMs) with 2 populations resident to the PV. The identified PV CMs make up a subset of all CMs of the PV but likely contribute to tissue-specific processes not found in the LA. (B) The PITX2-associated cis-regulatory grammar suggests that PITX2 interacts with a particular set of cofactors to repress gene expression in PV CM1 but interacts with those same factors in LA CM1 and PV CM2 to both activate and repress transcription. (C) Example loci depicting the relationship of Pitx2-dependent, AF-SNP–associated, cell type–enriched genes with the tagging SNP (left). Our proposed model that decreased PITX2, e.g., mouse mutants or human loss-of-function SNPs at AF-associated region (AFAR), is a potent modifier of AF risk because downstream targets of PITX2 cis-regulatory networks in each cell type are enriched in other AF risk-modifying genes (right). (D) LA and PV CM1 cells demonstrate substantial upregulation of Bmp10, which signals to the endocardium/endothelium (EndoC/Endo) of the LA/PV. EndoC/Endo of Pitx2 mutants demonstrate differentially expressed genes (DEGs) associated with cell adhesion and platelet activation. Furthermore, the LA Endo appears to reciprocally signal to the CM1 through increased NRG1 signaling.

References

    1. Staerk L, et al. Lifetime risk of atrial fibrillation according to optimal, borderline, or elevated levels of risk factors: cohort study based on longitudinal data from the Framingham Heart Study. BMJ. 2018;361:k1453. - PMC - PubMed
    1. Andrade J, et al. The clinical profile and pathophysiology of atrial fibrillation: relationships among clinical features, epidemiology, and mechanisms. Circ Res. 2014;114(9):1453–1468. doi: 10.1161/CIRCRESAHA.114.303211. - DOI - PubMed
    1. Diener H-C, et al. Atrial fibrillation and cognitive function: JACC review topic of the week. J Am Coll Cardiol. 2019;73(5):612–619. doi: 10.1016/j.jacc.2018.10.077. - DOI - PubMed
    1. Haïssaguerre M, et al. Spontaneous initiation of atrial fibrillation by ectopic beats originating in the pulmonary veins. N Engl J Med. 1998;339(10):659–666. doi: 10.1056/NEJM199809033391003. - DOI - PubMed
    1. Boutilier JK, et al. Gene expression networks in the murine pulmonary myocardium provide insight into the pathobiology of atrial fibrillation. G3 (Bethesda) 2017;7(9):2999–3017. doi: 10.1534/g3.117.044651. - DOI - PMC - PubMed

Publication types

MeSH terms