. 2022 Jun 8;7(11):e159093.
doi: 10.1172/jci.insight.159093.

Single-cell RNA-Seq of human esophageal epithelium in homeostasis and allergic inflammation

Affiliations

Single-cell RNA-Seq of human esophageal epithelium in homeostasis and allergic inflammation

Mark Rochman et al. JCI Insight. .

Abstract

Inflammation of the esophageal epithelium is a hallmark of eosinophilic esophagitis (EoE), an emerging chronic allergic disease. Herein, we probed human esophageal epithelial cells at single-cell resolution during homeostasis and EoE. During allergic inflammation, the epithelial differentiation program was blocked, leading to loss of KRT6hi differentiated populations and expansion of TOP2hi proliferating, DSPhi transitioning, and SERPINB3hi transitioning populations; however, there was stability of the stem cell-enriched PDPNhi basal epithelial compartment. This differentiation program blockade was associated with dysregulation of transcription factors, including nuclear receptor signalers, in the most differentiated epithelial cells and altered NOTCH-related cell-to-cell communication. Each epithelial population expressed genes with allergic disease risk variants, supporting their functional interplay. The esophageal epithelium differed notably between EoE in histologic remission and controls, indicating that remission is a transitory state poised to relapse. Collectively, our data uncover the dynamic nature of the inflamed human esophageal epithelium and provide a framework to better understand esophageal health and disease.

Keywords: Cellular immune response; Immunology; Inflammation; Molecular pathology.


Conflict of interest statement

Conflict of interest: MER is a consultant for Pulm One, Spoon Guru, ClostraBio, Serpin Pharm, Allakos, Celldex Therapeutics, Celgene, Astra Zeneca, Arena Pharmaceuticals, Ellodi Pharma, GlaxoSmithKline, Regeneron/Sanofi, Revolo Biotherapeutics, and Guidepoint and has an equity interest in the first 5 listed and royalties from reslizumab (Teva Pharmaceuticals), PEESSv2 (Mapi Research Trust), and UpToDate. MER is an inventor of patents owned by CCHMC.

Figures

Figure 1
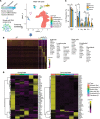
Figure 1. Single-cell analysis of human esophageal biopsies delineating major esophageal cell types.
(A) Schematic representation of the experimental design and the uniform manifold approximation and projection (UMAP) of all samples depicting major cell types from the esophageal biopsies. n = 2, healthy controls (normal); n = 3, EoE in remission (remission); n = 5, active EoE inflammation (active). (B) Marker gene expression heatmap of major cell types and top 10 representative genes per cell type. Each column represents a single cell, and each row represents an individual gene. (C) Quantification of the cell types and comparison of their proportion by disease status. *P = 0.06; **P < 0.05; 2-tailed Student’s t test. Data are shown as mean ± SD. (D) Heatmap of average expression of all 10 samples for top 50 upregulated and downregulated genes from the bulk RNA-Seq EoE transcriptome (6) stratified by the cell type.
Figure 2
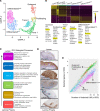
Figure 2. scRNA-Seq analysis of homeostatic (normal) esophageal epithelium.
(A) UMAP projection depicting 6 esophageal epithelial subpopulations. (B) Marker gene expression heatmap and top 10 representative genes of epithelial subpopulations. Each column represents a single cell, and each row represents an individual gene. Genes highlighted in yellow are accompanied by IHC images in D. (C) The spatial organization of the epithelial subpopulations in the esophageal epithelium. Arrow indicates the direction of the putative differentiation program from the basal cells adjacent to the lamina propria toward the lumen. Most significant biological process GO terms are shown for each subpopulation. (D) IHC images of the representative markers (yellow highlighting in B) are screenshots from the Human Protein Atlas (HPA) for each subpopulation. See the HPA for magnification of original images (4). (E) Scatter plot of UMI counts versus number of detected genes per cell showing relatively smaller number of expressed genes in the differentiated subpopulations. Color coding is the same as in A.
Figure 3
Figure 3. Functional and molecular properties of the human esophageal basal layer cells in homeostasis.
(A) Schematic representation of the experimental design to purify and characterize basal layer cells (upper left). Podoplanin (PDPN) staining depicting basal layer localization from the Human Protein Atlas (HPA) (lower left). A representative FACS plot shows the gating strategy to purify PDPNhi for basal cells and PDPNlo for suprabasal cells (right). (B) IHC images are screenshots from HPA of the representative markers for basal and suprabasal cells identified by differential analysis of bulk RNA-Seq data comparing PDPNhi and PDPNlo cells; see the HPA for magnification of original images (4). (C) Average expression of top 20 PDPNhi and PDPNlo marker genes projected onto UMAP of quiescent and proliferating cells from healthy controls distinguishing basal and suprabasal cells; the dotted line separates quiescent and proliferating cells. (D) Cell cycle status of cells inferred by Seurat projected onto UMAP of quiescent and proliferating cells. (E) Ex vivo colony-forming assay for sorted basal and suprabasal cells. Each line represents cells from a biopsy obtained from a distinct individual. A total number of colonies per 2000 seeded cells are plotted. Representative images of the high-power microscopic field show colony growth of basal PDPNhi cells (arrows; upper image, ×10 magnification). Cells in the PDPNlo image are mitotically inactivated murine fibroblasts that served as feeder layer cells for colony growth. (F) Immunofluorescence images of the colonies grown from the PDPNhi cells. Scale bar: 50 μM.
Figure 4
Figure 4. Human esophageal epithelial responses in allergic inflammation.
(A) Slingshot pseudotime of esophageal epithelium differentiation projected onto UMAP in color scale for healthy controls (Normal), EoE remission (Remiss), and active EoE (Active). Insets show the epithelial subpopulations identified by unbiased clustering. (B) Swarm and density plots showing cell densities along the pseudotime. (C and D) Statistical comparison of the epithelial subpopulation composition among the disease states. *P < 0.05; **P < 0.01; ***P < 0.001 by 2-tailed Student’s t test. Data are shown as mean ± SD. (E) Hierarchical clustering of all 10 samples comparing the epithelial subpopulation composition by disease status using Pearson correlation coefficient as a similarity measure (healthy controls [Normal], EoE remission [Remiss], and active EoE [Active]). Each column represents an individual sample.
Figure 5
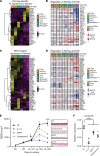
Figure 5. Pseudo-bulk RNA-Seq analysis to compare gene expression dysregulation and epithelial cell fate of human esophageal epithelial subpopulations by disease status.
(A) Principal component analysis (PCA) of the pseudo-bulk RNA-Seq samples derived from scRNA-Seq by summing UMI counts per gene per epithelial subpopulation per biopsy. The arrow shows developmental trajectory; the vertical line represents developmental blockage in active EoE. (B) Hierarchical clustering heatmap of keratin gene expression in the healthy control epithelium (Normal). (C) Log2 fold change (log2FC) of keratin gene expression in active EoE (Active) and EoE remission (Remiss) samples compared with normal by the differential expression analysis of the pseudo-bulk RNA-Seq (#FDR-adjusted P < 0.05). Genes are ordered the same as in B. Note that the Differentiatedhi and Differentiatedlo cell subpopulations are represented by one unified cell population. (D) Scatter plots show differentially expressed genes in epithelial subpopulations of active EoE (EoE) compared with healthy controls (NL) (FC > 1.5 and FDR-adjusted P < 0.05). (E) Hierarchical clustering heatmap of differentially expressed genes between Differentiated and Quiescent epithelial subpopulations in the normal and diseased esophagus. Two groups of genes are observed that are either induced or repressed upon normal differentiation. In each group, induced or repressed, 3 types of patterns are observed: Type 1, severely dysregulated; Type 2, moderately dysregulated; and Type 3, normally expressed (induced or repressed). Asterisks denote genes that remain dysregulated in EoE remission. Top significantly enriched biological process GO terms are presented for the differentiation-induced genes.
Figure 6
Figure 6. Expression of transcription factors and NOTCH-related genes in human esophageal epithelial cells.
(A) Gene expression heatmap of subpopulation-specific transcription factors (TF) in the healthy control esophagus (Normal). (B) Log2FC of the subpopulation-specific TFs in the active EoE (Active) and remission EoE (Remiss) esophagus compared with the normal esophagus by pseudo-bulk RNA-Seq differential analysis (#FDR-adjusted P < 0.05). Genes are ordered the same as in B. (C) Gene expression heatmap of the NOTCH signaling pathway genes (KEGG) in the normal epithelial subpopulations. (D) Log2FC of the NOTCH gene expression in the active EoE (Active) and remission EoE (Remiss) esophagus compared with the normal esophagus by pseudo-bulk RNA-Seq differential analysis (#FDR-adjusted P < 0.05). Genes are ordered the same as in C. For B and D, Differentiatedhi and Differentiatedlo cell subpopulations are represented by 1 unified cell population. (E) Transepithelial electrical resistance (TEER) was measured in the EPC2 cells grown at the air-liquid interface (ALI) and treated as indicated. Data are from 3–5 independent experiments performed in triplicate. Data are shown as mean ± SEM. ****P < 0.0001 for ALI day 5 (D5) compared with untreated (UT), by 1-way ANOVA. Insets show representative H&E staining of the ALI cultures (×10 magnification). (F) Relative expression of involucrin in the EPC2 cells grown at the ALI for 5 days (ALI D5). Expression was normalized to GAPDH. Combined data for 3 independent cultures performed in duplicates is shown; data are shown as mean ± SEM. ****P < 0.0001 compared with UT, by 1-way ANOVA.
Figure 7
Figure 7. Expression of the epithelial genes genetically linked to EoE and food allergy.
(A) Gene expression heatmap of 34 genes genetically linked to EoE and food allergy by genome-wide association (GWAS), Mendelian association, or candidate gene approaches delineated by the epithelial subpopulations in the healthy control esophagus (Normal). (B) Log2FC of the genetically linked genes in the active EoE (Active) and EoE remission (Remiss) esophagus compared with healthy control obtained by pseudo-bulk RNA-Seq differential analysis (#FDR-adjusted P < 0.05). Genes are ordered the same as in A. Note that the Differentiatedhi and Differentiatedlo cell subpopulations are represented by 1 unified cell population.

References

    1. Busslinger GA, et al. Human gastrointestinal epithelia of the esophagus, stomach, and duodenum resolved at single-cell resolution. Cell Rep. 2021;34(10):108819. doi: 10.1016/j.celrep.2021.108819. - DOI - PubMed
    1. Madissoon E, et al. scRNA-Seq assessment of the human lung, spleen, and esophagus tissue stability after cold preservation. Genome Biol. 2019;21(1):1. - PMC - PubMed
    1. Dunaway S, et al. Divide and conquer: two stem cell populations in squamous epithelia, reserves and the active duty forces. Int J Oral Sci. 2019;11(3):26. doi: 10.1038/s41368-019-0061-2. - DOI - PMC - PubMed
    1. Uhlen M, et al. Proteomics. Tissue-based map of the human proteome. Science. 2015;347(6220):1260419. doi: 10.1126/science.1260419. - DOI - PubMed
    1. Blanchard C, et al. Eotaxin-3 and a uniquely conserved gene-expression profile in eosinophilic esophagitis. J Clin Invest. 2006;116(2):536–547. doi: 10.1172/JCI26679. - DOI - PMC - PubMed

Publication types