. 2022 Jul 14;140(2):121-139.
doi: 10.1182/blood.2021014914.

Procoagulant platelet sentinels prevent inflammatory bleeding through GPIIBIIIA and GPVI

Affiliations

Procoagulant platelet sentinels prevent inflammatory bleeding through GPIIBIIIA and GPVI

Rainer Kaiser et al. Blood. .

Abstract

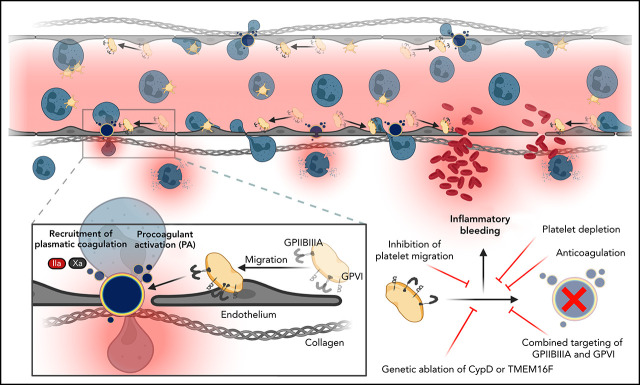
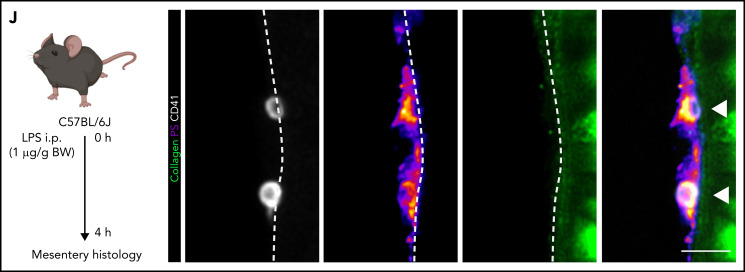
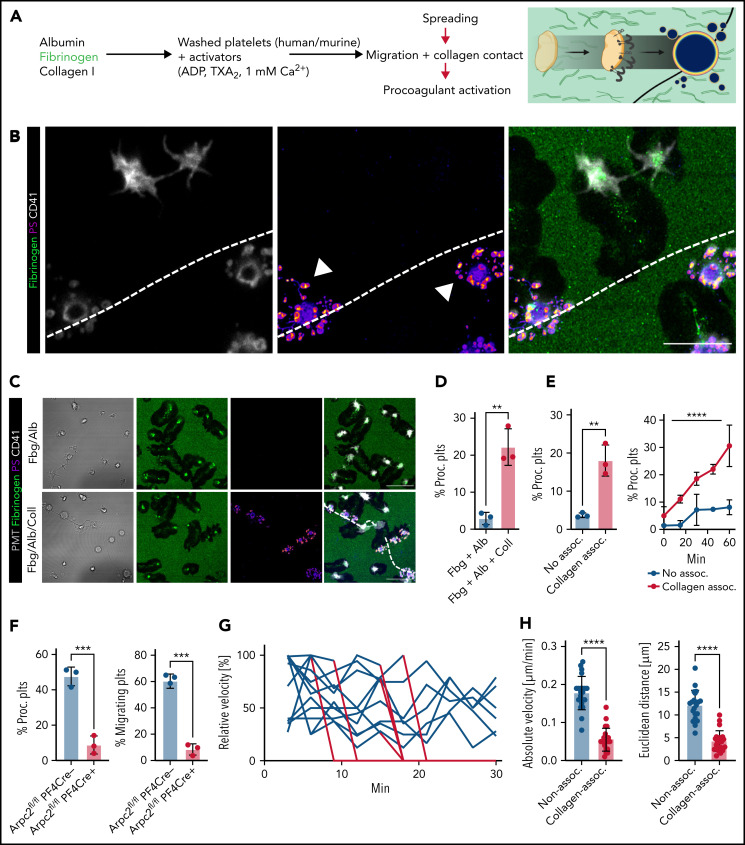
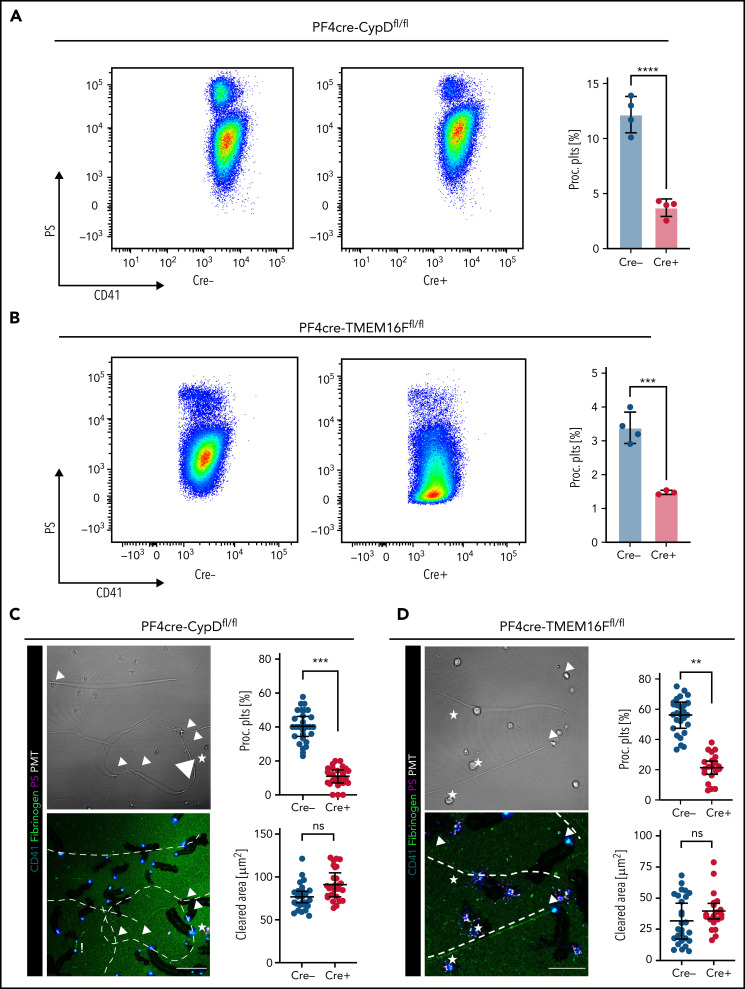
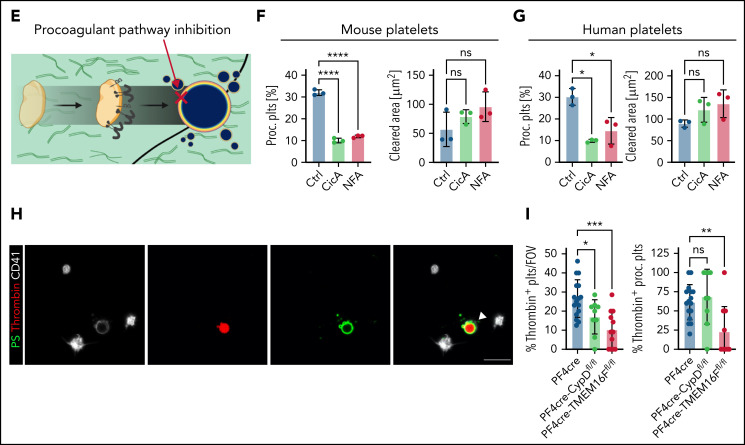
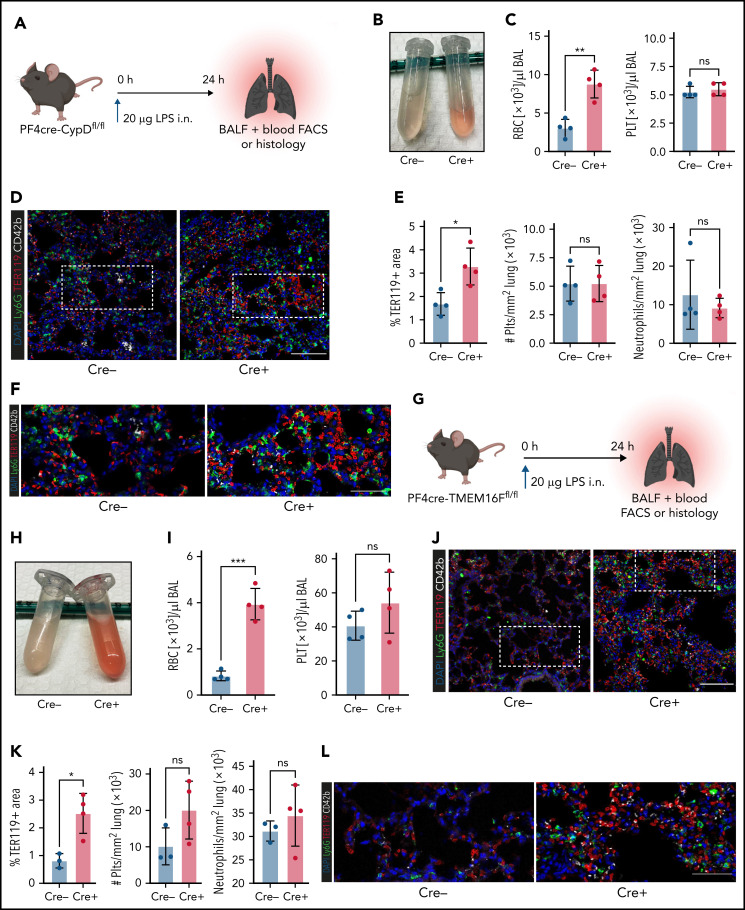
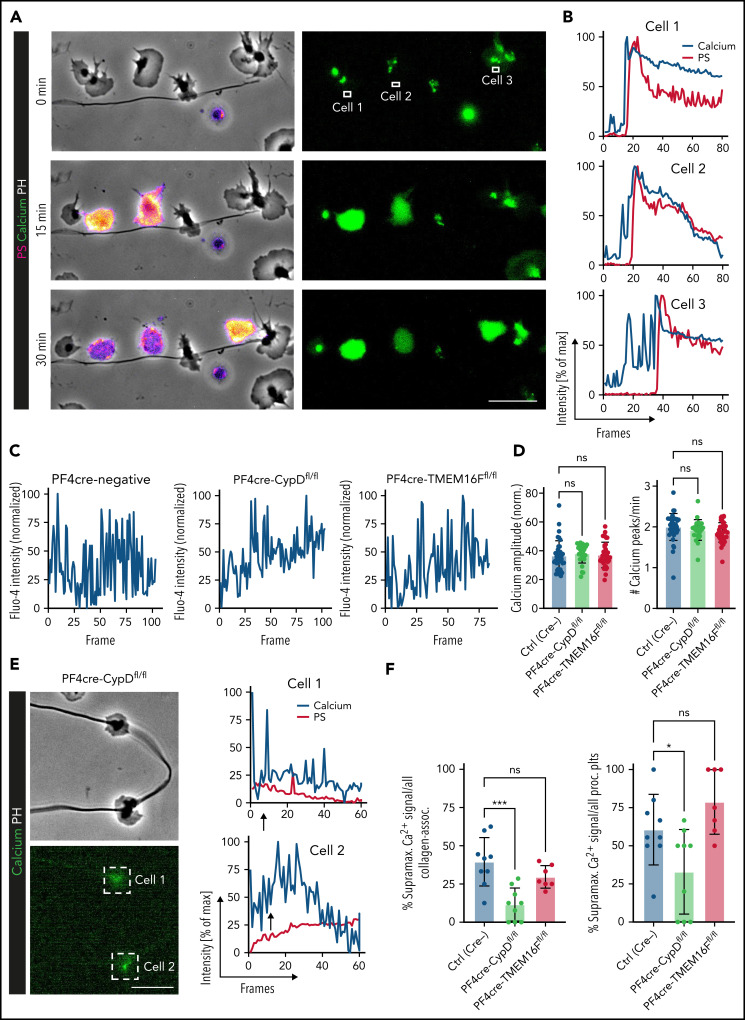
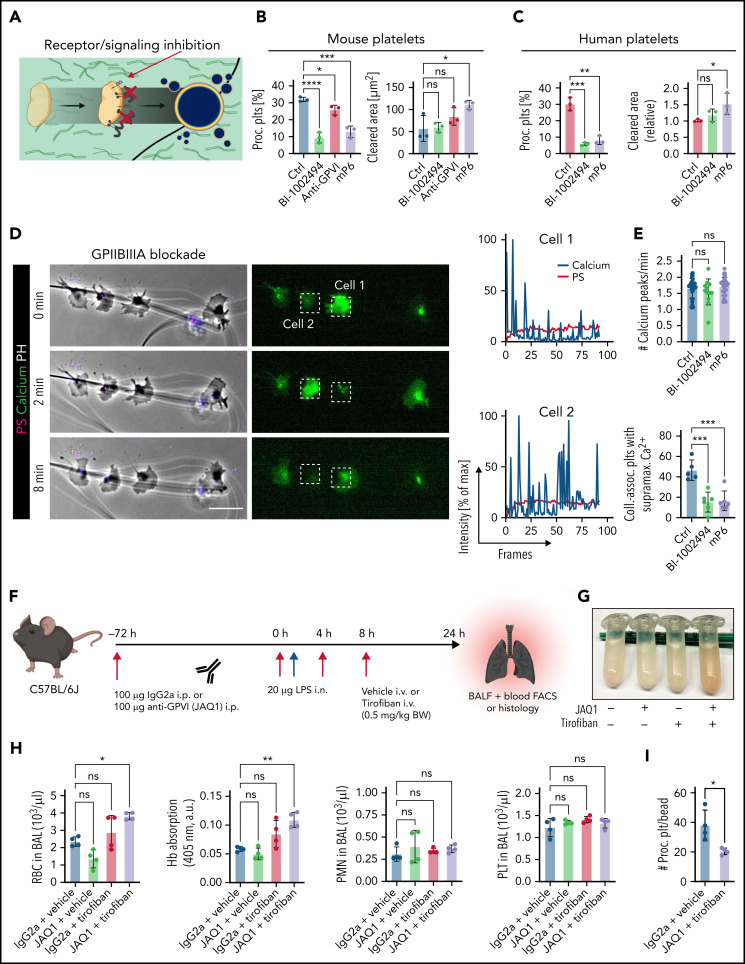
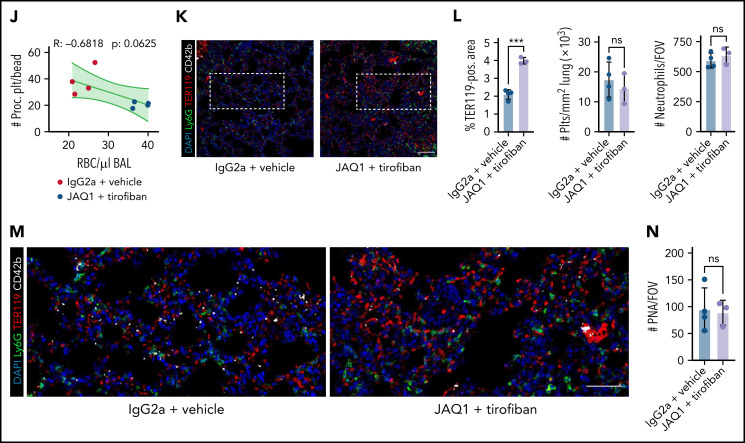
Impairment of vascular integrity is a hallmark of inflammatory diseases. We recently reported that single immune-responsive platelets migrate and reposition themselves to sites of vascular injury to prevent bleeding. However, it remains unclear how single platelets preserve vascular integrity once encountering endothelial breaches. Here we demonstrate by intravital microscopy combined with genetic mouse models that procoagulant activation (PA) of single platelets and subsequent recruitment of the coagulation cascade are crucial for the prevention of inflammatory bleeding. Using a novel lactadherin-based compound, we detect phosphatidylserine (PS)-positive procoagulant platelets in the inflamed vasculature. We identify exposed collagen as the central trigger arresting platelets and initiating subsequent PA in a CypD- and TMEM16F-dependent manner both in vivo and in vitro. Platelet PA promotes binding of the prothrombinase complex to the platelet membrane, greatly enhancing thrombin activity and resulting in fibrin formation. PA of migrating platelets is initiated by costimulation via integrin αIIbβ3 (GPIIBIIIA)/Gα13-mediated outside-in signaling and glycoprotein VI signaling, leading to an above-threshold intracellular calcium release. This effectively targets the coagulation cascade to breaches of vascular integrity identified by patrolling platelets. Platelet-specific genetic loss of either CypD or TMEM16F as well as combined blockade of platelet GPIIBIIIA and glycoprotein VI reduce platelet PA in vivo and aggravate pulmonary inflammatory hemorrhage. Our findings illustrate a novel role of procoagulant platelets in the prevention of inflammatory bleeding and provide evidence that PA of patrolling platelet sentinels effectively targets and confines activation of coagulation to breaches of vascular integrity.


Figures

None
Graphical abstract
Figure 1.
Figure 1.
Both thrombocytopenia and anticoagulation aggravate inflammatory bleeding. (A) Experimental scheme of subacute lung injury model with or without antibody-mediated platelet depletion. The red arrow indicates antibody administration; the blue arrow indicates intranasal LPS administration. (B) Representative macroscopic images of lungs from control (C301) and thrombocytopenic animals (R300 treatment) 24 hours after LPS challenge. (C) Flow cytometric analysis of peripheral blood (platelet and RBC count) and BALF (RBC and leukocyte count/µL BALF). Student’s t test, two-tailed, unpaired. (D) Representative micrographs of immunofluorescence stainings of alveolar hemorrhage in control (C301) and thrombocytopenic animals (R300). Bar represents 100 µm. (E) Magnified excerpts of representative micrographs, corresponding to white rectangles in Figure 1D. Bar represents 50 µm. (F) Representative images of immunofluorescence stainings of lungs from control (Ctrl) or septic animals (E. coli–derived LPS 1 mg/kg BW intraperitoneally). Bar represents 100 µm (left and mid panel) and 20 µm (right panel). White arrowheads indicate fibrin(ogen)-positive platelets. Red: anti-PS antibody (Merck). (G) Quantification of fibrinogen deposition and overlap of fibrinogen/platelet positive areas. n = 3 to 4 mice per group. Student’s t test, two-tailed, unpaired. (H) Quantification of fibrinogen deposition in lungs from septic control (C301) and platelet-depleted animals (R300) per field of view (FOV). n = 4 mice per group. Student’s t test, two-tailed, unpaired. (I) Representative micrographs of control (C301) and platelet-depleted mice (R300), referring to (H). Bar represents 200 µm (left and right panels). Magnified excerpt (middle; bar represents 20 µm) corresponds to the white rectangle of the left panel. Red: anti-PS antibody (Merck). (J) Experimental scheme of (sub)acute lung injury. Bl6 mice were treated with 20 µg of LPS intranasally (blue arrow) and intravenously injected with vehicle or rivaroxaban (3 mg/kg BW) right before and 8 hours after challenge or argatroban (5 mg/kg BW) right before and 4 and 8 hours after challenge; rivaroxaban-treated animals received vehicle injections at 4 hours after challenge (red arrows indicate timing of intravenous injections). (K) Representative macroscopic image of BALF derived from 1 simultaneously performed set of experimental groups, collected in 2 mL Eppendorf tubes. The right tube corresponds to the maximum bleeding observed in argatroban-treated animals. (L) Flow-cytometric assessment of BALF (RBC, polymorphonuclear, and PLT counts/µL BALF). One-way analysis of variance (ANOVA) with Holm-Šídák's multiple comparisons test compared with control groups. (M) Representative images of immunofluorescence stainings of lung slices from different experimental groups. Bar represents 100 µm. (N) Quantification of alveolar hemorrhage (TER119+ area) and neutrophil recruitment. n = 3 to 4 mice/group. One-way ANOVA with Holm-Šídák's multiple comparisons test compared with control groups. (O) Magnified excerpts of representative micrographs, corresponding to white rectangles in Figure 1M. Bar represents 50 µm.
Figure 1.
Figure 1.
Both thrombocytopenia and anticoagulation aggravate inflammatory bleeding. (A) Experimental scheme of subacute lung injury model with or without antibody-mediated platelet depletion. The red arrow indicates antibody administration; the blue arrow indicates intranasal LPS administration. (B) Representative macroscopic images of lungs from control (C301) and thrombocytopenic animals (R300 treatment) 24 hours after LPS challenge. (C) Flow cytometric analysis of peripheral blood (platelet and RBC count) and BALF (RBC and leukocyte count/µL BALF). Student’s t test, two-tailed, unpaired. (D) Representative micrographs of immunofluorescence stainings of alveolar hemorrhage in control (C301) and thrombocytopenic animals (R300). Bar represents 100 µm. (E) Magnified excerpts of representative micrographs, corresponding to white rectangles in Figure 1D. Bar represents 50 µm. (F) Representative images of immunofluorescence stainings of lungs from control (Ctrl) or septic animals (E. coli–derived LPS 1 mg/kg BW intraperitoneally). Bar represents 100 µm (left and mid panel) and 20 µm (right panel). White arrowheads indicate fibrin(ogen)-positive platelets. Red: anti-PS antibody (Merck). (G) Quantification of fibrinogen deposition and overlap of fibrinogen/platelet positive areas. n = 3 to 4 mice per group. Student’s t test, two-tailed, unpaired. (H) Quantification of fibrinogen deposition in lungs from septic control (C301) and platelet-depleted animals (R300) per field of view (FOV). n = 4 mice per group. Student’s t test, two-tailed, unpaired. (I) Representative micrographs of control (C301) and platelet-depleted mice (R300), referring to (H). Bar represents 200 µm (left and right panels). Magnified excerpt (middle; bar represents 20 µm) corresponds to the white rectangle of the left panel. Red: anti-PS antibody (Merck). (J) Experimental scheme of (sub)acute lung injury. Bl6 mice were treated with 20 µg of LPS intranasally (blue arrow) and intravenously injected with vehicle or rivaroxaban (3 mg/kg BW) right before and 8 hours after challenge or argatroban (5 mg/kg BW) right before and 4 and 8 hours after challenge; rivaroxaban-treated animals received vehicle injections at 4 hours after challenge (red arrows indicate timing of intravenous injections). (K) Representative macroscopic image of BALF derived from 1 simultaneously performed set of experimental groups, collected in 2 mL Eppendorf tubes. The right tube corresponds to the maximum bleeding observed in argatroban-treated animals. (L) Flow-cytometric assessment of BALF (RBC, polymorphonuclear, and PLT counts/µL BALF). One-way analysis of variance (ANOVA) with Holm-Šídák's multiple comparisons test compared with control groups. (M) Representative images of immunofluorescence stainings of lung slices from different experimental groups. Bar represents 100 µm. (N) Quantification of alveolar hemorrhage (TER119+ area) and neutrophil recruitment. n = 3 to 4 mice/group. One-way ANOVA with Holm-Šídák's multiple comparisons test compared with control groups. (O) Magnified excerpts of representative micrographs, corresponding to white rectangles in Figure 1M. Bar represents 50 µm.
Figure 2.
Figure 2.
Procoagulant platelets are induced by inflammation in vivo. (A) Experimental scheme of peritoneal sepsis and mesenteric live imaging. (B) Representative images derived from 4-dimensional (4D) live microscopy of mesentery venules. Dotted lines indicate vessel walls. Bar represents 5 µm. PS staining agent: mC1. (C) Quantification of procoagulant platelets in mesenteric venules of sham- or LPS-treated Bl6 mice. Student’s t test, two-tailed, unpaired. (D) Analysis of motility patterns and quantification of procoagulant platelet content in different motility subgroups in sham- or LPS-treated animals. Student’s t test, two-tailed, unpaired. (E) Example image derived from 4D live microscopy of mesentery venules. Yellow signal indicates overlap between phosphatidylserine (PS, mC1) and fibrinogen. Dotted lines indicate vessel walls. Bar represents 10 µm. (F) Quantification of fibrinogen-binding behavior of non-procoagulant (PS-, blue) and procoagulant platelets (PS+, red) from live imaging data (n = 4 LPS-treated mice; n = 2-3 videos per mouse). Data are shown as % of all platelets of the respective subset. One-way ANOVA. (G-H) Example image derived from 4D live microscopy of mesentery venules revealing PS+, fibrinogen-binding adherent platelets. Dotted lines indicate vessel walls. The red line corresponds to the plot profiles for expression of fibrinogen, PS and CD42b (X488) as shown in (H). PS staining agent: mC1. Bar represents 20 µm. (I) Absolute quantification of the area of Fbg, Fbg/CD42b, and Fbg/CD42b/PS overlap in sham- or LPS-injected mice (n = 3-4 mice per condition; n = 2-3 videos per mouse). Student’s t test, two-tailed, unpaired. (J) Experimental scheme and representative immunofluorescence images of mesenteric venules after 4 hours of LPS intraperitoneal injection. White arrowheads indicate procoagulant platelets (CD41/GPIIBIIIA-positive, PS-positive) in close proximity to antibody-stained collagen fibers (green). Bar represents 5 µm. PS staining agent: anti-PS antibody. Refer to supplemental Figure 2N for overview images.
Figure 2.
Figure 2.
Procoagulant platelets are induced by inflammation in vivo. (A) Experimental scheme of peritoneal sepsis and mesenteric live imaging. (B) Representative images derived from 4-dimensional (4D) live microscopy of mesentery venules. Dotted lines indicate vessel walls. Bar represents 5 µm. PS staining agent: mC1. (C) Quantification of procoagulant platelets in mesenteric venules of sham- or LPS-treated Bl6 mice. Student’s t test, two-tailed, unpaired. (D) Analysis of motility patterns and quantification of procoagulant platelet content in different motility subgroups in sham- or LPS-treated animals. Student’s t test, two-tailed, unpaired. (E) Example image derived from 4D live microscopy of mesentery venules. Yellow signal indicates overlap between phosphatidylserine (PS, mC1) and fibrinogen. Dotted lines indicate vessel walls. Bar represents 10 µm. (F) Quantification of fibrinogen-binding behavior of non-procoagulant (PS-, blue) and procoagulant platelets (PS+, red) from live imaging data (n = 4 LPS-treated mice; n = 2-3 videos per mouse). Data are shown as % of all platelets of the respective subset. One-way ANOVA. (G-H) Example image derived from 4D live microscopy of mesentery venules revealing PS+, fibrinogen-binding adherent platelets. Dotted lines indicate vessel walls. The red line corresponds to the plot profiles for expression of fibrinogen, PS and CD42b (X488) as shown in (H). PS staining agent: mC1. Bar represents 20 µm. (I) Absolute quantification of the area of Fbg, Fbg/CD42b, and Fbg/CD42b/PS overlap in sham- or LPS-injected mice (n = 3-4 mice per condition; n = 2-3 videos per mouse). Student’s t test, two-tailed, unpaired. (J) Experimental scheme and representative immunofluorescence images of mesenteric venules after 4 hours of LPS intraperitoneal injection. White arrowheads indicate procoagulant platelets (CD41/GPIIBIIIA-positive, PS-positive) in close proximity to antibody-stained collagen fibers (green). Bar represents 5 µm. PS staining agent: anti-PS antibody. Refer to supplemental Figure 2N for overview images.
Figure 3.
Figure 3.
Migrating platelets turn procoagulant upon sensing collagen. (A) Experimental setup of hybrid matrices mimicking the inflamed endothelium, with black lines corresponding to collagen fibers. (B) Representative confocal micrograph of human migrating platelets (CD41, white) with or without contact to collagen fibers. White arrowheads indicate procoagulant platelet formation with PS positivity (mC1) and secretion of microvesicles after sensing collagen; dashed white lines indicate collagen fibers. Bar represents 10 µm. (C-E) Representative micrographs of human platelets migrating on an albumin/fibrinogen matrix (upper panel) or a hybrid matrix containing albumin, fibrinogen, and collagen I (lower panel, dashed white lines). Quantification of procoagulant platelet activation on the respective matrix of freely migrating vs collagen-sensing platelets after 45 minutes (fixed time point) or over a period of 1 hour (time course experiment). PS staining agent: mC1. Bar represents 10 µm. Student’s t test, two-tailed, unpaired; one-way ANOVA with Holm-Šídák's multiple comparisons test compared with t = 0 minutes for time course experiment (right panel, E). (F) Quantification of procoagulant platelet activation and migrating platelets of PF4cre-Arpc2fl/fl Cre-positive mice and Cre-negative littermates. Student’s t test, two-tailed, unpaired. (G) Relative velocity plots of tracked human platelets from live-imaging data. Absolute velocities were normalized to peak velocity to allow for interplatelet comparisons. Blue lines indicate the onset of procoagulant platelet activation. (H) Quantification of absolute velocity and Euclidean distance of migrating human platelets from live-imaging data. Individual dots represent n = 3 individuals per experimental group, with n > 30 individual platelets analyzed per n. Student’s t test, two-tailed, unpaired.
Figure 4.
Figure 4.
Genetic or pharmacological targeting of CypD and TMEM16F reduces procoagulant platelet activation without impairing migratory capacity. (A-B) Representative scatter plots and analyses derived from flow cytometric measurements of stimulated platelets from CypD- (A) or TMEM16F-knockout mice (B) (n = 3-4 mice per group). PS staining agent: mC1. Platelets were stimulated with thrombin (0.1 U/L) and convulxin (0.1 µg/mL) for 30 minutes at room temperature. Student’s t test, two-tailed, unpaired. (C-D) Representative micrographs of isolated murine platelets from platelet-specific CypD- (C) or TMEM16F- (D) knockout mice migrating on an albumin/fibrinogen/collagen I hybrid matrix. Quantification of platelet procoagulant activity and cleared area (as a surrogate for migration length) depicted as SuperPlots, with individual circles indicating individual images and the error bars corresponding to the mean data of 6 images of n = 3 to 4 mice per Cre-positive or -negative group. White dashed lines indicate collagen fibers. White arrowheads indicate migrating platelets with collagen contact but without procoagulant activity. White stars indicate procoagulant platelets. Bar represents 25 (left panel) and 15 µm (right panel). PS staining agent: mC1. Student’s t test, two-tailed, unpaired. (E) Experimental scheme of migration assay on hybrid matrix with targeting of platelet PA-promoting pathways. (F-G) Quantification of procoagulant platelets and cleared area by murine (F) and human platelets (G) treated with inhibitors of CypD (cyclosporine A, CicA, 2 µM) or TMEM16F (niflumic acid [NFA] 10 µM). One-way ANOVA with Holm-Šídák's multiple comparisons test compared with control groups. (H) Representative images of migrating human platelets stained for CD41 and PS (mC1) and incubated with an internally quenched 5-FAM/QXL 520 FRET substrate indicating thrombin activity. White arrowhead indicates a procoagulant, thrombin-positive platelet. Bar represents 10 µm. See supplemental Figure 4R for detailed images. (I) Cell-based quantification of thrombin-positive cells/FOV and the fraction of thrombin-positive cells as percentage of procoagulant platelets. Per condition, >100 cells from at least n = 2 animals were analyzed. One-way ANOVA with Holm-Šídák's multiple comparisons test compared with control groups.
Figure 4.
Figure 4.
Genetic or pharmacological targeting of CypD and TMEM16F reduces procoagulant platelet activation without impairing migratory capacity. (A-B) Representative scatter plots and analyses derived from flow cytometric measurements of stimulated platelets from CypD- (A) or TMEM16F-knockout mice (B) (n = 3-4 mice per group). PS staining agent: mC1. Platelets were stimulated with thrombin (0.1 U/L) and convulxin (0.1 µg/mL) for 30 minutes at room temperature. Student’s t test, two-tailed, unpaired. (C-D) Representative micrographs of isolated murine platelets from platelet-specific CypD- (C) or TMEM16F- (D) knockout mice migrating on an albumin/fibrinogen/collagen I hybrid matrix. Quantification of platelet procoagulant activity and cleared area (as a surrogate for migration length) depicted as SuperPlots, with individual circles indicating individual images and the error bars corresponding to the mean data of 6 images of n = 3 to 4 mice per Cre-positive or -negative group. White dashed lines indicate collagen fibers. White arrowheads indicate migrating platelets with collagen contact but without procoagulant activity. White stars indicate procoagulant platelets. Bar represents 25 (left panel) and 15 µm (right panel). PS staining agent: mC1. Student’s t test, two-tailed, unpaired. (E) Experimental scheme of migration assay on hybrid matrix with targeting of platelet PA-promoting pathways. (F-G) Quantification of procoagulant platelets and cleared area by murine (F) and human platelets (G) treated with inhibitors of CypD (cyclosporine A, CicA, 2 µM) or TMEM16F (niflumic acid [NFA] 10 µM). One-way ANOVA with Holm-Šídák's multiple comparisons test compared with control groups. (H) Representative images of migrating human platelets stained for CD41 and PS (mC1) and incubated with an internally quenched 5-FAM/QXL 520 FRET substrate indicating thrombin activity. White arrowhead indicates a procoagulant, thrombin-positive platelet. Bar represents 10 µm. See supplemental Figure 4R for detailed images. (I) Cell-based quantification of thrombin-positive cells/FOV and the fraction of thrombin-positive cells as percentage of procoagulant platelets. Per condition, >100 cells from at least n = 2 animals were analyzed. One-way ANOVA with Holm-Šídák's multiple comparisons test compared with control groups.
Figure 5.
Figure 5.
Genetic ablation of platelet PA aggravates inflammatory bleeding. (A) Experimental scheme for acute lung injury in platelet-specific CypD-knockout mice. (B) Representative image of BALF from platelet-specific CypD-knockout mice and Cre-negative littermates. (C) Flow cytometric analysis of RBC and platelet counts in BALF. Student’s t test, two-tailed, unpaired. (D) Representative micrograph of immunofluorescence-stained lung slices from CypD-knockout mice and Cre-negative control animals. Bar represents 100 µm. (E) Histological quantification of alveolar hemorrhage (TER119+ area) as well as pulmonary neutrophil and platelet recruitment. Student’s t test, two-tailed, unpaired. (F) Magnified excerpts of representative micrographs, corresponding to white rectangle in Figure 5D. Bar represents 50 µm. (G) Experimental scheme for acute lung injury in TMEM16F-knockout mice. (H) Representative image of BALF from platelet-specific TMEM16F-knockout mice and Cre-negative littermates. (I) Flow cytometric analysis of RBC and platelet counts in BALF. Student’s t test, two-tailed, unpaired. (J) Representative micrograph of immunofluorescence-stained lung slices from TMEM16F-knockout mice and Cre-negative littermates. Bar represents 100 µm. (K) Histopathological quantification of alveolar hemorrhage (TER119+ area) as well as pulmonary neutrophil and platelet recruitment. Student’s t test, two-tailed, unpaired. (L) Magnified excerpts of representative micrographs, corresponding to white rectangle in Figure 5J. Bar represents 50 µm.
Figure 6.
Figure 6.
Impact of genetic and pharmacological targeting of PA pathways on platelet calcium oscillations. (A) Representative images of time-lapse microscopy of migrating human platelets and respective calcium oscillations (green) and PS exposure (annexin V, pink). PH, phase contrast. Bar represents 10 µm. White boxes indicate the area of measurement analyzed in (B). See supplemental Video 2 for corresponding live imaging. (B) Intensity projection for calcium (blue) and PS signal intensity (red) over time as % of maximum intensity for cells 1 to 3. (C) Representative calcium oscillation profiles of migrating platelets from CypD- or TMEM16F-deficient compared with platelets from PF4cre-negative animals. (D) Quantification of mean normalized calcium amplitudes and calcium peak frequency measured from mouse platelets across genotypes. n = 103 individual platelets. One-way ANOVA with Holm-Šídák's multiple comparison test. (E) Representative micrographs and calcium (blue) and PS intensity profiles (mC1, red) derived from live imaging of the 2 CypD-deficient mouse platelets indicated by white boxes. Bar represents 10 µm. Arrows indicate the beginning of contact to collagen fibers. (F) Relative quantification of percentage of supramaximal calcium peaks of all collagen-associated mouse platelets as well as relative quantification of supramaximal calcium peak-positive procoagulant platelets. Individual dots represent percentages derived from individual time-lapse microscopy videos. Platelets were isolated from n = 2 to 3 mice/group. PS staining agent: mC1. One-way ANOVA with Holm-Šídák's multiple comparisons test.
Figure 7.
Figure 7.
Pharmacological ablation of platelet PA through simultaneous GPIIBIIIA and GPVI inhibition aggravates inflammatory bleeding. (A) Experimental scheme of migration assay on hybrid matrix with targeting of platelet receptors and signaling cascades. (B-C) Quantification of procoagulant platelets and cleared area by murine (B) and human platelets (C) treated with inhibitors of GPVI signaling (BI-1002494 = Syk inhibitor, 5 µM; JAQ1 = GPVI-blocking antibody, 10 µg/mL) or GPIIBIIIA outside-in signaling (mP6 = Gα13 inhibitor, 20 µM). One-way ANOVA with Holm-Šídák's multiple comparisons test. (D) Representative images of time-lapse microscopy of migrating human platelets and respective calcium oscillations (blue) and PS exposure (red) recorded after 0, 2, and 8 minutes of migration. Bar represents 10 µm. White boxes indicate the area of measurement depicted next to micrographs. See supplemental Video 3 for corresponding live imaging. (E) Upper panel: Quantification of calcium peaks of migrating human platelets treated with vehicle, mP6 (20 µM) or BI-1002494 (2.5 µM). Lower panel: Relative quantification (%) of migrating, collagen-associated platelets treated with vehicle, mP6, or BI-1002494 that express supramaximal calcium peaks upon collagen contact (n = 5-6 videos from n = 2-3 mice per condition with a total of >100 platelets were analyzed). One-way ANOVA with Holm-Šídák's multiple comparisons test. (F) Experimental scheme for acute lung injury in Bl6 mice treated with JAQ1, a GPVI-blocking antibody, or isotype (red arrow) 72 hours prior to LPS challenge (blue arrow) and vehicle or tirofiban injections (red arrows) at 0, 4, and 8 hours after LPS challenge. (G) Representative image of BALF collected from different experimental groups. (H) Assessment of Hb absorption and flow cytometric analysis of RBC, polymorphonuclear, and platelet counts in BALF (n = 4 mice per group). One-way ANOVA with Holm-Šídák's multiple comparisons test compared with control groups. (I) Flow cytometric measurement of circulating procoagulant platelets in peripheral blood, normalized to counting beads. Student’s t test, two-tailed, unpaired. (J) Linear regression analysis of the correlation of circulating procoagulant platelets and inflammatory bleeding severity as assessed by RBC count/µL BALF. (K) Representative micrograph of immunofluorescence-stained lung slices from IgG2a and vehicle vs JAQ1 and tirofiban-treated animals. Bar represents 100 µm. (L) Quantification of alveolar hemorrhage (TER119+ area) as well as pulmonary platelet and neutrophil recruitment. PS staining agent for all experiments shown in Figure 7: mC1. n = 4 mice per group. Student’s t test, two-tailed, unpaired. (M) Magnified excerpts of representative immunofluorescence stainings, corresponding to white rectangles in Figure 7K. Bar represents 50 µm. (N) Histopathological quantification of pulmonary PNAs per FOV 24 hours after LPS challenge. Student’s t test, two-tailed, unpaired.
Figure 7.
Figure 7.
Pharmacological ablation of platelet PA through simultaneous GPIIBIIIA and GPVI inhibition aggravates inflammatory bleeding. (A) Experimental scheme of migration assay on hybrid matrix with targeting of platelet receptors and signaling cascades. (B-C) Quantification of procoagulant platelets and cleared area by murine (B) and human platelets (C) treated with inhibitors of GPVI signaling (BI-1002494 = Syk inhibitor, 5 µM; JAQ1 = GPVI-blocking antibody, 10 µg/mL) or GPIIBIIIA outside-in signaling (mP6 = Gα13 inhibitor, 20 µM). One-way ANOVA with Holm-Šídák's multiple comparisons test. (D) Representative images of time-lapse microscopy of migrating human platelets and respective calcium oscillations (blue) and PS exposure (red) recorded after 0, 2, and 8 minutes of migration. Bar represents 10 µm. White boxes indicate the area of measurement depicted next to micrographs. See supplemental Video 3 for corresponding live imaging. (E) Upper panel: Quantification of calcium peaks of migrating human platelets treated with vehicle, mP6 (20 µM) or BI-1002494 (2.5 µM). Lower panel: Relative quantification (%) of migrating, collagen-associated platelets treated with vehicle, mP6, or BI-1002494 that express supramaximal calcium peaks upon collagen contact (n = 5-6 videos from n = 2-3 mice per condition with a total of >100 platelets were analyzed). One-way ANOVA with Holm-Šídák's multiple comparisons test. (F) Experimental scheme for acute lung injury in Bl6 mice treated with JAQ1, a GPVI-blocking antibody, or isotype (red arrow) 72 hours prior to LPS challenge (blue arrow) and vehicle or tirofiban injections (red arrows) at 0, 4, and 8 hours after LPS challenge. (G) Representative image of BALF collected from different experimental groups. (H) Assessment of Hb absorption and flow cytometric analysis of RBC, polymorphonuclear, and platelet counts in BALF (n = 4 mice per group). One-way ANOVA with Holm-Šídák's multiple comparisons test compared with control groups. (I) Flow cytometric measurement of circulating procoagulant platelets in peripheral blood, normalized to counting beads. Student’s t test, two-tailed, unpaired. (J) Linear regression analysis of the correlation of circulating procoagulant platelets and inflammatory bleeding severity as assessed by RBC count/µL BALF. (K) Representative micrograph of immunofluorescence-stained lung slices from IgG2a and vehicle vs JAQ1 and tirofiban-treated animals. Bar represents 100 µm. (L) Quantification of alveolar hemorrhage (TER119+ area) as well as pulmonary platelet and neutrophil recruitment. PS staining agent for all experiments shown in Figure 7: mC1. n = 4 mice per group. Student’s t test, two-tailed, unpaired. (M) Magnified excerpts of representative immunofluorescence stainings, corresponding to white rectangles in Figure 7K. Bar represents 50 µm. (N) Histopathological quantification of pulmonary PNAs per FOV 24 hours after LPS challenge. Student’s t test, two-tailed, unpaired.

Comment in

References

    1. Van der Meijden PEJ, Heemskerk JWM. Platelet biology and functions: new concepts and clinical perspectives. Nat Rev Cardiol. 2019;16(3):166-179. - PubMed
    1. Nicolai L, Gaertner F, Massberg S. Platelets in host defense: experimental and clinical insights. Trends Immunol. 2019;40(10):922-938. - PubMed
    1. Stark K, Massberg S. Interplay between inflammation and thrombosis in cardiovascular pathology. Nat Rev Cardiol. 2021;18(9):666-682. - PMC - PubMed
    1. Yeaman MR. Platelets: at the nexus of antimicrobial defence. Nat Rev Microbiol. 2014;12(6):426-437. - PubMed
    1. Sreeramkumar V, Adrover JM, Ballesteros I, et al. . Neutrophils scan for activated platelets to initiate inflammation. Science. 2014; 346(6214):1234-1238. - PMC - PubMed

Publication types

MeSH terms

Substances