. 2022 Apr 26;22(1):836.
doi: 10.1186/s12889-022-13252-3.

Online reach and engagement of a child nutrition peer-education program (PICNIC): insights from social media and web analytics

Affiliations

Online reach and engagement of a child nutrition peer-education program (PICNIC): insights from social media and web analytics

Maria Henström et al. BMC Public Health. .

Abstract

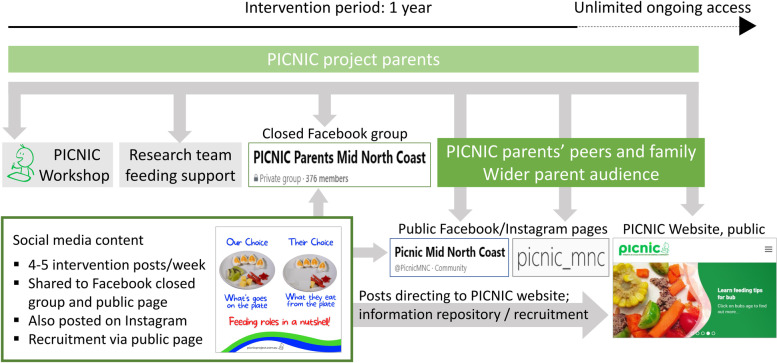
Background: Parents frequently seek parental advice online and on social media; thus, these channels should be better utilized in child health interventions. The Parents in Child Nutrition Informing Community (PICNIC) program aims to facilitate peer-to-peer sharing of evidence-based child feeding information and support parents within their social networks. The present study aimed to explore web and social media analytics to evaluate reach and user engagement with the PICNIC online components.

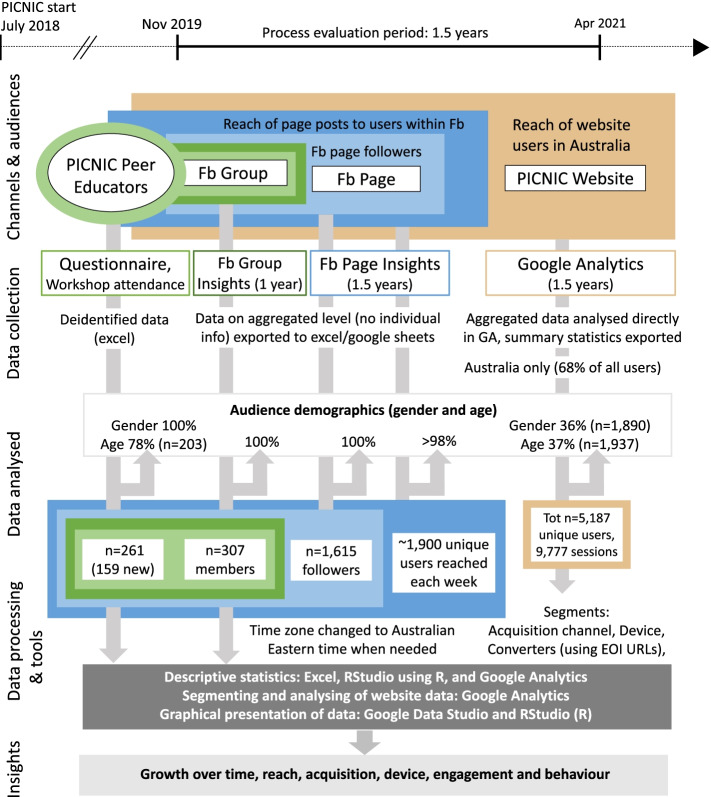
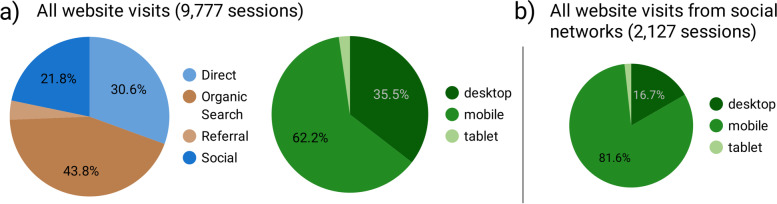
Methods: Online user activity data from the PICNIC Facebook closed group and public Page were collected through Facebook Insights, and program-specific website traffic data through Google Analytics. Analytics data from Nov-2019 to April-2021 was evaluated through visualisation and summary statistics to obtain insights into program growth and current reach in Australia, compare demographics of audience reached through the online channels, and explore parents' use and engagement in PICNIC content.

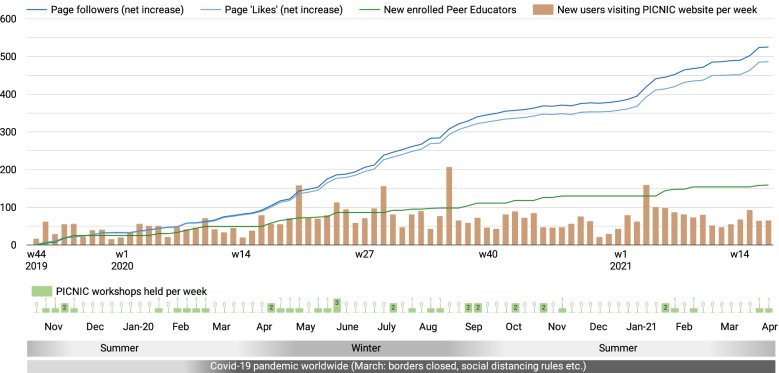
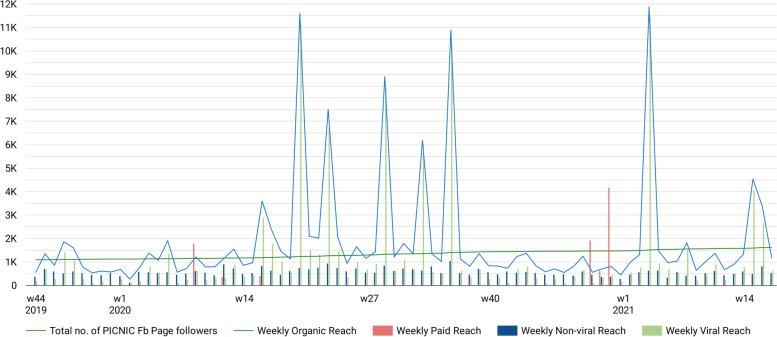
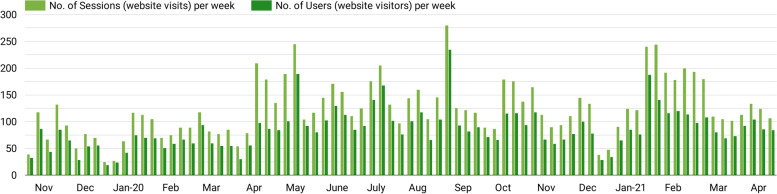
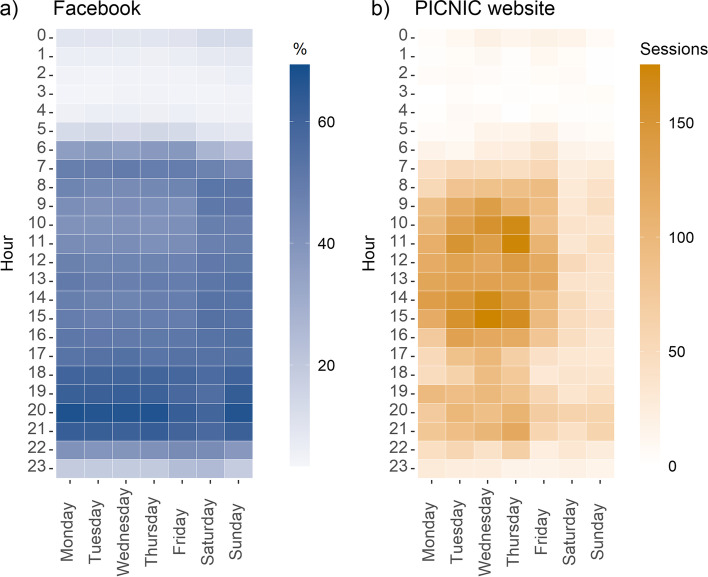
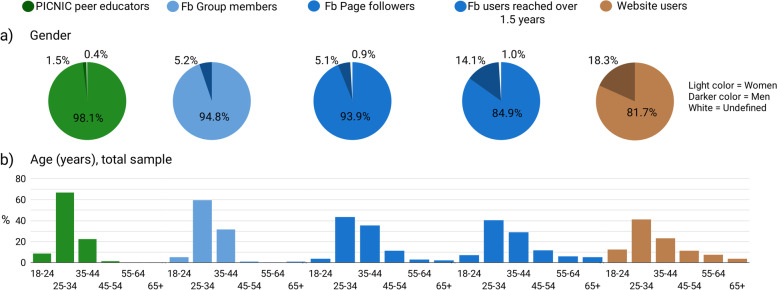
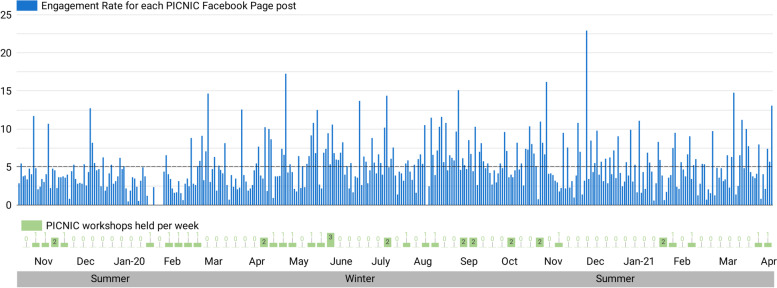
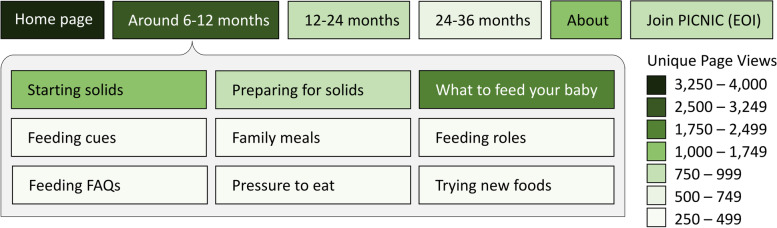
Results: Results showed steady program growth in the 18 months of recruitment; participant numbers grew from 102 to 261 peer educators while the Facebook Page audience increased threefold, totalling 1615 followers. Intervention posts shared on Facebook (4-5 posts/week) typically reached only a portion of PICNIC Page followers each week, but also reached a wider audience through their friends. Throughout the evaluated period, Facebook users actively engaged in PICNIC posts, although the level of engagement varied considerably from post to post. Furthermore, results from this study suggest the strategy of directing potentially interested parents from social media to the website for program sign-up was successful. Finally, the explored data gave insights into users' availability, demographics and engagement, which will be used to inform refinement of the PICNIC website and social media strategies.

Conclusions: Our findings confirm the benefits of using a peer education approach and existing social network channels to disseminate evidence-based child feeding information to parents. This study also demonstrates the usefulness of web and social media analytics to be used as part of a continuous evaluation for gaining insight to inform further development and improvement of program strategies.

Trial registration: The PICNIC project was retrospectively submitted for registration with the Australian New Zealand Clinical Trials Registry (ANZCTR), ACTRN12622000230752 (09/02/2022).

Keywords: Child feeding practices; Child nutrition; Google analytics; Parents; Peer education; Social media; Website; eHealth intervention.


Conflict of interest statement

The authors declare that they have no competing interests.

Figures

Fig. 1
Fig. 1
PICNIC online components. Overview of child nutrition and feeding resources provided through different channels in the PICNIC program
Fig. 2
Fig. 2
Study overview. Sources of data collected, audiences and type of data evaluated, data processing, tools used and information/insights gained. Fb, Facebook; GA, Google Analytics; EOI; Expression of Interest
Fig. 3
Fig. 3
Growth of the PICNIC program online. Time chart for the 1.5-year evaluation period, comparing new peer-educators enrolled in the program, with the net increase of Fb Page fans (Page ‘likes’) and followers, as well as weekly number of new (first-time) website users in Australia. Contextual factors shown (bottom): peer educator workshops held, months/seasons, and the Covid-19 pandemic
Fig. 4
Fig. 4
Reach on Facebook. Weekly reach of the PICNIC Fb Page content in relation to the total number of Page followers over time. Organic Reach: the weekly number of unique users who saw any Page content (typically posts) without any paid distribution. Paid reach: the weekly number of unique users who saw Page content through paid distribution (in this case, ‘boosted’ posts). Non-viral Reach: weekly organic reach to people connected to the Page (such as Page followers or fans). Viral Reach: weekly organic reach to people who saw Page content because of their friends (who for instance liked the Page, or shared or engaged with a PICNIC Page post). Fb, Facebook; w, week of the year
Fig. 5
Fig. 5
PICNIC website reach. Weekly number of sessions and unique users visiting the website
Fig. 6
Fig. 6
Audience online. Heat maps showing a) the percentage of Page fans (who had liked the PICNIC Fb Page) that were online on each specific hour with average data for each weekday and hour, and b) PICNIC website sessions by time of day and day of the week (total number of sessions/hour over the 1.5-year period)
Fig. 7
Fig. 7
Audience demographics. Bar and pie chart showing age and gender distribution of peer educators versus the audiences reached through the different online channels. Gender and age data was available for 100 and 78% of peer educators, respectively, all Fb group members and Fb Page followers, and almost all (> 98%) of Fb users reached by the intervention through Fb Page posts. Google Analytics only collects demographics data on a subset of website users (e.g., when DoubleClick cookies are present, or users are logged in to Google), and during the 1.5-year period gender and age information were available for about 37% of PICNIC website users. Fb, Facebook
Fig. 8
Fig. 8
Per-post engagement relative to post reach. Engagement rate, calculated as Lifetime Engaged Users (Unique Users) / Lifetime Post Total reach (Unique Users)*100, is shown for each of the 359 posts plotted in chronological order over the 1.5-year period evaluated. Average engagement rate (5.1% of reached users) is indicated with a reference line
Fig. 9
Fig. 9
Acquisition channel and device used to visit the PICNIC website. The pie charts are based on visits i.e., sessions, not individual users, as people may arrive at the website in different ways from visit to visit. Direct: users arriving through a source not recognisable to Google Analytics (such as typing in the URL directly, using browser bookmarks, clicking a non-traceable link in a document or e-mail, and other). Organic search: users arriving through a search engine. Referral: users referred to the website through a traceable link clicked on another website. Social: users arriving from a social network platform, such as Facebook or Instagram
Fig. 10
Fig. 10
Most popular pages viewed by visitors to the PICNIC program website (picnicproject.com.au). Heat map based on engagement metrics obtained in Google Analytics for all sessions by users visiting from Australia during the 1.5-year period Nov-2019 to Apr-2021. The subpages within the age category 6–12 months are shown since this was the most viewed part of the website. Unique page views: the number of sessions during which the specified page was viewed at least once, based on URLs. EOI, Expression of Interest

Similar articles

Cited by

References

    1. World Health Organization . Obesity and overweight. 2021.
    1. Commission on Ending Childhood Obesity . Report of the Commission on Ending Childhood Obesity. Geneva: World Health Organization; 2016.
    1. Moore T, Arefadib N, Deery A, Keyes M, West S. The first thousand days: an evidence paper. Melbourne: Centre for Community Child Health; 2017.
    1. Luque V, Escribano J, Closa-Monasterolo R, Zaragoza-Jordana M, Ferré N, Grote V, et al. Unhealthy dietary patterns established in infancy track to mid-childhood: the EU childhood obesity project. J Nutr. 2018;148:752–759. doi: 10.1093/jn/nxy025. - DOI - PubMed
    1. Mikkilä V, Räsänen L, Raitakari OT, Pietinen P, Viikari J. Consistent dietary patterns identified from childhood to adulthood: the cardiovascular risk in Young Finns study. Br J Nutr. 2005;93:923–931. doi: 10.1079/BJN20051418. - DOI - PubMed

Publication types

LinkOut - more resources