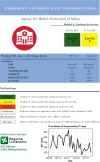
Time-series cohort study to forecast emergency department visits in the city of Milan and predict high demand: a 2-day warning system
- PMID: 35473738
- PMCID: PMC9045060
- DOI: 10.1136/bmjopen-2021-056017
Time-series cohort study to forecast emergency department visits in the city of Milan and predict high demand: a 2-day warning system
Abstract
Objectives: The emergency department (ED) is one of the most critical areas in any hospital. Recently, many countries have seen a rise in the number of ED visits, with an increase in length of stay and a detrimental effect on quality of care. Being able to forecast future demands would be a valuable support for hospitals to prevent high demand, particularly in a system with limited resources where use of ED services for non-urgent visits is an important issue.
Design: Time-series cohort study.
Setting: We collected all ED visits between January 2014 and December 2019 in the five larger hospitals in Milan. To predict daily volumes, we used a regression model with autoregressive integrated moving average errors. Predictors included were day of the week and year-round seasonality, meteorological and environmental variables, information on influenza epidemics and festivities. Accuracy of prediction was evaluated with the mean absolute percentage error (MAPE).
Primary outcome measures: Daily all-cause EDs visits.
Results: In the study period, we observed 2 223 479 visits. ED visits were most likely to occur on weekends for children and on Mondays for adults and seniors. Results confirmed the role of meteorological and environmental variables and the presence of day of the week and year-round seasonality effects. We found high correlation between observed and predicted values with a MAPE globally smaller than 8.1%.
Conclusions: Results were used to establish an ED warning system based on past observations and indicators of high demand. This is important in any health system that regularly faces scarcity of resources, and it is crucial in a system where use of ED services for non-urgent visits is still high.
Keywords: ACCIDENT & EMERGENCY MEDICINE; EPIDEMIOLOGY; QUALITATIVE RESEARCH; STATISTICS & RESEARCH METHODS.
© Author(s) (or their employer(s)) 2022. Re-use permitted under CC BY-NC. No commercial re-use. See rights and permissions. Published by BMJ.
Conflict of interest statement
Competing interests: None declared.
Figures
References
-
- Programma Nazionale Esiti - PNE . Home, 2018. Available: https://pne.agenas.it/index.php [Accessed Feb 18, 2020].
MeSH terms
LinkOut - more resources
Full Text Sources
Medical
Miscellaneous


