. 2022 Apr 26;9(4):e1169.
doi: 10.1212/NXI.0000000000001169. Print 2022 Jul.

Heterogeneity of Acetylcholine Receptor Autoantibody-Mediated Complement Activity in Patients With Myasthenia Gravis

Affiliations

Heterogeneity of Acetylcholine Receptor Autoantibody-Mediated Complement Activity in Patients With Myasthenia Gravis

Abeer H Obaid et al. Neurol Neuroimmunol Neuroinflamm. .

Erratum in

Abstract

Background and objectives: Autoantibodies targeting the acetylcholine receptor (AChR), found in patients with myasthenia gravis (MG), mediate pathology through 3 mechanisms: complement-directed tissue damage, blocking of the acetylcholine binding site, and internalization of the AChR. Clinical assays, used to diagnose and monitor patients, measure only autoantibody binding. Consequently, they are limited in providing association with disease burden, understanding of mechanistic heterogeneity, and monitoring therapeutic response. The objective of this study was to develop a cell-based assay that measures AChR autoantibody-mediated complement membrane attack complex (MAC) formation.

Methods: An HEK293T cell line-modified using CRISPR/Cas9 genome editing to disrupt expression of the complement regulator genes (CD46, CD55, and CD59)-was used to measure AChR autoantibody-mediated MAC formation through flow cytometry.

Results: Serum samples (n = 155) from 96 clinically confirmed AChR MG patients, representing a wide range of disease burden and autoantibody titer, were tested along with 32 healthy donor (HD) samples. AChR autoantibodies were detected in 139 of the 155 (89.7%) MG samples through a cell-based assay. Of the 139 AChR-positive samples, autoantibody-mediated MAC formation was detected in 83 (59.7%), whereas MAC formation was undetectable in the HD group or AChR-positive samples with low autoantibody levels. MAC formation was positively associated with autoantibody binding in most patient samples; ratios (mean fluorescence intensity) of MAC formation to AChR autoantibody binding ranged between 0.27 and 48, with a median of 0.79 and an interquartile range of 0.43 (0.58-1.1). However, the distribution of ratios was asymmetric and included extreme values; 16 samples were beyond the 10-90 percentile, with high MAC to low AChR autoantibody binding ratio or the reverse. Correlation between MAC formation and clinical disease scores suggested a modest positive association (rho = 0.34, p = 0.0023), which included a subset of outliers that did not follow this pattern. MAC formation did not associate with exposure to immunotherapy, thymectomy, or MG subtypes defined by age-of-onset.

Discussion: A novel assay for evaluating AChR autoantibody-mediated complement activity was developed. A subset of patients that lacks association between MAC formation and autoantibody binding or disease burden was identified. The assay may provide a better understanding of the heterogeneous autoantibody molecular pathology and identify patients expected to benefit from complement inhibitor therapy.


Figures

Figure 1
Figure 1. Autoantibody-Mediated Complement Fixation Assay With CD46/55/59 KO HEK293T Cells
Autoantibodies were tested for their ability to mediate complement activation through measuring MAC formation through FACS on live cells, transfected with self-antigens, in which the complement regulators (CD46, CD55, and CD59) were knocked out. NHS was added as consistent complement source. Control conditions included omitted NHS or heat-inactivated NHS. All tested patient or HD serum samples were heat-inactivated. (A) Measurement of MAC formation using an in vitro complement CBA with AQP4 transfected CD46/55/59 KO HEK293T cells. Complement fixation was tested with AQP4-specific autoantibody sources (anti-AQP4 monoclonal mAb-58 IgG1 and NMOSD serum) and negative control autoantibody sources (anti-AChR mAb-637 IgG1 and serum from MG patients and HDs). NHS and HI NHS bars represent the mean of duplicate experimental conditions, whereas No NHS bars represent singlets. (B) Representative FACS analysis of AChR-transfected CD46/55/59 KO HEK293T cells using an in vitro complement CBA. AChR-transfected cells were tested without (top row) or with the anti-AChR mAb-637 IgG1 (bottom row). (C) Measurement of MAC formation using the complement CBA with AChR-transfected CD46/55/59 KO HEK293T. Complement fixation was tested with AChR-specific autoantibody sources (anti-AChR mAb-637 IgG1 and serum from MG patients) and negative control autoantibody sources (anti-AQP4 monoclonal mAb-58 IgG1 and serum from NMOSD patients and HDs). NHS and HI NHS bars represent the mean of duplicate experimental conditions, whereas No NHS bars represent singlets. (D) Factor B–depleted NHS was used in the complement CBA to test whether the alternative pathway contributed to autoantibody-mediated MAC formation. AQP4-transfected cells were tested without (top row) or with the anti-AQP4 monoclonal mAb-58 IgG1 (bottom row). (E) Nontransfected CD46/55/59 KO HEK293T cells were tested in the complement CBA using antigen-specific mAbs (mAb-637 or mAb-58) or serum from MG patients and HDs to test for the requirement of autoantigens in MAC formation. Samples used in panels (A–E) mAb-58 IgG1 (anti-AQP4 monoclonal), NMOSD patient (NMOSD-1), mAb-637 IgG1 (anti-AChR monoclonal), MG patient serum (MG-87, MG-43, MG-56, and MG-44), and healthy donors (HD-9, HD-29, and HD-30). AChR = acetylcholine receptor; blank = no serum; CBA = cell-based assay; factor B-dHS = factor B–depleted human serum, HDs = healthy donors; HI = heat-inactivated; HI factor B-dHS = heat-inactivated factor B–depleted human serum; MAC = membrane attack complex; MG = myasthenia gravis; NHS = normal human serum; NMOSD = neuromyelitis optica spectrum disorder.
Figure 2
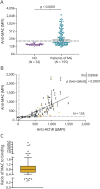
Figure 2. AChR Autoantibody–Mediated Complement Formation in MG Patients
AChR autoantibodies in serum were tested for their ability to mediate complement activation through measuring MAC formation on live AChR-expressing CD46/55/59 KO HEK293T cells. (A) Comparison of MAC formation using serum samples (n = 32) from HDs and serum samples (n = 155) from AChR MG patients. The cutoff for positivity was set at the mean MFI +4 STD (210.9 MFI) of the HD samples. Each data point represents the mean of triplicate experimental conditions. (B) Correlation between MAC formation and AChR autoantibody binding by CBA. The Spearman correlation was used to calculate the relationship. The binding CBA cutoff for positivity was set at the mean MFI +4STD (21.91 ΔMFI) of the HD samples. Each data point represents the mean of triplicate experimental conditions. Colored (gold) points represent samples selected for further evaluation (Figure 3). (C) Graphical representation of heterogeneity in MAC formation and AChR autoantibody binding of MG samples. Cross-sectional samples (n = 89) were analyzed through a ratio of MAC formation and autoantibody binding to observe disassociation between AChR autoantibody binding and complement formation. The box-whisker plot shows the median (0.79) and 10–90 percentile (outlined by the whiskers) of the MAC to AChR autoantibody binding ratios. The dots represent data outside of the 10–90 percentile. The y-axis is not to scale and was divided into 3 sections for better visual representation. All samples were measured in triplicate, and those with negative ΔMFI binding values (n = 5) were excluded from the analysis. AChR = acetylcholine receptor; CBA = cell-based assay; HDs = healthy donors; MAC = membrane attack complex; MFI = mean fluorescence intensity; MG = myasthenia gravis.
Figure 3
Figure 3. Heterogeneous AChR Autoantibody–Mediated Complement Formation
Selected samples (indicated by golden points in Figure 2B) were examined side-by-side for both MAC formation and CBA binding. Each graph shows the data collected from individual serum samples. The x-axis represents the serum dilution of the sample tested for complement CBA (MAC) formation (blue dots) or CBA binding (golden dots). For AChR autoantibody binding (left y-axis), samples were tested at serum dilutions of 1:20 and 4 additional 3-fold dilutions (1:50, 1:150, 1:450, and 1:1,350). For MAC formation (right y-axis), samples were tested at 2-fold serial dilutions (1:20, 1:40, 1:80, 1:160, and 1:320). Each data point represents the mean of experimental triplicate experimental conditions. Dotted horizonal lines mark the positive reactivity cutoff for complement (blue) and CBA binding (golden). Cutoffs were calculated using the mean MFI + 4STD of the HD samples (complement and CBA 96.01 MFI and 75.35 ΔMFI, respectively). Data from additional samples are shown in eFigure 6 (links.lww.com/NXI/A712). AChR = acetylcholine receptor; CBA = cell-based assay; HDs = healthy donors; MAC = membrane attack complex; MFI = mean fluorescence intensity.
Figure 4
Figure 4. Correlation Between Clinical Disease Measurements and Autoantibody-Mediated Complement Formation
Cross-sectional samples were assessed for correlation between MGFA classification or MGC score and the binding CBA or complement CBA data. (A and B) Samples with low disease severity (MGFA 0/I) were compared with samples with higher disease severity (MGFA II–V) for differences in (A) autoantibody binding (median MGFA (0/I): 327.3 (II–V): 748.2; p-value < 0.0001) or (B) MAC formation (median MGFA [0/I]: 190.3 [II–V]: 468.3; p-value <0.0001). (C and D) The Spearman correlation was used to calculate the relationship between cross-sectional sample MGC scores and (C) autoantibody binding (rho 0.437, p-value = 0.0001) or (D) MAC formation (rho 0.351, p-value = 0.0023). Each data point in (A–D) represents the mean of triplicate experimental conditions. White and gray lines in (A and B) represent the median and quartiles, respectively. CBA = cell-based assay; HDs = healthy donors; MAC = membrane attack complex; MGC = MG composite score; MGFA = Myasthenia Gravis Foundation of American.

References

    1. Vincent A. Unravelling the pathogenesis of myasthenia gravis. Nat Rev Immunol. 2002;2(10):797-804. - PubMed
    1. Gilhus NE, Skeie GO, Romi F, Lazaridis K, Zisimopoulou P, Tzartos S. Myasthenia gravis–autoantibody characteristics and their implications for therapy. Nat Rev Neurol. 2016;12(5):259-268. - PubMed
    1. Yi JS, Guptill JT, Stathopoulos P, Nowak RJ, O'Connor KC. B cells in the pathophysiology of myasthenia gravis. Muscle Nerve. 2018;57(2):172-184. - PMC - PubMed
    1. Vincent A, Newsom Davis J. Anti-acetylcholine receptor antibodies. J Neurol Neurosurg Psychiatry. 1980;43(7):590-600. - PMC - PubMed
    1. Lefvert AK, Bergström K, Matell G, Osterman PO, Pirskanen R. Determination of acetylcholine receptor antibody in myasthenia gravis: clinical usefulness and pathogenetic implications. J Neurol Neurosurg Psychiatry. 1978;41(5):394-403. - PMC - PubMed

Publication types