. 2022 Apr 26;12(1):6780.
doi: 10.1038/s41598-022-10488-2.

Characterizing tuberculosis transmission dynamics in high-burden urban and rural settings

Affiliations

Characterizing tuberculosis transmission dynamics in high-burden urban and rural settings

Jonathan P Smith et al. Sci Rep. .

Abstract

Mycobacterium tuberculosis transmission dynamics in high-burden settings are poorly understood. Growing evidence suggests transmission may be characterized by extensive individual heterogeneity in secondary cases (i.e., superspreading), yet the degree and influence of such heterogeneity is largely unknown and unmeasured in high burden-settings. We conducted a prospective, population-based molecular epidemiology study of TB transmission in both an urban and rural setting of Botswana, one of the highest TB burden countries in the world. We used these empirical data to fit two mathematical models (urban and rural) that jointly quantified both the effective reproductive number, [Formula: see text], and the propensity for superspreading in each population. We found both urban and rural populations were characterized by a high degree of individual heterogeneity, however such heterogeneity disproportionately impacted the rural population: 99% of secondary transmission was attributed to only 19% of infectious cases in the rural population compared to 60% in the urban population and the median number of incident cases until the first outbreak of 30 cases was only 32 for the rural model compared to 791 in the urban model. These findings suggest individual heterogeneity plays a critical role shaping local TB epidemiology within subpopulations.


Conflict of interest statement

The authors declare no competing interests.

Figures
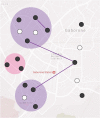
Figure 1
Figure 1
Visualization of primary transmission sub-cluster definition. Using geospatial and epidemiological data, we estimated the size of TB transmission sub-clusters within a MIRU-VNTR genotypic cluster. Participants with the same M. tuberculosis genotype (black circles) were considered a genotypic cluster (Y=13). Participants were in a transmission sub-cluster if they were in the same SaTScan geospatial cluster (colored circles) or identified through an epidemiological link (solid lines). This fictitious example represents a genotypic cluster of size 13 with two transmission sub-clusters of size 8 (purple) and 3 (pink) and two isolated cases. White circles represent TB cases with a different MIRU-VNTR profile and are not included in the cluster definitions.
Figure 2
Figure 2
Joint maximum likelihood estimates (MLE) of transmission parameters R and k inferred from transmission cluster analysis. The use of geospatial and epi-link data to identify transmission sub-clustering reveals marked differences in transmission dynamics. (A) MLE and corresponding 90 and 95 percent confidence regions (CRs) using genotypic, geospatial, and epi-link data to identify transmission sub-clusters within a genetic cluster; (B) Values under the assumption that MIRU-VNTR genotypic clusters are transmission clusters. This assumption biases results towards homogeneity and provides functional upper bound estimates of k.
Figure 3
Figure 3
Underlying transmission dynamics in urban and rural models. We fit urban and rural models to the distribution of transmission cluster size data to infer the degree of individual heterogeneity in secondary cases. While all models show that TB transmission is characterized by a high degree of individual heterogeneity, the rural model suggests a substantially higher propensity for explosive outbreaks of recent transmission. (A) Probability of observing large outbreaks originating from a single index case; (B) Probability density of expected number of secondary cases for each individual (i.e., underlying individual reproductive number, ν). The uncertainty interval integrates across the entire range of 95% confidence intervals for both R^ and k^.
Figure 4
Figure 4
Comparison of large TB outbreaks in high-burden urban and rural settings. (A) Relative probability of observing a large outbreak of at least size Y generating from a single case in a rural population compared to an urban population; (B) Absolute probability that a single case results in an outbreak of size of 30 or greater. Colored contours indicate probability bands, with associated probabilities indicated on each band. Setting-specific estimates are provided for clarity. (C) Density curves for the number of incident cases until first observed outbreak of size Y=15, Y=30, and Y=50 resulting from a single index case. Nested boxplots represent the median and interquartile range of 500 simulated surveillance systems, each with 2000 transmission chains (supplemental materials Sect. 1.8). All Y values were arbitrarily chosen to represent sufficiently large outbreaks.
Figure 5
Figure 5
Expected proportion of TB transmission attributed to a given proportion of infectious cases, by population. The proportion of cases responsible for 99 percent of transmission in each model is denoted by the vertical dotted line. The uncertainty interval integrates across the entire range of 95% confidence intervals for both R^ and k^.
Figure 6
Figure 6
Sensitivity of model inference to imperfect surveillance. We simulated 500 perfect and imperfect TB surveillance systems for both the urban and rural models, each with 2000 chains of transmission. True underlying R and k values were specified by the inferred values from the respective populations. In perfect surveillance, all cases were observed with no censoring or sub-clustering. Imperfect simulations combined the following assumptions: only 40% of cases were observed (p1=0.40) and only 15% of otherwise missing cases were identified by active case finding (p2=0.15) for both models. The proportion of censored clusters (pcens) and genotypic clusters containing multiple sub-clusters (pover) were consistent with the observed values (pcens=0.07 and 0.07 and pover=0.15 and 0.28 for the urban and rural models, respectively). See supplemental materials for detailed methods and results from the simulation study.

References

    1. Global Tuberculosis Report. (World Health Organization, Geneva, 2020).
    1. Lönnroth K, Jaramillo E, Williams BG, Dye C, Raviglione M. Drivers of tuberculosis epidemics: The role of risk factors and social determinants. Soc. Sci. Med. 2009;68:2240–2246. doi: 10.1016/j.socscimed.2009.03.041. - DOI - PubMed
    1. Dowdy DW, Azman AS, Kendall EA, Mathema B. Transforming the fight against tuberculosis: Targeting catalysts of transmission. Clin. Infect. Dis. 2014;59:1123–1129. doi: 10.1093/cid/ciu506. - DOI - PMC - PubMed
    1. Diseases of Poverty and the 10/90 Gap. (World Health Organization, Geneva, 2004).
    1. WHO operational handbook on tuberculosis (Module 1Prevention): Tuberculosis preventive treatment (World Health Organization, 2020). - PubMed

Publication types