. 2022 Apr 26;12(1):6765.
doi: 10.1038/s41598-022-10783-y.

Growing urban bicycle networks

Affiliations

Growing urban bicycle networks

Michael Szell et al. Sci Rep. .

Abstract

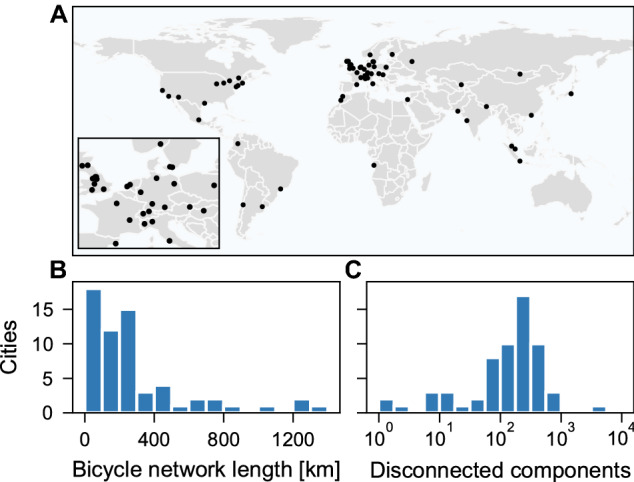
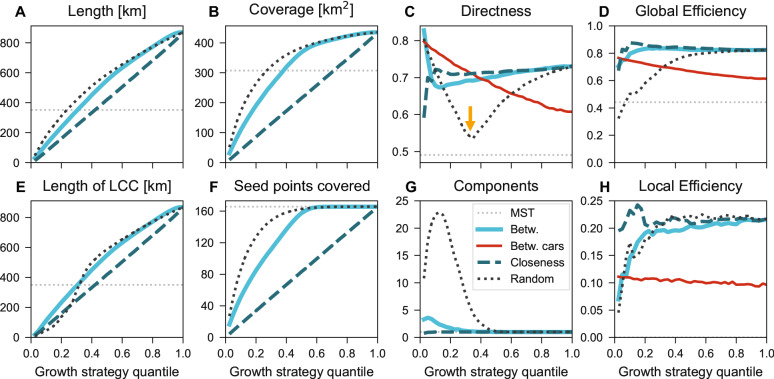
Cycling is a promising solution to unsustainable urban transport systems. However, prevailing bicycle network development follows a slow and piecewise process, without taking into account the structural complexity of transportation networks. Here we explore systematically the topological limitations of urban bicycle network development. For 62 cities we study different variations of growing a synthetic bicycle network between an arbitrary set of points routed on the urban street network. We find initially decreasing returns on investment until a critical threshold, posing fundamental consequences to sustainable urban planning: cities must invest into bicycle networks with the right growth strategy, and persistently, to surpass a critical mass. We also find pronounced overlaps of synthetically grown networks in cities with well-developed existing bicycle networks, showing that our model reflects reality. Growing networks from scratch makes our approach a generally applicable starting point for sustainable urban bicycle network planning with minimal data requirements.


Conflict of interest statement

The authors declare no competing interests.

Figures

Figure 1
Figure 1
The state of existing bicycle networks. (A) We extract street networks from 62 cities covering different regions and cultures; many are considered modern and well developed. (B) The distribution of city-wide lengths of bicycle tracks indicates negligible existing cycling infrastructure that is also (C) split into hundreds of disconnected components. See more details in Supplementary Table 1. Map created with: https://github.com/mszell/bikenwgrowth (v.1.0.0).
Figure 2
Figure 2
Optimal connected network solutions. Adapted from Ref.. (Left) The investor’s optimal strategy for a connected network is to invest as little as possible, minimizing total link length. Its solution is a minimum spanning tree, maximally economic but minimally resilient with low directness, inadequate for travelers. (Right) The traveler’s optimum connects all node pairs creating all direct routes. This solution is minimally economic, maximally resilient and direct, inadequate for investors. It also has crossing links and is therefore not a planar network. (Center) A both economic and resilient, as well as cohesive planar network solution in-between is the triangulation. In particular the minimum weight triangulation, approximated by the greedy triangulation, minimizes investment.
Figure 3
Figure 3
Growing bicycle networks. Explorable interactively at: https://growbike.net. Illustrated here for Paris. Step (1) Seed points: A set of seed points (orange dots) is snapped to the intersections of the street network. Shown are grid points, alternatively we investigated rail stations. Step (2) Greedy triangulation: The seeds are ordered by route distance and connected stepwise without link crossings. Reached seeds are colored blue. Step (3) Order by growth strategy: One of three growth strategies (betweenness, closeness, random) is used to order the triangulation links from the strategy’s 0-quantile (empty graph) to its 1-quantile (full triangulation), resulting in 40 growth stages. Shown are the five quantiles q=0.025,0.125,0.25,0.5,1. Step 4) Route on street network: The links in the growth stages are routed on the street network. These synthetic bicycle networks are then analyzed for all 62 cities. Maps created with: https://github.com/mszell/bikenwgrowth (v.1.0.0).
Figure 4
Figure 4
Different growth strategies optimize different network quality metrics. The three thick curves show the changes of network metrics with growth following three strategies (betweenness, closeness, or random) averaged over all 62 cities for grid seeds. By construction all curves arrive at the same endpoint, but they develop distinctly before that. For rail seeds and individual cities see Supplementary Figs. 5–10. Red curves show the car network’s simultaneous decrease of quality metrics if a five times decrease of speed limits is assumed for cars along all affected streets. Grey dotted lines show metrics for the minimum spanning tree (MST) that connects all seeds with minimal investment. Growth of (A) length, (B) coverage, (C) directness, (D) global efficiency, (E) length of LCC, (F) seed points covered, (G) connected components, (H) local efficiency. The yellow arrow highlights the substantial dip in directness until the critical threshold which is more pronounced for random growth than for betweenness growth.
Figure 5
Figure 5
Network consolidation: Bicycle network growth has a dip of decreasing directness. (A) Three early stages of betweenness growth in Boston. (B) Directness sharply decreases initially due to tree-like growth (compare qB=0.025 and qB=0.1 for Boston). Once directness has reached a minimum (qB=0.1), it starts growing slowly due to the appearance of cycles (qB=0.2). The process is similar for the other cities (shown here for Montreal, Mumbai, Paris, Tokyo) and also holds for random growth, see Supplementary Figs. 5, 7, 8, 10. (C) We find mixed results for global efficiency: Mumbai and Montreal display a single jump, Tokyo is flat, while Boston and Paris shown an initial dip before increasing. Maps created with: https://github.com/mszell/bikenwgrowth (v.1.0.0).
Figure 6
Figure 6
Synthetic bicycle networks perform several times better than existing ones. (A) We plot the distributions (over cities) of the ratios Msyn/Mreal between network metrics of synthetic and existing topologies fixed at same length (Lsyn=Lreal), for betweenness growth and grid seeds (for all other growths see Supplementary Fig. 2). Synthetic networks have on average 5 times larger LCCs, 3 times the global efficiency, and higher local efficiency. Existing networks only tend to have better coverage because they are more scattered. (B) Illustration of high coverage (light blue area) due to extreme scattering and low length of LCC (dark blue sub-network) for Milan’s existing bicycle network, versus its synthetic version at same length (185km at qB=0.425). The LCC for synthetic Milan is the whole network. Maps created with: https://github.com/mszell/bikenwgrowth (v.1.0.0).
Figure 7
Figure 7
First stages of synthetic growth recreate existing networks. Shown are results for rail station seeds averaged over all cities. Same legend as Fig. 4. (A) Growth by betweenness starts with high, then decreasing overlap with existing protected bicycle infrastructure. Inset: The effect is especially strong in cities with well developed on-street bicycle networks such as Copenhagen. Here the growth algorithm starts with over 80% overlap. (B) Map of this high overlap in Copenhagen at the quantiles qB=0.05 and (C) qB=0.20. (D) The overlap with bikeable infrastructure has a notable effect only for growth by closeness due to traffic-calmed city centers: With increasing distance from the city center, overlap falls. Maps created with: https://github.com/mszell/bikenwgrowth (v.1.0.0).

References

    1. Banister D. Unsustainable Transport: City Transport in the New Century. Routledge; 2005.
    1. Nieuwenhuijsen MJ, Khreis H. Car free cities: Pathway to healthy urban living. Environ. Int. 2016;94:251–262. doi: 10.1016/j.envint.2016.05.032. - DOI - PubMed
    1. Alessandretti L, Aslak U, Lehmann S. The scales of human mobility. Nature. 2020;587:402–407. doi: 10.1038/s41586-020-2909-1. - DOI - PubMed
    1. Gössling S, Choi A, Dekker K, Metzler D. The social cost of automobility, cycling and walking in the European Union. Ecol. Econ. 2019;158:65–74. doi: 10.1016/j.ecolecon.2018.12.016. - DOI
    1. Gössling S. Why cities need to take road space from cars-and how this could be done. J. Urban Des. 2020;1:1–6.

Publication types