. 2022 Jun 27;189(3):1833-1847.
doi: 10.1093/plphys/kiac174.

Linker histone variant HIS1-3 and WRKY1 oppositely regulate salt stress tolerance in Arabidopsis

Affiliations

Linker histone variant HIS1-3 and WRKY1 oppositely regulate salt stress tolerance in Arabidopsis

Xi Wu et al. Plant Physiol. .

Abstract

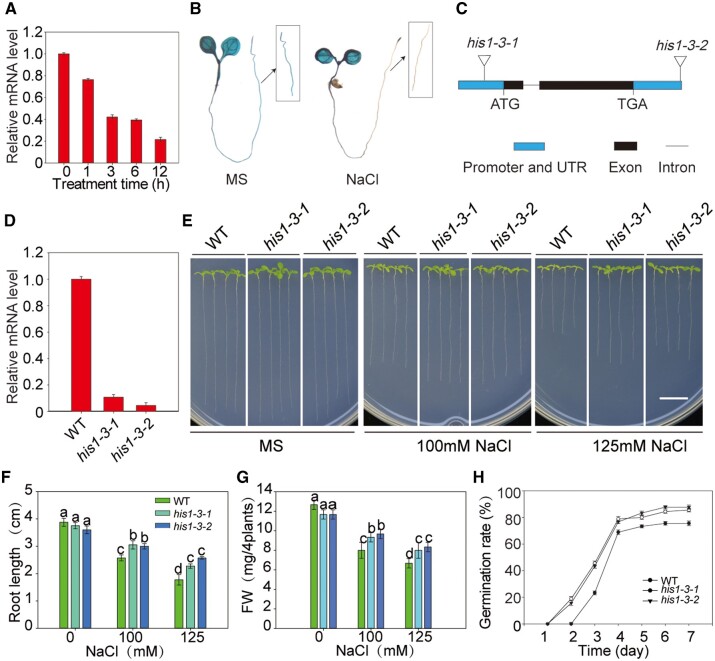
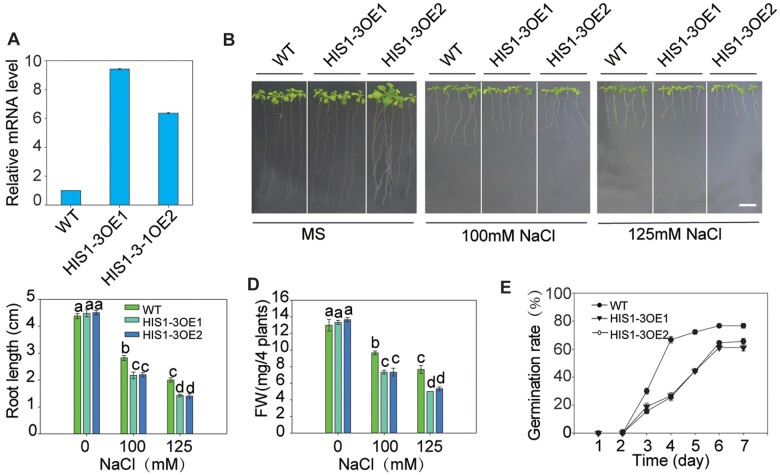
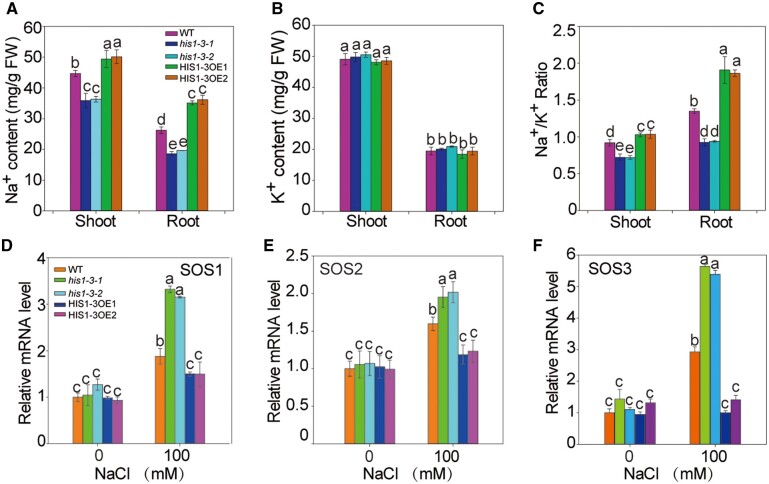
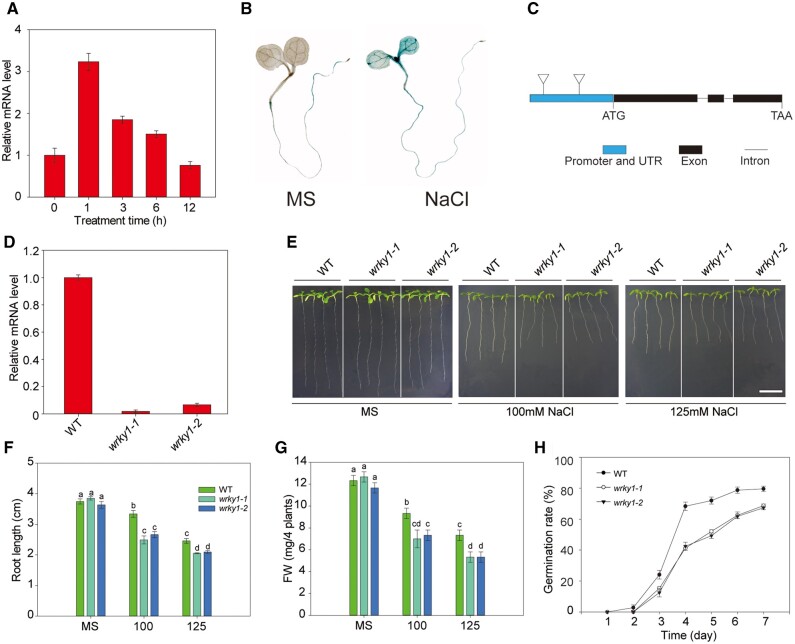
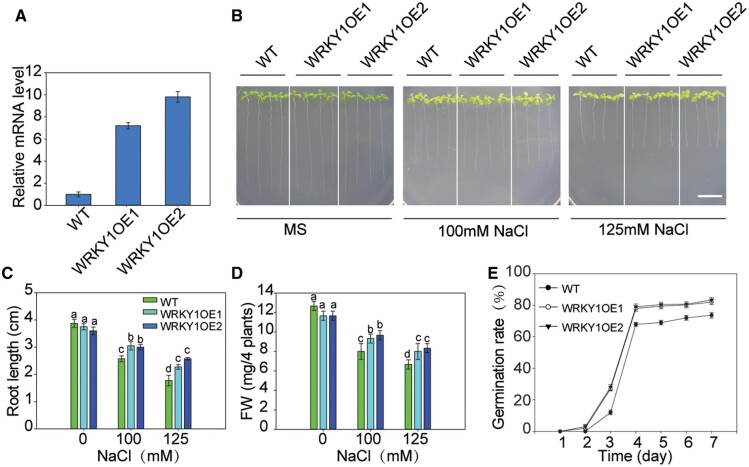
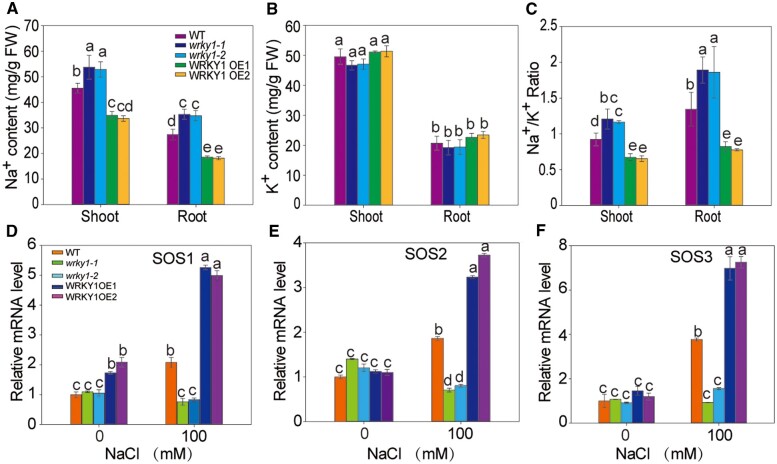
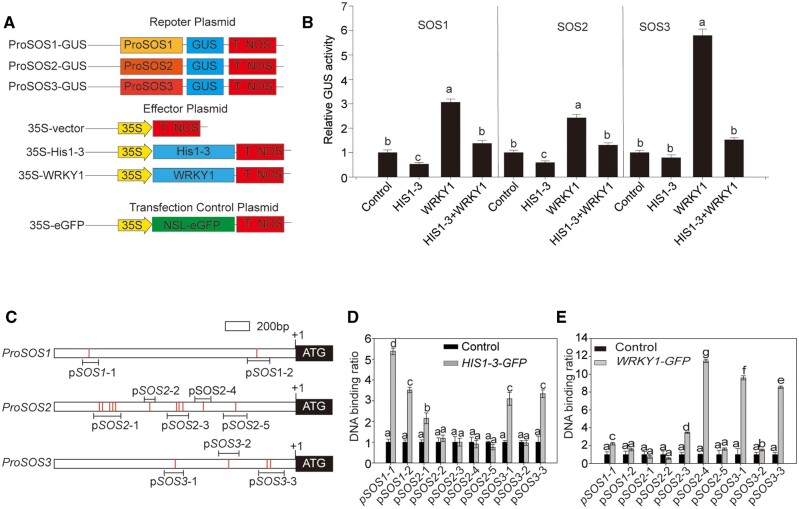
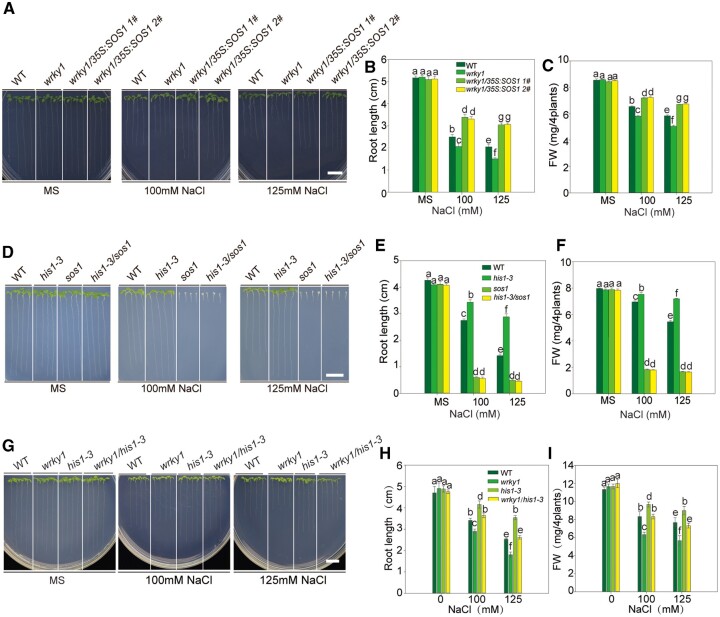
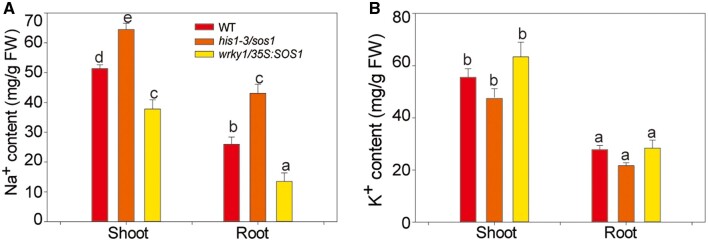
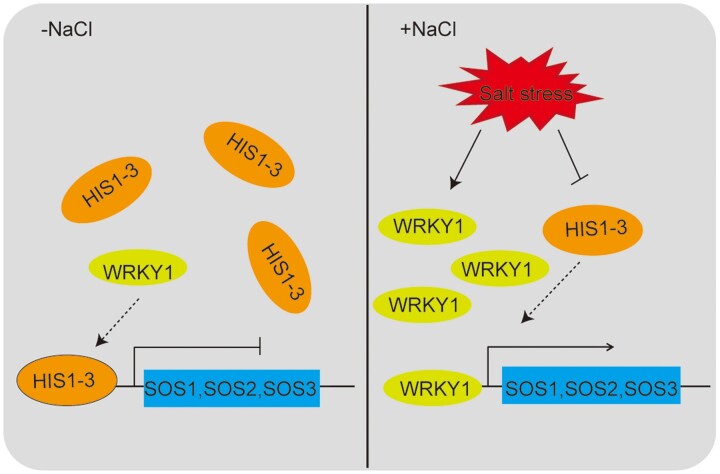
The salt overly sensitive (SOS) pathway plays an important role in plant salt stress; however, the transcriptional regulation of the genes in this pathway is unclear. In this study, we found that Linker histone variant HIS1-3 and WRKY1 oppositely regulate the salt stress response in Arabidopsis (Arabidopsis thaliana) through the transcriptional regulation of SOS genes. The expression of HIS1-3 was inhibited by salt stress, and the disruption of HIS1-3 resulted in enhanced salt tolerance. Conversely, the expression of WRKY1 was induced by salt stress, and the loss of WRKY1 function led to increased salt sensitivity. The expression of SOS1, SOS2, and SOS3 was repressed and induced by HIS1-3 and WRKY1, respectively, and HIS1-3 regulated the expression of SOS1 and SOS3 by occupying the WRKY1 binding sites on their promoters. Moreover, WRKY1 and HIS1-3 acted upstream of the SOS pathway. Together, our results indicate that HIS1-3 and WRKY1 oppositely modulate salt tolerance in Arabidopsis through transcriptional regulation of SOS genes.


Figures

Figure 1
Figure 1
Loss of function of HIS1-3 leads to enhanced salt tolerance. A, The effect of salt stress on HIS1-3 transcript levels were analyzed by RT-qPCR, with Actin8 as the internal control. Two-week-old WT seedlings were treated with NaCl for 0, 1, 3, 6, and 12 h. The vertical bars indicate the mean ± se of three biological replicates. B, GUS staining of 7-d-old ProHIS1-3::GUS seedlings treated with NaCl. Seven-day-old seedlings were treated with NaCl (100 mM) for 0 and 6 h and then stained with X-Gluc for 12 h at 37°C. C, The location of the T-DNA insertion in the HIS1-3 gene. Exons are shown as black boxes and introns are shown as lines. The triangle indicates the locations of the T-DNA insertion sites. D, The RT-qPCR analysis of the WT and his1-3 mutants. The Actin8 gene was amplified as an internal control. Similar results were obtained in at least three biological replicates. E, Salt tolerance assay of the WT and his1-3 mutants. The seedlings were grown on MS medium for 3 d and then transferred to MS medium with or without 100 or 125 mM of NaCl for 2 weeks. Bar = 1 cm. F and G, Root length (F) and fresh weight (G) of the plants described in (E). H, Germination rate of the WT and his1-3 mutants. The seedlings were grown on MS medium with NaCl and then counted at a fixed time every day. Data are presented as means ± se of three replicate experiments. Statistical significance was determined by Student’s t tests; significant differences (P < 0.05) are indicated by different lowercase letters.
Figure 2
Figure 2
HIS1-3-overexpressing plants show increased salt sensitivity. A, The RT-qPCR analysis of the WT and HIS1-3-overexpressing plants. The Actin8 gene was amplified as an internal control. Similar results were obtained in at least three biological replicates. B, Salt sensitivity assay of the WT and HIS1-3-OE seedlings. Three-day-old WT and HIS1-3-OE seedlings were transferred to MS medium with or without 100 mM or 125 mM of NaCl. Bar = 1 cm. C and D, Root length (C) and fresh weight (D) of the plants described in (B). E, Germination rate of the WT and HIS1-3-OE seedlings. The seedlings were grown on MS medium with NaCl and then counted at a fixed time every day. Data are presented as means ± se of three replicate experiments. Statistical significance was determined by Student’s t tests; significant differences (P < 0.05) are indicated by different lowercase letters.
Figure 3
Figure 3
HIS1-3 mediates Na+/K+ homeostasis via the SOS pathway. A and B, Na+ and K+ content in the shoots and roots of WT, his1-3 mutants, and HIS1-3-OE seedlings. The seedlings were treated with 100 mM of NaCl for 2 weeks, and then, the roots and shoots of these samples were collected. C, The Na+–K+ ratio was calculated from the Na+ and K+ content. D–F, Expression patterns of genes involved in the SOS pathway in the WT, his1-3 mutants, and HIS1-3-OE seedlings under salt stress. Using RT-qPCR, gene expression was compared between 2-week-old seedlings of WT, his1-3 mutants, and HIS1-3-OE seedlings after 0-h and 6-h treatment with 100 mM of NaCl. Actin8 was used as the internal control. All data shown here are presented as the means ± se of three replicate experiments. Statistical significance was determined using Student’s t tests; significant differences (P < 0.05) are indicated by different lowercase letters.
Figure 4
Figure 4
The wrky1 mutants are sensitive to salt stress. A, Effect of salt stress on WRKY1 transcript levels analyzed by RT-qPCR, with Actin8 as the internal control. Two-week-old WT seedlings were treated with NaCl for 0, 1, 3, 6, and 12 h. The vertical bars indicate the means ± se of three biological replicates. B, The GUS staining of 7-d-old ProWRKY1::GUS seedlings treated with NaCl for 6 h. The 7-d-old seedlings were treated with NaCl (100 mM) for 0 and 6 h and then stained with X-Gluc for 12 h at 37°C. C, The T-DNA insertion sites of the WRKY1 gene. Exons are shown as black boxes, and introns are shown as lines. The triangle indicates the locations of the T-DNA insertion sites. D, Transcription analysis of the WRKY1 gene in the wrky1-1 and wrky1-2 mutants by RT-qPCR. The Actin8 gene was amplified as an internal control. Similar results were obtained in at least three biological replicates. E, The WRKY1 loss-of-function mutation led to sensitivity to salt stress. Seedlings were grown on MS medium for 3 d and then treated with or without 100 or 125 mM of NaCl for 2 weeks. Bar = 1 cm. F and G, Measurements of the root length (F) and fresh weight (G) described in (E). H, Germination rate of the WT, wrky1-1, and wrky1-2 mutants grown in MS medium with NaCl and then counted at a fixed time every day. Data are presented as means ± se of three replicate experiments; statistical significance was determined by Student’s t tests; significant differences (P < 0.05) are indicated by different lowercase letters.
Figure 5
Figure 5
WRKY1 positively regulates salt tolerance. A, The expression of WRKY1 in the WT and WRKY1-overexpressing lines using RT-qPCR. Actin8 was used as the internal control. Data are presented as the means ± se of three replicate experiments. B, Growth of WT and WRKY1-overexpressing lines under salt stress. Seedlings were grown on MS medium for 3 d and then transferred to MS medium with or without 100 or 125 mM of NaCl for 2 weeks. Bar = 1 cm. C and D, Root length (C) and fresh weight (D) of plants described in (B). E, Germination rate of WT and WRKY1-overexpressing lines grown in MS medium with NaCl and then counted at a fixed time every day. These experiments were repeated 3 times with similar results, and the data are presented as the means ± se. Statistical significance was determined by Student’s t tests; significant differences (P < 0.05) are indicated by different lowercase letters.
Figure 6
Figure 6
WRKY1-mediated salt tolerance by mediating Na+/K+ homeostasis. A–B, The Na+ and K+ content in the shoots and roots of WT, wrky1 mutants, and WRKY1-OE seedlings. The seedlings were treated with 100 mM of NaCl for 2 weeks. The roots and shoots of these samples were collected. C, The Na+–K+ ratio of WT, wrky1 mutants, and WRKY1-OE seedlings was calculated from the Na+ and K+ content. D–F, Transcript levels of SOS1, SOS2, and SOS3 in the WT, wrky1 mutants, and WRKY1-OE seedlings under salt stress. Gene expression was compared by RT-qPCR among 2-week-old seedlings of WT, wrky1 mutants, and WRKY1-OE seedlings after 0- and 6-h treatment with 100 mM of NaCl. Actin8 was used as the internal control. All data shown here are presented as the means ± se of three replicate experiments. Statistical significance was determined using Student’s t tests; significant differences (P < 0.05) are indicated by different lowercase letters.
Figure 7
Figure 7
HIS1-3 and WRKY1 regulate three SOS genes by binding to their promoters. A, Schematics of all constructs used for transient expression assays in N. benthamiana leaves. The SOS1, SOS2, or SOS3 promoter was fused to the GUS reporter gene. 35S::HIS1-3 and 35S::WRKY1 acted as an effector. The 35S promoter was fused to the GFP gene as an internal control. B, Relative GUS activity showed the expressions of ProSOS1, ProSOS2, or ProSOS3 after co-expression with HIS1-3 and/or WRKY1. The constructs of ProSOS1:GUS, ProSOS2:GUS, or ProSOS3:GUS were co-transformed into N. benthamiana epidermal cells with 35S::HIS1-3 or 35S::WRKY1, and GUS activity was assessed at 48 h after injection using a MUG assay. The 35S-empty vector was used as an effector plasmid control. C, Schematic diagram of the SOS1, SOS2, and SOS3 promoters showing the W-box present in different regions. Bars indicate the W-box (TGAC); lines beneath the bars represent the sequences for ChIP assays. D and E, The direct binding of HIS1-3 and WRKY1 to the W-box of the SOS1, SOS2, and SOS3 promoters using ChIP-qPCR assay. The DNA binding ratio of the promoter regions of SOS1, SOS2, and SOS3 was confirmed by qPCR using the ChIP products from the WT HIS1-3-GFP or WRKY1-GFP. Input DNAs were used as the internal control. All data shown here are presented as the means ± se of three replicate experiments. Statistical significance was determined using Student’s t tests; significant differences (P < 0.05) are indicated by different lowercase letters.
Figure 8
Figure 8
Genetic interaction of HIS1-3 and WRKY1 with SOS1. A, Growth of the WT, wrky1, and wrky1/35S:SOS1 lines under salt stress. Seedlings were grown on MS medium for 3 d and then transferred to MS medium with or without 100 or 125 mM of NaCl for 2 weeks. Bar = 1 cm. B and C, Root length (B) and fresh weight (C) of the plants described in (A). D, Growth of the WT, his1-3, sos1, and his1-3/sos1 double mutants under salt stress. Seedlings were grown on MS medium for 3 d and then transferred to MS medium with or without 100 or 125 mM of NaCl for 2 weeks. Bar = 1 cm. E and F, Root length (E) and fresh weight (F) of the plants described in (D). G, Growth of WT, wrky1, his1-3, and wrky1/his1-3 lines under salt stress. Seedlings were grown on MS medium for 3 d and then transferred to MS medium with or without 100 or 125 mM of NaCl for 2 weeks. Bar = 1 cm. H and I, Root length (G) and fresh weight (I) of the plants described in (G). These experiments were repeated 3 times with similar results, and data are presented as the means ± se. Statistical significance was determined by Student’s t tests; significant differences (P < 0.05) are indicated by different lowercase letters.
Figure 9
Figure 9
The Na+ and K+ content in the shoots and roots of WT, his1-3/sos1, and wrky1/35S:SOS1 mutants. A, The Na+ content in the shoots and roots of the WT, his1-3/sos1, and wrky1/35S:SOS1 mutants. B, The K+ content in the shoots and roots of the WT, his1-3/sos1, and wrky1/35S:SOS1 mutants. The seedlings were treated with 100 mM of NaCl for 2 weeks. The roots and shoots of these samples were collected. All data shown here are presented as the means ± se of three replicate experiments. Statistical significance was determined using Student’s t tests; significant differences (P < 0.05) are indicated by different lowercase letters.
Figure 10
Figure 10
A working model for the regulation of salt stress in Arabidopsis by HIS1-3 and WRKY1. HIS1-3 is a negative regulator under salt stress. It inhibits the expression of SOS1, SOS2, and SOS3 by binding to the W-boxes of the SOS1, SOS2, and SOS3 promoter sequences under conditions of no stress, which are also the binding sites of WRKY1 on these genes. Once plants are subjected to salt stress, the expression of HIS1-3 is decreased, leading to the exposure of the W-boxes of SOS1, SOS2, and SOS3. Subsequently, the WRKY1 protein activates the expression of these genes and regulates the Na+/K+ balance in the plant in order to respond to salt stress.

Similar articles

Cited by

References

    1. Agarwal P, Reddy MP, Chikara J (2011) WRKY: its structure, evolutionary relationship, DNA-binding selectivity, role in stress tolerance and development of plants. Mol Biol Rep 38: 3883–3896 - PubMed
    1. Agarwal PK, Shukla PS, Gupta K, Jha B (2013) Bioengineering for salinity tolerance in plants: state of the art. Mol Biotechnol 54: 102–123 - PubMed
    1. Arbona V, Manzi M, de Ollas C, Gomez-Cadenas A (2013) Metabolomics as a tool to investigate abiotic stress tolerance in plants. Int J Mol Sci 14: 4885–4911 - PMC - PubMed
    1. Ascenzi R, Gantt JS (1997) A drought-stress-inducible histone gene in Arabidopsis thaliana is a member of a distinct class of plant linker histone variants. Plant Mol Biol 34: 629–641 - PubMed
    1. Ascenzi R, Gantt JS (1999) Molecular genetic analysis of the drought-inducible linker histone variant in Arabidopsis thaliana. Plant Mol Biol 41: 159–169 - PubMed

MeSH terms

LinkOut - more resources