. 2022 Apr 26;12(1):5966.
doi: 10.1038/s41598-022-10070-w.

Online misinformation is linked to early COVID-19 vaccination hesitancy and refusal

Affiliations

Online misinformation is linked to early COVID-19 vaccination hesitancy and refusal

Francesco Pierri et al. Sci Rep. .

Abstract

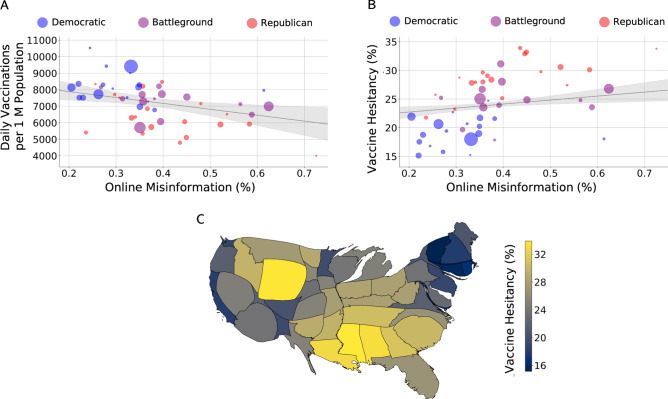
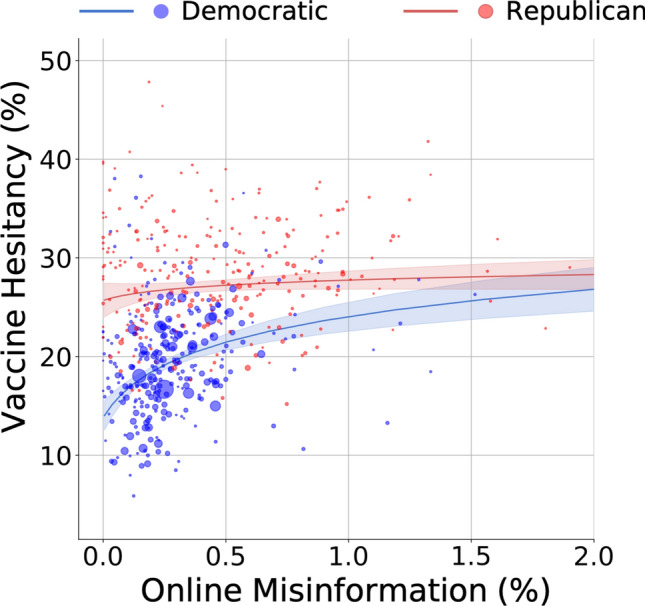
Widespread uptake of vaccines is necessary to achieve herd immunity. However, uptake rates have varied across U.S. states during the first six months of the COVID-19 vaccination program. Misbeliefs may play an important role in vaccine hesitancy, and there is a need to understand relationships between misinformation, beliefs, behaviors, and health outcomes. Here we investigate the extent to which COVID-19 vaccination rates and vaccine hesitancy are associated with levels of online misinformation about vaccines. We also look for evidence of directionality from online misinformation to vaccine hesitancy. We find a negative relationship between misinformation and vaccination uptake rates. Online misinformation is also correlated with vaccine hesitancy rates taken from survey data. Associations between vaccine outcomes and misinformation remain significant when accounting for political as well as demographic and socioeconomic factors. While vaccine hesitancy is strongly associated with Republican vote share, we observe that the effect of online misinformation on hesitancy is strongest across Democratic rather than Republican counties. Granger causality analysis shows evidence for a directional relationship from online misinformation to vaccine hesitancy. Our results support a need for interventions that address misbeliefs, allowing individuals to make better-informed health decisions.


Conflict of interest statement

The authors declare no competing interests.

Figures

Figure 1
Figure 1
Online misinformation is associated with vaccination uptake and hesitancy at the state level. (A) State-level mean daily vaccinations per million population during the period from March 19 to 25, 2021, against the average proportion of vaccine misinformation tweets shared by geolocated users on Twitter during the period from January 4 to March 25, 2021. (B) Levels of state-wide vaccine hesitancy, computed as the fraction of individuals who would not get vaccinated according to Facebook daily surveys administered in the period from January 4 to March 25, 2021, and misinformation about vaccines shared on Twitter. Each dot represents a U.S. state and is colored according to the share of Republican voters (battleground states have a share between 45 and 55%) and sized according to population. Grey lines show the partial correlation between the two variables after adjusting for socioeconomic, demographic, and political factors in a weighted multiple linear regression model (shaded areas correspond to 95% C.I.). (C) Cartogram of the U.S. in which the area of each state is proportional to the average number of misinformation links shared by geolocated users, and the color is mapped to the vaccine hesitancy rate, with lighter colors corresponding to higher hesitancy (image generated by https://go-cart.io under CC-BY license).
Figure 2
Figure 2
Associations of online misinformation and political partisanship with vaccination hesitancy at the U.S. county level. Each dot represents a U.S. county, with size and color indicating population size and political majority, respectively. The average proportion of misinformation shared on Twitter by geolocated users was fitted on a log scale due to non-normality (i.e., positive skew) at the county level. The two lines show predicted values of vaccine hesitancy as a function of misinformation for majority Democratic and Republican counties, adjusting for county-level confounding factors (see Methods). Shaded area corresponds to 95% C.I.
Figure 3
Figure 3
Top low-credibility sources. We considered tweets shared by users geolocated in the U.S. that link to a low-credibility source. Sources are ranked by percentage of the tweets considered.

Similar articles

Cited by

References

    1. “WHO Coronavirus (COVID-19) Dashboard,” 2021. https://covid19.who.int. Accessed Apr. 19, 2021.
    1. Orenstein WA, Ahmed R. Simply put: Vaccination saves lives. Proc. Natl. Acad. Sci. 2017;114(16):4031–4033. doi: 10.1073/pnas.1704507114. - DOI - PMC - PubMed
    1. Kim JH, Marks F, Clemens JD. Looking beyond COVID-19 vaccine phase 3 trials. Nat. Med. 2021 doi: 10.1038/s41591-021-01230-y. - DOI - PubMed
    1. “KFF COVID-19 Vaccine Monitor Dashboard,” KFF, Feb. 26, 2021. https://www.kff.org/coronavirus-covid-19/dashboard/kff-covid-19-vaccine-... Accessed Apr. 07, 2021.
    1. C. Funk and A. Tyson, “Growing Share of Americans Say They Plan To Get a COVID-19 Vaccine – or Already Have,” Pew Research Center Science & Society, Mar. 05, 2021. https://www.pewresearch.org/science/2021/03/05/growing-share-of-american... Accessed Apr. 14, 2021.

Publication types