

Cross-vender, cross-tracer, and cross-protocol deep transfer learning for attenuation map generation of cardiac SPECT
- PMID: 35474443
- PMCID: PMC11407548
- DOI: 10.1007/s12350-022-02978-7
Cross-vender, cross-tracer, and cross-protocol deep transfer learning for attenuation map generation of cardiac SPECT
Abstract
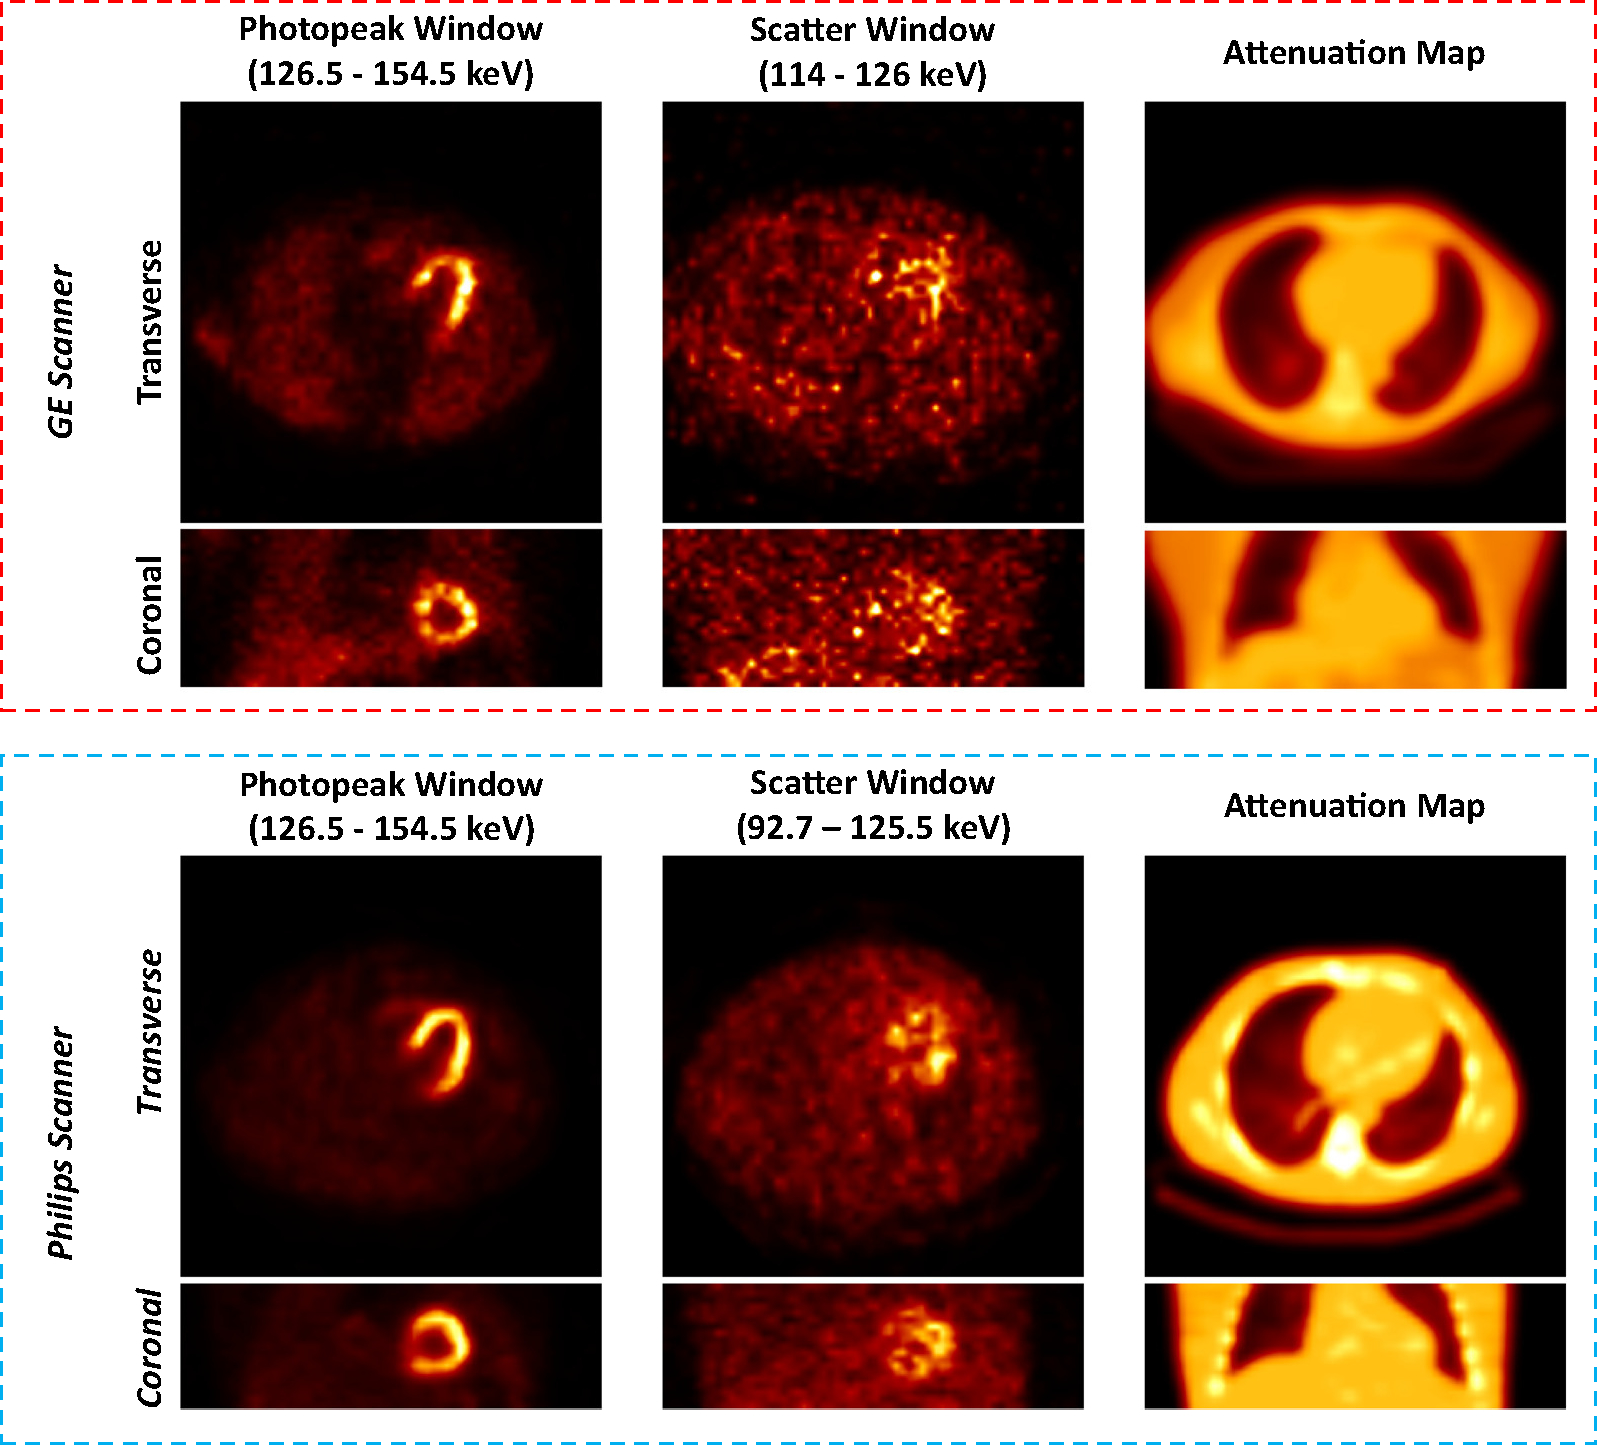
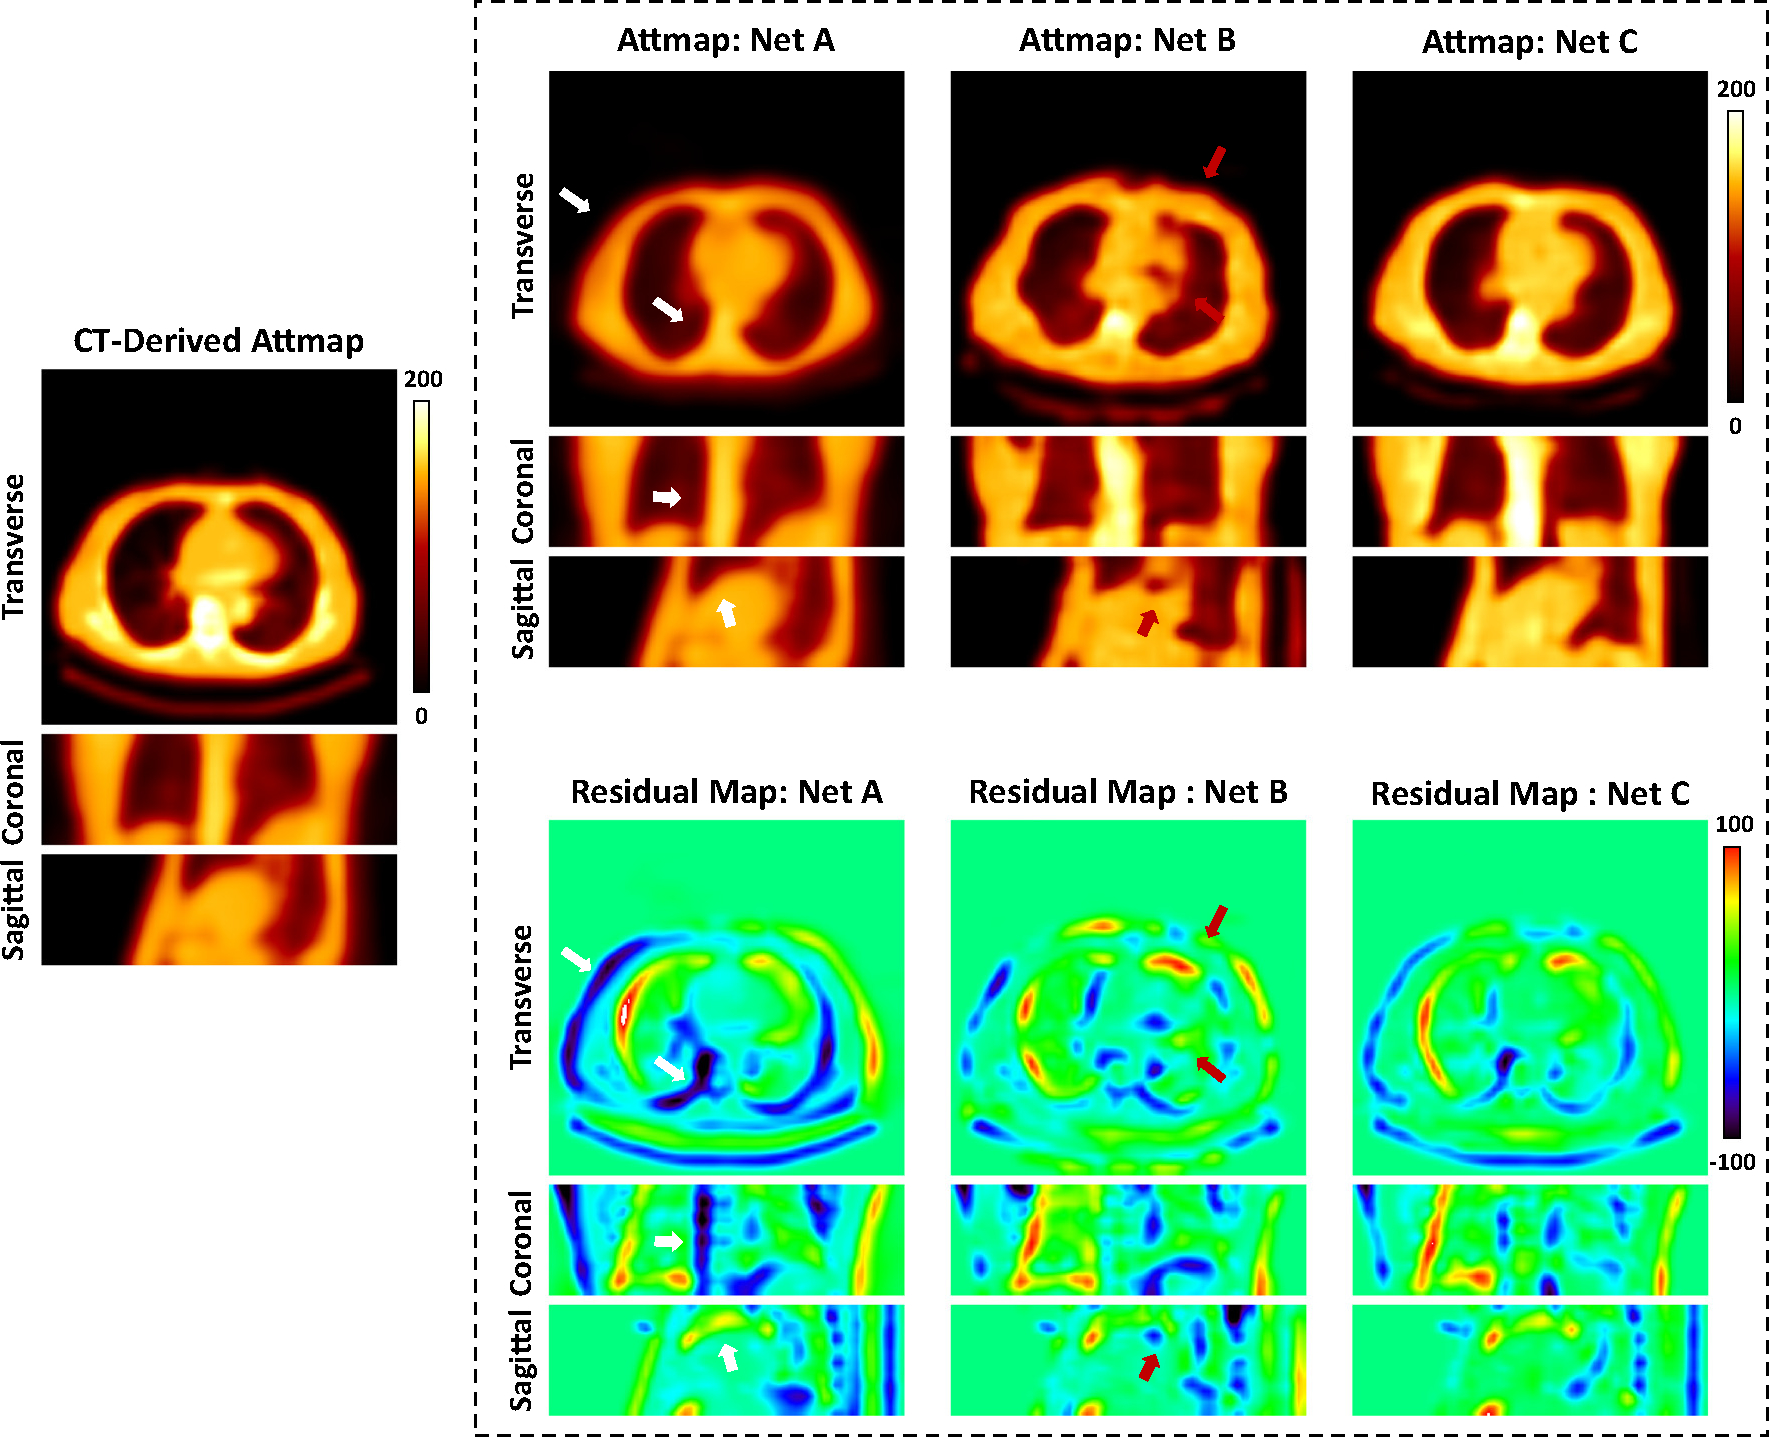
It has been proved feasible to generate attenuation maps (μ-maps) from cardiac SPECT using deep learning. However, this assumed that the training and testing datasets were acquired using the same scanner, tracer, and protocol. We investigated a robust generation of CT-derived μ-maps from cardiac SPECT acquired by different scanners, tracers, and protocols from the training data. We first pre-trained a network using 120 studies injected with 99mTc-tetrofosmin acquired from a GE 850 SPECT/CT with 360-degree gantry rotation, which was then fine-tuned and tested using 80 studies injected with 99mTc-sestamibi acquired from a Philips BrightView SPECT/CT with 180-degree gantry rotation. The error between ground-truth and predicted μ-maps by transfer learning was 5.13 ± 7.02%, as compared to 8.24 ± 5.01% by direct transition without fine-tuning and 6.45 ± 5.75% by limited-sample training. The error between ground-truth and reconstructed images with predicted μ-maps by transfer learning was 1.11 ± 1.57%, as compared to 1.72 ± 1.63% by direct transition and 1.68 ± 1.21% by limited-sample training. It is feasible to apply a network pre-trained by a large amount of data from one scanner to data acquired by another scanner using different tracers and protocols, with proper transfer learning.
Keywords: Attenuation map generation; SPECT/CT; myocardial perfusion imaging; transfer learning.
© 2022. The Author(s) under exclusive licence to American Society of Nuclear Cardiology.
Conflict of interest statement
Disclosure
No potential conflicts of interest relevant to this article exist.
Figures


References
-
- Gimelli A, Rossi G, Landi P, Marzullo P, Iervasi G, L’abbate A, et al. Stress/rest myocardial perfusion abnormalities by gated SPECT: still the best predictor of cardiac events in stable ischemic heart disease. J Nucl Med 2009;50:546–53. - PubMed
-
- Nishimura T, Nakajima K, Kusuoka H, Yamashina A, Nishimura S. Prognostic study of risk stratification among Japanese patients with ischemic heart disease using gated myocardial perfusion SPECT: J-ACCESS study. Eur J Nucl Med Mol Imaging 2008;35:319–28. - PubMed
-
- Patton JA, Turkington TG. SPECT/CT physical principles and attenuation correction. J Nucl Med Technol 2008;36:1–10. - PubMed
-
- Tavakoli M, Naij M. Quantitative evaluation of the effect of attenuation correction in SPECT images with CT-derived attenuation. Med Imaging 2019;109485U.
Publication types
MeSH terms
Substances
Grants and funding
LinkOut - more resources
Full Text Sources
Other Literature Sources
Research Materials
