. 2021 Sep 16;1(5):100084.
doi: 10.1016/j.crmeth.2021.100084. eCollection 2021 Sep 27.

Systematic discovery and validation of T cell targets directed against oncogenic KRAS mutations

Affiliations

Systematic discovery and validation of T cell targets directed against oncogenic KRAS mutations

Jaewon Choi et al. Cell Rep Methods. .

Abstract

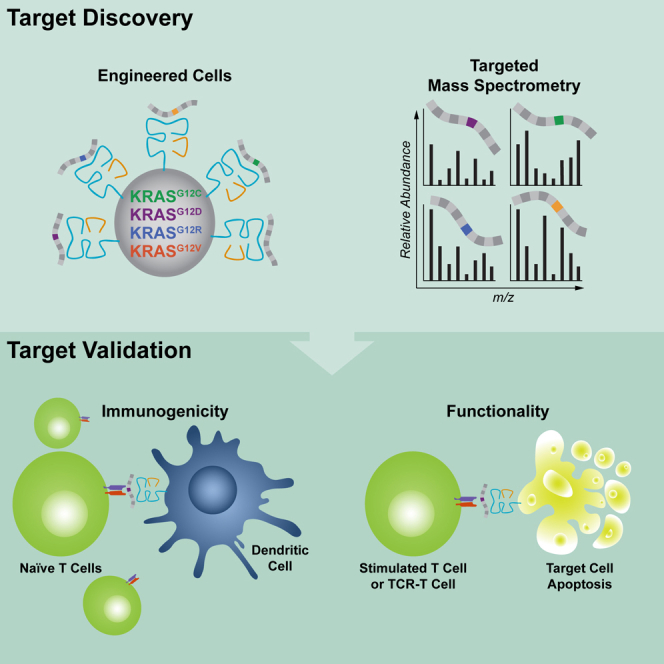
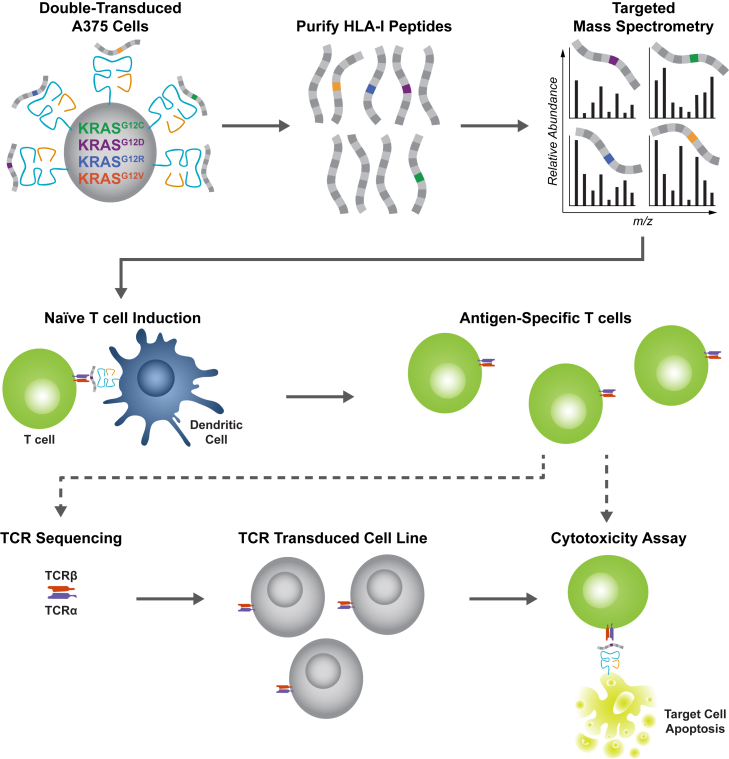
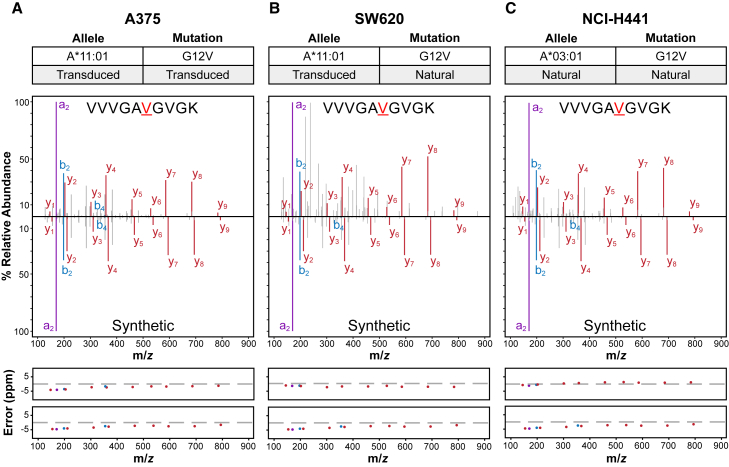
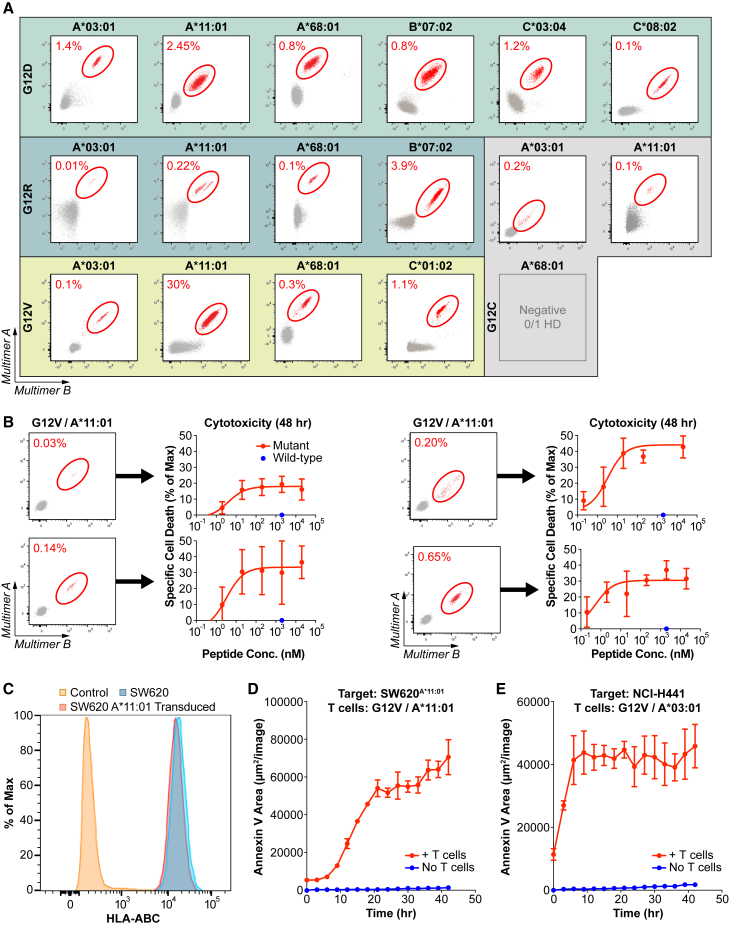
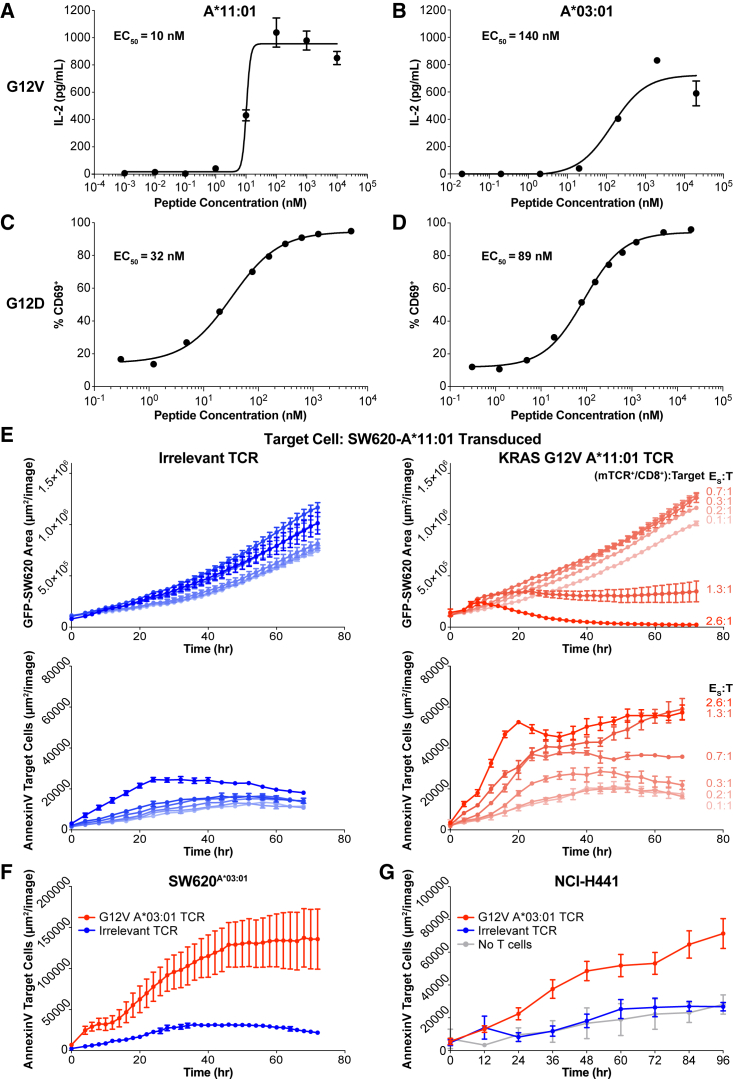
Oncogenic mutations in KRAS can be recognized by T cells on specific class I human leukocyte antigen (HLA-I) molecules, leading to tumor control. To date, the discovery of T cell targets from KRAS mutations has relied on occasional T cell responses in patient samples or the use of transgenic mice. To overcome these limitations, we have developed a systematic target discovery and validation pipeline. We evaluate the presentation of mutant KRAS peptides on individual HLA-I molecules using targeted mass spectrometry and identify 13 unpublished KRASG12C/D/R/V mutation/HLA-I pairs and nine previously described pairs. We assess immunogenicity, generating T cell responses to nearly all targets. Using cytotoxicity assays, we demonstrate that KRAS-specific T cells and T cell receptors specifically recognize endogenous KRAS mutations. The discovery and validation of T cell targets from KRAS mutations demonstrate the potential for this pipeline to aid the development of immunotherapies for important cancer targets.

Keywords: HLA; PRM; RAS; T cell; TCR; cancer; immunotherapy; mass spectrometry; neoantigen.


Conflict of interest statement

J.C., S.P.G., B.P.C., J.L.D., J.K., D.L., D.A.R., P.J.T., J.R.S., K.C.F., M.S.R., M.M.v.B., R.B.G., T.A.A., and V.R.J. are employees and shareholders of BioNTech SE. C.D.McG., A.B., and J.G.A. are former employees of Neon Therapeutics (acquired by BioNTech SE). C.D.McG. is a graduate student at the University of Washington. A.B. is an employee and shareholder of TScan Therapeutics. J.G.A. is an employee of the Broad Institute of MIT and Harvard. R.B.G. is a member of the board of directors at Alkermes plc and Infinity Pharmaceuticals, and a member of the scientific advisory board at Leap Therapeutics.

Figures

None
Graphical abstract
Figure 1
Figure 1
Establishment of a pipeline to discover and validate KRAS neoantigens Overview of the cell-based systematic pipeline established to discover and validate KRAS neoantigens using targeted MS (top) and an in vitro T cell stimulation protocol (middle). A375 cells were engineered to simultaneously express four KRASG12C/D/R/V mutations and an HLA-I molecule of interest. After purifying HLA-I peptides, targeted MS was used to detect individual KRAS neoantigens (lines with a colored box) in the presence of endogenous peptides that are also presented by the transduced HLA-I molecules (gray lines). An in vitro stimulation protocol was used to elicit naive T cell responses against the detected KRAS neoantigens. For a subset of the detected neoantigens (dashed arrows represent expanded pipeline), a cytotoxicity assay was performed to show that induced T cells can kill tumor cell lines that naturally express the KRASG12V mutation. Cytotoxicity assays were also used to demonstrate that cloned TCRs can kill tumor cells that naturally present the KRASG12V neoantigen.
Figure 2
Figure 2
Representative targeted MS data Targeted MS was used to detect the 10mer KRASG12V HLA-A3 superfamily neoantigen VVVGAVGVGK in (A) A375 cells engineered to express both the KRASG12V mutation and HLA-A∗11:01, (B) SW620 cells that naturally express the KRASG12V mutation but were engineered to express HLA-A∗11:01, and (C) NCI-H441 cells that naturally express both the KRASG12V mutation and HLA-A∗03:01. The top panels specify the KRAS mutation and HLA-I molecule present in each sample. The middle panels contain the mass spectra for the peptide detected in each sample (top), and the mass spectra for the heavy isotope-labeled synthetic peptide (bottom) used to confirm the detections. The bottom panels show mass error in parts per million (ppm) of the a-ions (purple), b-ions (blue), and y-ions (red) for the endogenous (top) and heavy isotope-labeled synthetic (bottom) mass spectra. Data from the same heavy isotope-labeled synthetic peptide was used in this figure. See also Data S2.
Figure 3
Figure 3
Evaluation of KRAS neoantigen immunogenicity in healthy donors (A) Flow cytometry plots of pHLA staining of KRAS neoantigens after naive T cell inductions in healthy donors with the appropriate HLA-I molecules. Multimer-positive populations are circled in red. Naive T cell inductions and multimer analysis were performed for all neoantigens detected by MS, except for KRASG12C on HLA-A∗68:01. See also Figure S3. (B) Cytotoxicity assay evaluating the specificity of multiple independent T cell cultures stimulated against KRASG12V on HLA-A∗11:01. T cell cultures with identifiable multimer-positive populations (left) were co-cultured with A375 cells transduced to express HLA-A∗11:01 and loaded with increasing amounts of the KRASG12V/HLA-A∗11:01 neoantigens (red dots) or a single concentration of the matching wild-type peptides (blue dots). Data are presented as mean ± SD. (C–E) Cytotoxicity assay evaluating the ability of a representative T cell culture to recognize endogenously processed and presented KRASG12V neoantigens. (C) Total HLA-I expression was evaluated on SW620 cells transduced to express HLA-A∗11:01 (red) compared with non-transduced SW620 cells (blue) or isotype control-stained cells (orange). See also Figure S1. (D and E) Cytotoxicity assays used to evaluate the ability of representative T cell cultures to recognize endogenously processed and presented KRASG12V neoantigens where (D) T cells were co-cultured with SW620A∗11:01 cells and annexin V was measured over time (red) compared with SW620A∗11:01 cells alone (blue) and (E) T cells were co-cultured with NCI-H441 cells, and annexin V was measured over time (red) compared with NCI-H441 cells alone (blue). Data are presented as mean ± SD and are representative of two independent experiments. See also Figure S4.
Figure 4
Figure 4
Characterization of KRAS-specific TCRs on common alleles (A–D) TCRs isolated from healthy donor T cells stimulated against different KRAS neoantigens were transduced into JurkatCD8 cells. TCR avidity was evaluated by titration of each cognate peptide presented on A375 cells transduced to express the cognate HLA-I molecule. TCR stimulation was assessed by IL-2 secretion or CD69 expression, and half-maximal effective concentration was calculated. (A) TCR specific for KRASG12V on HLA-A∗11:01. (B) TCR specific for KRASG12V on HLA-A∗03:01. (C) TCR specific for KRASG12D on HLA-A∗11:01. (D) TCR specific for KRASG12D on HLA-A∗03:01. Data are presented as mean ± SD and are representative of at least two independent experiments. See also Figure S5. (E) The TCR from (A) was transduced into PBMCs and used in a cytotoxicity assay against SW620A∗11:01 across a range of specific effector to target (E:T) ratios (red). The ratio was calculated using the number of TCR-transduced CD8+ T cells in the well. As a control, an equivalent number of PBMCs transduced with an irrelevant TCR was co-cultured with SW620A11:01 cells (blue). Both target cell growth (top) and target cell death (bottom) were measured. Data are presented as mean ± SD and are representative of three independent experiments. (F) The TCR from (B) was transduced into PBMCs and used in a cytotoxicity assay against SW620A∗03:01 (red), and cell death of the target cell was measured. As a negative control, PBMCs transduced with the TCR from (A) were co-cultured with SW620A∗03:01 (blue). Data are presented as mean ± SD and are representative of two independent experiments. (G) The TCR from (B) was transduced into PBMCs and used in a cytotoxicity assay against NCI-H441 (red), and cell death of the target cell was measured. As a negative control, PBMCs transduced with the TCR from (A) were co-cultured with NCI-H441 (blue). Data are presented as mean ± SD and are representative of two independent experiments.

References

    1. Abelin J.G., Harjanto D., Malloy M., Suri P., Colson T., Goulding S.P., Creech A.L., Serrano L.R., Nasir G., Nasrullah Y., et al. Defining HLA-II ligand processing and binding rules with mass spectrometry enhances cancer epitope prediction. Immunity. 2019;51:766–779.e17. - PubMed
    1. Ali M., Foldvari Z., Giannakopoulou E., Böschen M.-L., Strønen E., Yang W., Toebes M., Schubert B., Kohlbacher O., Schumacher T.N., et al. Induction of neoantigen-reactive T cells from healthy donors. Nat. Protoc. 2019;14:1926–1943. - PubMed
    1. Bai P., Zhou Q., Wei P., Bai H., Chan S.K., Kappler J.W., Marrack P., Yin L. Rational discovery of a cancer neoepitope harboring the KRAS G12D driver mutation. Sci. China Life Sci. 2021 doi: 10.1007/s11427-020-1888-1. Published online March 16, 2021. - DOI - PubMed
    1. Bar-Sagi D., Knelson E.H., Sequist L.V. A bright future for KRAS inhibitors. Nat. Cancer. 2020;1:25–27. - PubMed
    1. Bear A.S., Blanchard T., Cesare J., Ford M.J., Richman L.P., Xu C., Baroja M.L., McCuaig S., Costeas C., Gabunia K., et al. Biochemical and functional characterization of mutant KRAS epitopes validates this oncoprotein for immunological targeting. Nat. Commun. 2021;12:4365. - PMC - PubMed

Substances