. 2021 Apr 30;1(1):100009.
doi: 10.1016/j.crmeth.2021.100009. eCollection 2021 May 24.

Super-resolved live-cell imaging using random illumination microscopy

Affiliations

Super-resolved live-cell imaging using random illumination microscopy

Thomas Mangeat et al. Cell Rep Methods. .

Abstract

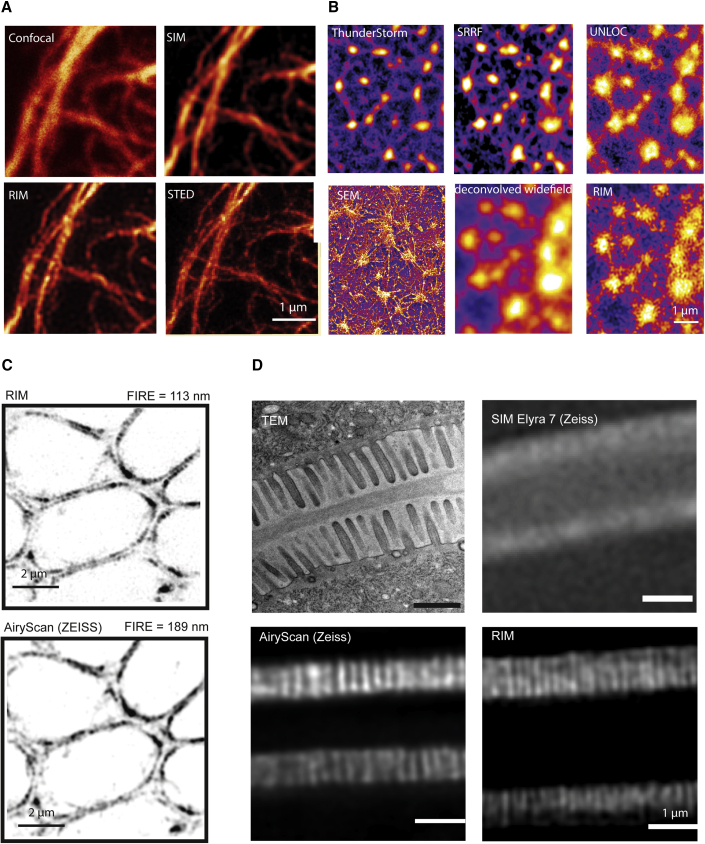
Current super-resolution microscopy (SRM) methods suffer from an intrinsic complexity that might curtail their routine use in cell biology. We describe here random illumination microscopy (RIM) for live-cell imaging at super-resolutions matching that of 3D structured illumination microscopy, in a robust fashion. Based on speckled illumination and statistical image reconstruction, easy to implement and user-friendly, RIM is unaffected by optical aberrations on the excitation side, linear to brightness, and compatible with multicolor live-cell imaging over extended periods of time. We illustrate the potential of RIM on diverse biological applications, from the mobility of proliferating cell nuclear antigen (PCNA) in U2OS cells and kinetochore dynamics in mitotic S. pombe cells to the 3D motion of myosin minifilaments deep inside Drosophila tissues. RIM's inherent simplicity and extended biological applicability, particularly for imaging at increased depths, could help make SRM accessible to biology laboratories.

Keywords: aberration; computational imaging; fluorescence; live imaging; microscopy; speckle; super-resolution; variance.


Conflict of interest statement

The authors declare no competing interests. AlgoRIM described herein has been filed by S.L., T.M., J.I., M.A., and A.S. on April 30, 2020, at the Agence de Protection des Programmes under the number: IDDN.FR.001.180008.000.S.P.2020.000.00000.

Figures

None
Graphical abstract
Figure 1
Figure 1
RIM principle and performances (A and B) RIM setup and data processing. (A) RIM implementation. A binary phase spatial light modulator (SLM) acting as a diffuser is implemented in a classical inverted microscope. Illuminated by multicolor lasers, the SLM sends hundreds of different speckle patterns per second onto the specimen. The fluorescence light is collected onto one or two sCMOS cameras after appropriate filtering. The same setup is operational for different objectives with numerical apertures between 0.15 and 1.49, and for wavelengths in the range of 400 to 600 nm. (B) RIM data processing, algoRIM. Multiple raw images of the sample are recorded under different speckled illuminations and filtered with a Tikhonov regularized inverse filter before forming their variance. The variance-matching process estimates the fluorescence density iteratively by minimizing the distance between the measured variance and the variance model. It significantly improves the resolution of the square root of the measured variance (standard deviation, SOFI speckle). (C and D) RIM resolution. (C) RIM reconstruction of a calibrated sample (ARGO-SIM slide, Argolight) with an objective of NA = 1.49 and excitation wavelength of 405 nm. The interdistances between the two center lines from left to right are 180–150–120–90–60 nm. Top panel: deconvolved widefield microscopy. Bottom panel: RIM reconstruction. RIM is able to distinguish two lines separated by 90 nm and the resolution estimated by FIRE (Nieuwenhuizen et al., 2013) is 76 nm. For comparison, RIM theoretical resolution, given by one-fourth of the emission wavelength (420 nm) divided by NA, is 70 nm. Eight hundred speckled images were used in this reconstruction but the 90 nm lines were resolved with as few as 25 speckled images. See Figure S1C for an analysis of the noise on the reconstruction as a function of the number of speckled images. (D) Two-color RIM image of calibrated DNA nanorulers (SIM 140 YBY), where two red fluorophores (Alexa 561) attached to the DNA ends are separated by 140 nm, and are equidistant (70 nm) to a green fluorophore (Alexa 488). The green and red reconstructed fluorescence density profiles are plotted for 20 different nanorulers. The bold lines indicate the mean profiles. RIM estimated the red-to-green distance to about 70 nm using a co-location analysis. The RIM profiles are similar to those obtained using SIM, see Figure S2A and the STAR Methods. (E and F) Robustness to aberrations. (E) Imaging of DNA nanorulers using a defective objective (NA = 1.2) without aberration (left) at the center of the field of view and with strong aberrations (right) at the edge of the field of view. Top: speckle intensity obtained after reflection from the slide by removing the fluorescence filter. The speckle statistics are similar in the aberrated and non-aberrated configurations. Middle: observation PSF estimated from 200 nm beads at the center (left) and the edge (right) of the field of view (Debarnot et al., 2020; STAR Methods). The full width at half maximum (FWHM) of the PSF is estimated to be 375 nm in the non aberrated conditions and 1,025 nm along its longest dimension in the aberrated conditions. Bottom: RIM reconstruction of the same sample of DNA nanorulers (GATTA-confocal 270) consisting of two fluorophores separated by 270 nm translated from the center (left) to the edge (right) of the field of view. When the observation PSF is accurately estimated, the reconstructions are similar in the aberrated and non aberrated configurations. (F) RIM imaging of the RFP-tagged myosin II motor protein at different depths inside a fixed Drosophila melanogaster pupa leg (NA = 1.35). Top left: cartoon showing the assembly of myosin II into a 300 nm long minifilament tagged at both ends (Hu et al., 2017) and the sagittal cut of the Drosophila leg. About ten isolated myosin II minifilaments, appearing as characteristic fluorescent doublets (shown in the bottom panels), are observed at 0.5, 5, 30, and 100 μm from the slide. Top right: intensity profiles along the filaments observed at each depth and their average. The colors refer to the depths indicated by the arrows. RIM estimated the doublet lengths to about 300 nm whatever the depths, with the FWHM of myosin heads varying from about 120 to 190 nm at 0.5 and 100 μm depth, respectively. (G–I) 3D imaging. (G) Comparison of widefield and RIM images of green-fluorescent beads (nominal diameter 100 nm), NA = 1.49. Top: transverse (left) and axial (right) views of the beads with widefield microscopy. Middle: same with RIM. Bottom: Fourier transforms of the widefield (pink) and RIM (green) transverse and axial views of the beads. In addition to the filling of the missing cone, the spatial frequencies cut-offs of RIM were about twice larger than that of widefield microscopy in all directions. The beads FWHM were estimated to 112 ± 16 nm transversally and 320 ± 16 nm axially for RIM and 208 ± 16 nm and 512 ± 64 nm, respectively, for the widefield (10 beads, 800 speckled illuminations). (H) RIM 3D imaging of myosin II minifilaments 6 μm deep, inside a live developing Drosophila leg, NA = 1.4. The 3D image is a magnification (using a bicubic interpolation) extracted from Video S2, part 3 and Figure S1E. It shows the ability of RIM to distinguish the fluorescent doublet whatever its orientation in the (x,z) plane. The FIRE resolution in the transverse plane was 120 nm. The fluorophores FWHM in the axial direction was 300 ± 60 nm. (I) Axial and transverse cuts of 3D RIM images of Z-rings from live S. pneumoniae containing FtsZ tagged with mEos3.2 taken at different stages of cell division; NA = 1.49. Early (left) and late (middle) FtsZ annular constrictions from two dividing cells are shown in the axial cut. Right, transverse cut at the equatorial plane of the Z-rings of two attached daughter cells (late division stage). The FIRE resolution in the transverse plane was 105 nm. The FWHM of the ring along the axial direction was estimated to be 280 ± 25 nm. In (H) and (I) the displacement of the z-stage has been corrected by a factor of 0.8 (H) and 0.66 (I) to account for the focal shift due to the refractive index mismatch between the oil objective and the aqueous mounting medium (STAR Methods).
Figure 2
Figure 2
Comparison of RIM with competing super-resolution microscopy techniques (A) We imaged the same vimentin network from fixed HUVEC cell with, successively, 2D SIM, RIM, confocal, and 2D-STED, using a fluorescent antibody dedicated to STED microscopy with excitation at 561 nm and emission at 700 nm (large Stokes shift), NA = 1.4. The RIM image was very close to the 2D-STED image (RIM resolution even matched that of 3D-STED on a 3D sample of vimentin filaments, Figures S2C and S2D) and was better than the SIM reconstruction using the data processing developed in (Wicker et al., 2013) and implemented in the Zeiss Elyra. (B) Widefield, RIM, and dense emitter localization microscopy images of the same sample of a fixed F-actin network of unroofed macrophages. Ten thousand localization microscopy raw images were recorded following the direct STORM protocol with an excitation intensity of 10 kW/cm2. Localization microscopy data were reconstructed by using different algorithms (top) based on the estimation of the second-order cumulant using NanoJ SRRF (Gustafsson et al., 2016), or based on multi-emitter fluorophore localization using either ThunderSTORM (Ovesný et al., 2014) or UNLOC (Mailfert et al., 2018). Eight hundred RIM speckled images were recorded with an excitation intensity of 4 W/cm2. The deconvolved widefield image (bottom middle) was obtained by simply forming the average of the deconvolved speckled images. A scanning electron microscopy (SEM) image of a similar sample is provided as a reference (bottom left). RIM reconstruction is significantly better resolved than the deconvolved widefield image and is closer to the SEM image than the dense emitter localization microscopy images. (C) RIM and point-scanning SIM (Airyscan) imaging of the same sample of tagged bipolar myosin II minifilaments at the apical plane, 6 μm deep, of a fixed Drosophila pupa leg. FIRE resolution was estimated to be 113 nm for RIM and 189 nm for Airyscan. RIM resolution permits to observe the roughly periodical pattern of the myosin II fluorescent doublets along the cell junctions. (D) RIM, Airyscan, and 3D SIM (Lattice SIM, Zeiss Elyra 7) images, at about 13 μm depth, of the microvilli brush border intestine of live ERM-1/ezrin endogenously tagged with mNeonGreen C. elegans L4 larvae. The transmission electron microscopy image of a similar sample shows a comb-like structure with apparent inter-microvillous spacings varying from 100 to 250 nm (see also Figure S2F). Contrary to interference-based SIM, RIM and Airyscan were able to disclose the periodic organization of the microvilli at 13 μm depth. RIM could even disclose inter-microvillous spacings of 120 nm (Figure S2F)
Figure 3
Figure 3
3D two-color imaging of a fixed Drosophila melanogaster leg (A) RIM 3D two-color imaging of a whole fixed Drosophila melanogaster pupa leg (see the cartoon in Figure 1F) with (red or magenta) RFP-tagged spaghetti squash (Sqh), the regulatory light chain of the non-muscle myosin II motor protein, and (green orturquoise) GFP-tagged E-cadherin. The 3D image, made of 200 slices with 500 nm spacing, was obtained with a 25× NA = 1.05 objective. In this inverted representation, the slide is placed at z = 0. For ease of visualization, only the fluorescence stemming from the apical plane of the columnar epithelium is presented. (B) Images of two slices of the same sample taken at 5 and 87 μm from the slide (corresponding to the apical plane on both sides of the leg) obtained with a 100× NA = 1.35 objective. The FIRE resolution was only moderately deteriorated when imaging throughout the whole leg (120 nm at 5 μm, 177 nm at 87 μm). (C) 3D image (the colors code for the axial position with respect to the slide) of the E-cadherin at the apical plane 7 to 12 μm from the slide, built from 25 slices with 200 nm spacing with the same objective as in (B). (D) Zoom-ins on the E-cadherin and myosin II corresponding to the eight yellow squares in (C). At the cell junctions, the myosin II minifilaments are well aligned on either side of the E-cadherin as expected. The image quality appears similar whatever the transverse and axial position of the magnified views.
Figure 4
Figure 4
Dynamic imaging of cell nuclei (A) RIM image at 4 μm from the slide of the whole nucleus of a U2OS cell expressing mCherry-PCNA at early S phase. (B) Top: trajectories of individual spots of PCNA at mid S phase, obtained by single-particle tracking on RIM movie sequences from the first part of Video S4. Bottom: zoom-ins on the trajectories obtained at two different locations in the nucleus (left) and integrated displacements of all the trajectories found in the nucleus, at early, mid, and late S phase (right). PCNA mobility (i.e., chromatin dynamics) decreases from early to late S phase. The differences between the median trajectory lengths (1.16, 0.86, and 0.49 μm for the early, mid, and late S phases, respectively) were found statistically significant (p < 0.001), see the STAR Methods. (C) Displacement field calculated by using optical flow on the same data as (B). The optical flow displacement field agrees with the statistics obtained with single-particle tracking. The insets display RIM images of PCNA at early, mid, and late S phase. (D) Schematic representation of the displacements of fission yeast kinetochores during mitosis. (E) Kinetochores harboring GFP-tagged Ndc80 were resolved in pro-metaphase, metaphase, and telophase (extracted from Video S5). The colors code for the axial position with respect to the slide (S. pombe typically measures 3 to 4 μm in diameter and 8 to 16 μm in length). (F) Comparison of prophase to anaphase A duration as observed by RIM or classical widefield microscopy with synchronized LED illumination on 32 mitotic cells in both cases. The difference between the RIM and widefield median durations was not found statistically significant (ns, p > 0.05), see the STAR Methods.
Figure 5
Figure 5
dynamic imaging of myosin II in live Drosophila notum (A) RIM 3D large field of view of the medial and junctional myosin II network at the apical plane of the columnar epithelium (extracted from Video S7, part 1). The bipolar myosin II minifilaments are clearly visible. The colors code for the axial position with respect to the slide. (B) Four consecutive RIM optical sections at the level of the medial myosin network. RIM high axial resolution enables to discriminate the positioning of the medial myosin network in a sensory organ precursor cell about 300 nm basally in relation to that of its neighboring epidermal cells (Video S7, part 3). (C) Time-lapse imaging focused on one cell (Video S7, part 2) showing the constant reorganization of medial myosin network.

References

    1. Abrahamsson S., Chen J., Hajj B., Stallinga S., Katsov A.Y., Wisniewski J., Mizuguchi G., Soule P., Mueller F., Darzacq X., et al. Fast multicolor 3D imaging using aberration-corrected multifocus microscopy. Nat. Methods. 2013;10:60–63. - PMC - PubMed
    1. Ambrosini A., Rayer M., Monier B., Suzanne M. Mechanical Function of the Nucleus in Force Generation during Epithelial Morphogenesis. Developmental Cell. 2019;50:197–211. - PMC - PubMed
    1. Aymard F., Bugler B., Schmidt C., Guillou E., Caron P., Briois S., Iacovoni J., Daburon V., Miller K., Jackson, et al. Transcriptionally active chromatin recruits homologous recombination at DNA double-strand breaks. Nat. Struct. Mol. Biol. 2014;21:366–374. - PMC - PubMed
    1. Ayuk R., Giovannini H., Jost A., Mudry E., Girard J., Mangeat T., Sandeau N., Heintzmann R., Wicker K., Belkebir K., et al. Structured illumination fluorescence microscopy with distorted excitations using a filtered blind-SIM algorithm. Opt. Lett. 2013;38:4723–4726. - PubMed
    1. Ball G., Demmerle J., Kaufmann R., Davis I., Dobbie I.M., Schermelleh L. SIMcheck: a toolbox for successful super-resolution structured illumination microscopy. Sci. Rep. 2015;5:15915. - PMC - PubMed

Publication types

LinkOut - more resources