. 2022 Mar 4;3(3):100557.
doi: 10.1016/j.xcrm.2022.100557. eCollection 2022 Mar 15.

Rapid synchronous type 1 IFN and virus-specific T cell responses characterize first wave non-severe SARS-CoV-2 infections

Affiliations

Rapid synchronous type 1 IFN and virus-specific T cell responses characterize first wave non-severe SARS-CoV-2 infections

Aneesh Chandran et al. Cell Rep Med. .

Abstract

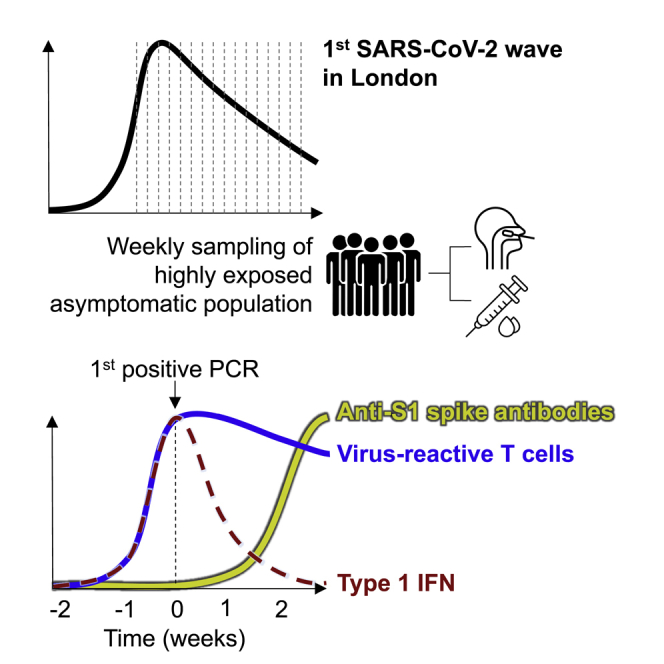
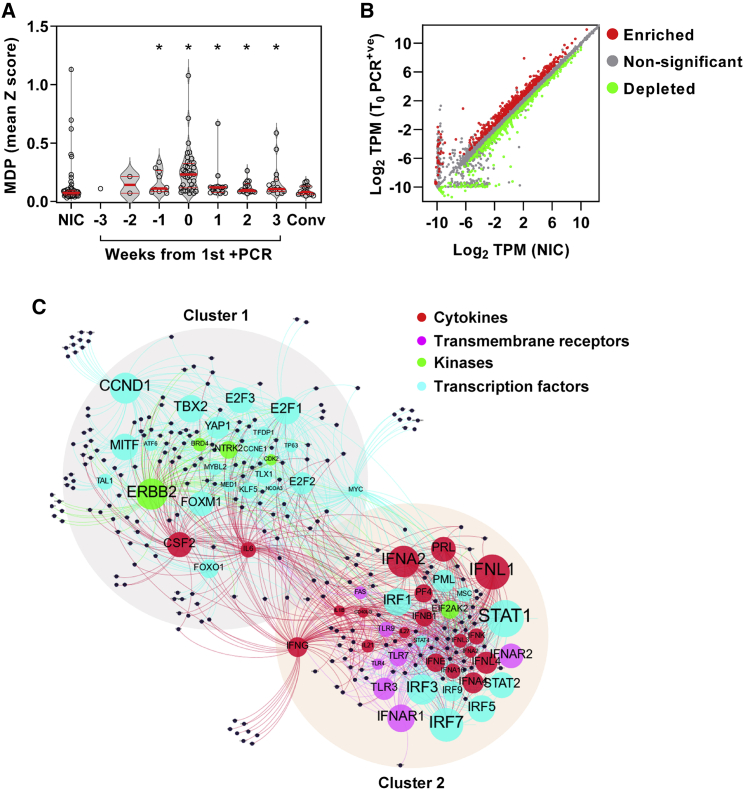
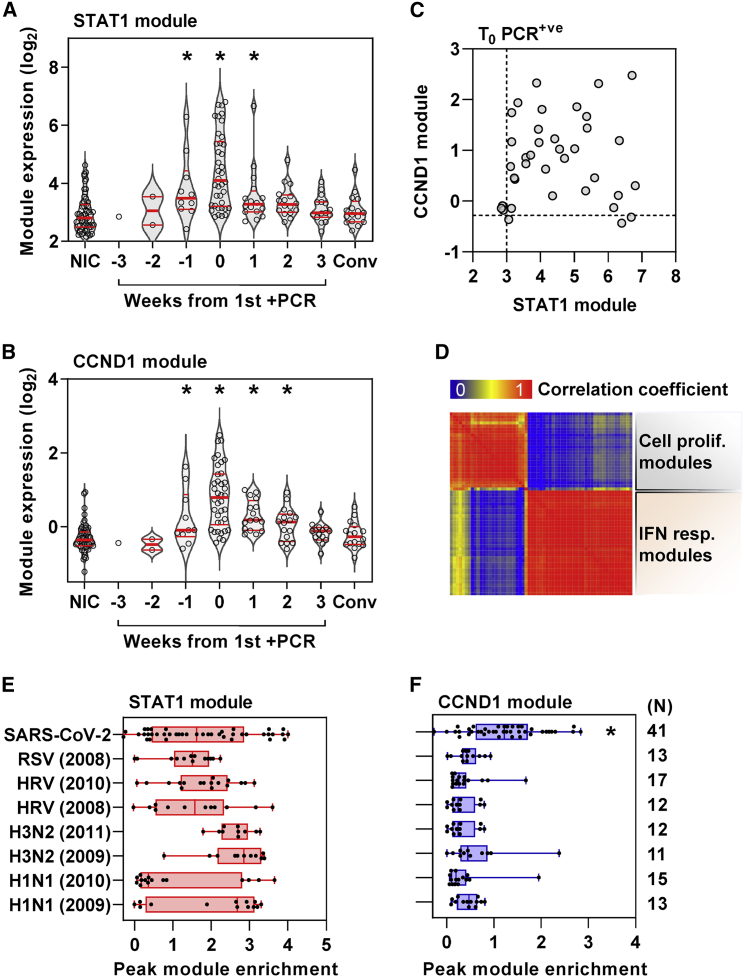
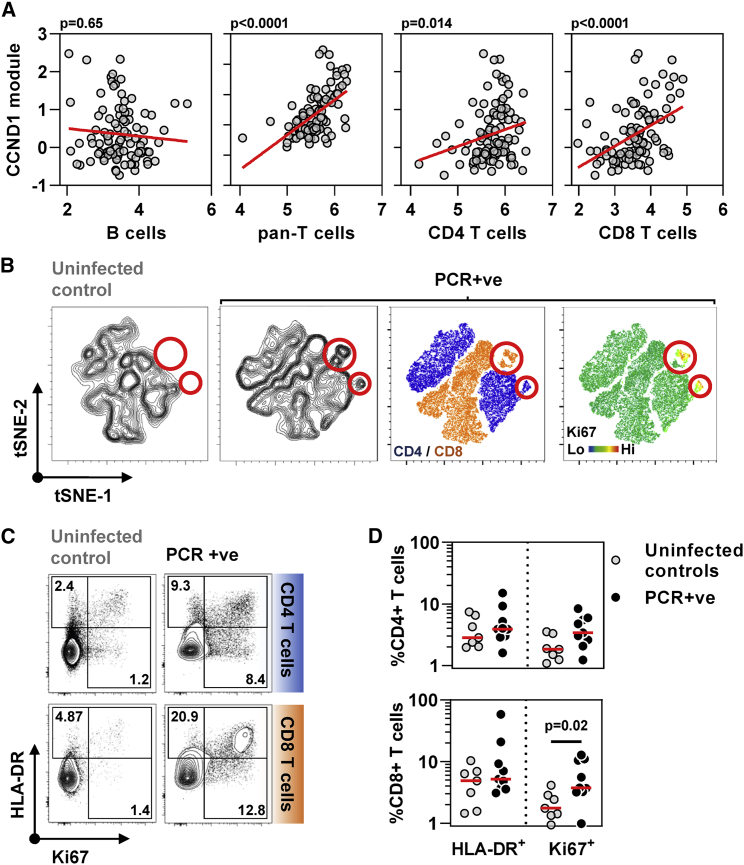
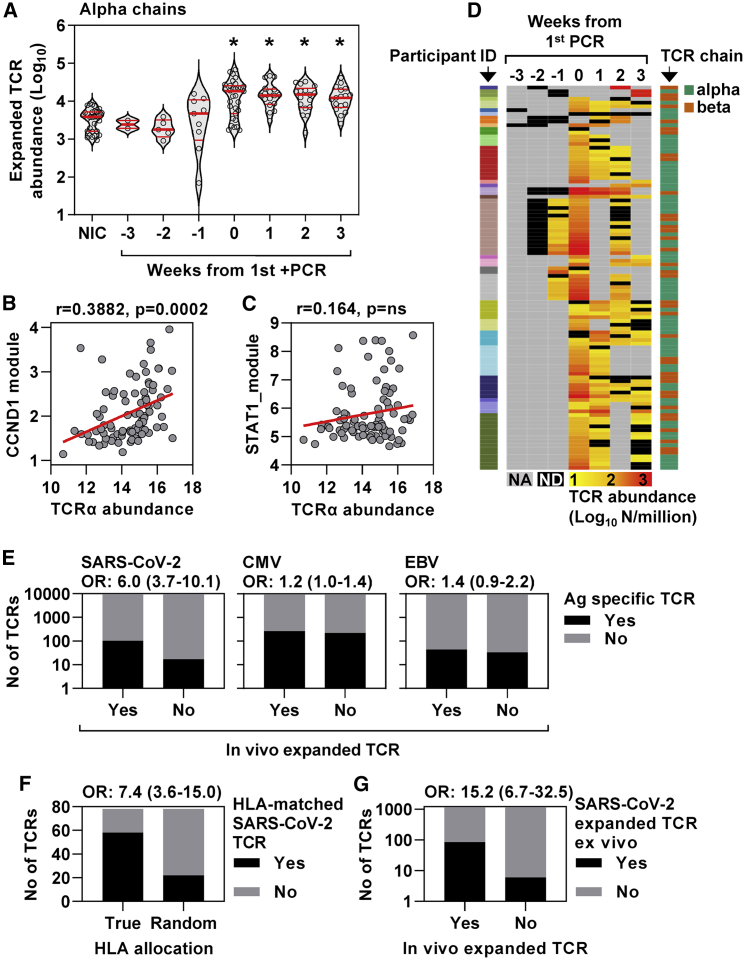
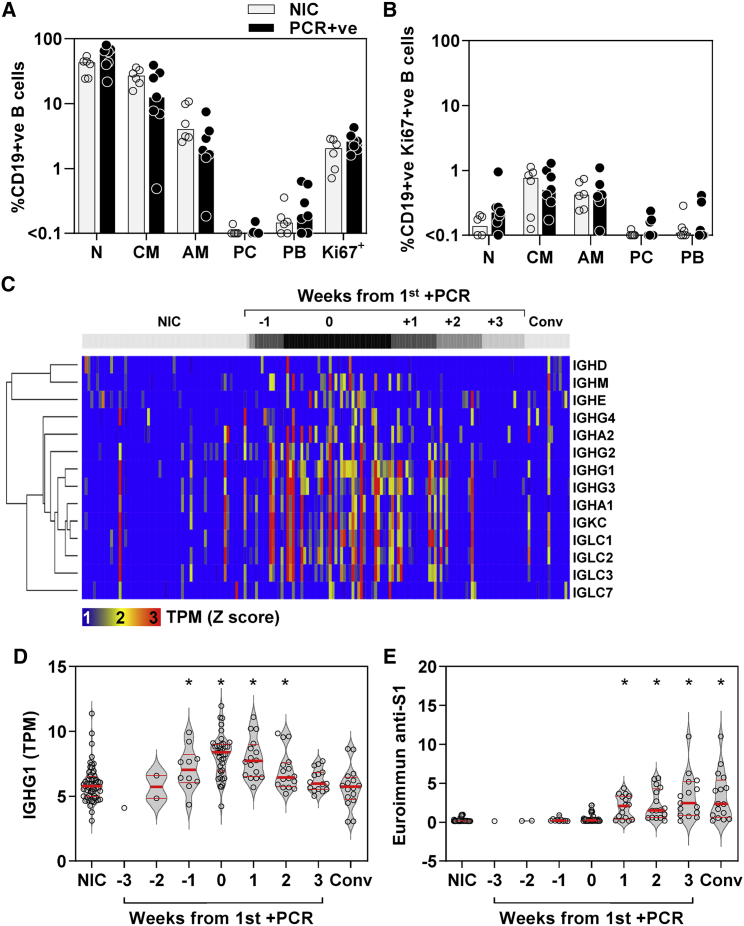
Effective control of SARS-CoV-2 infection on primary exposure may reveal correlates of protective immunity to future variants, but we lack insights into immune responses before or at the time virus is first detected. We use blood transcriptomics, multiparameter flow cytometry, and T cell receptor (TCR) sequencing spanning the time of incident non-severe infection in unvaccinated virus-naive individuals to identify rapid type 1 interferon (IFN) responses common to other acute respiratory viruses and cell proliferation responses that discriminate SARS-CoV-2 from other viruses. These peak by the time the virus is first detected and sometimes precede virus detection. Cell proliferation is most evident in CD8 T cells and associated with specific expansion of SARS-CoV-2-reactive TCRs, in contrast to virus-specific antibodies, which lag by 1-2 weeks. Our data support a protective role for early type 1 IFN and CD8 T cell responses, with implications for development of universal T cell vaccines.

Keywords: CD8 T cells; non-severe SARS-CoV-2 infection; type 1 interferon.


Conflict of interest statement

The authors declare no competing interests.

Figures

None
Graphical abstract
Figure 1
Figure 1
Incident SARS-CoV-2 infection associated with perturbation of blood transcriptome reflecting type 1 IFN and cell proliferation responses (A) Molecular degree of perturbation (MDP) in blood transcriptomes for each individual expressed as the mean of genome-wide standard deviations (Z scores) from the mean of non-infection controls (NICs). Among NICs, individuals with incident infection are stratified by weeks from first positive PCR and convalescent samples 5–6 months after incident infection. Individual data points are shown with violin plots depicting median, IQR, and frequency distributions (∗FDR < 0.05 by Kruskal-Wallis test for each group compared with NIC). (B) Differentially expressed genes in blood transcriptomes at time of first positive PCR (T0_PCR+ve) compared with NICs. (TPM, transcripts per million). (C) Predicted upstream regulators (labeled nodes) stratified by molecular function for differentially expressed genes (black nodes). Size of the nodes for upstream regulators is proportional to -Log10 p value. Nodes were clustered using Force Atlas 2 algorithm in GEPHI (version 0.9.2).
Figure 2
Figure 2
Cell proliferation response discriminates SARS-CoV-2 infection from other acute viruses and is not correlated with type 1 IFN response (A and B) (A) Expression of STAT1 module (representative of type 1 IFN response) and (B) CCND1 module (representative of cell proliferation response) in blood transcriptomic data stratified by time to first positive SARS-CoV-2 infection, compared with NICs and convalescent samples 5–6 months after incident infection. Individual data points are shown with violin plots depicting median, IQR, and frequency distributions (∗FDR < 0.05 by Kruskal-Wallis test for each group compared with NIC). (C and D) (C) Comparison of STAT1 and CCND1 module expression at time of first positive PCR (dashed lines represent the upper limit of the 95% CI of median of NICs) and (D) co-correlation matrix between all type 1 IFN and cell proliferation modules at time of first positive PCR. (E and F) Comparison of (E) STAT1 and (F) CCND1 module expression associated with co-incident SARS-CoV-2 infection compared with peak expression of these modules in experimental human challenge infections using respiratory syncytial virus (RSV), human rhinovirus (HRV), or influenza virus (H3N2 and H1N1), stratified by different datasets indicated by year (∗FDR < 0.05 by Kruskal-Wallis test in SARS-CoV-2 infection compared with all other groups).
Figure 3
Figure 3
Cell proliferation response to SARS-CoV-2 infection in blood transcriptomic data is attributable to T cell proliferation (A) Correlation of CCND1 module (representative of cell proliferation response) in all time points (−3 to +3 weeks) from individuals with SARS-CoV-2 infection with each of blood transcriptomic modules representative of B cells, pan-T cells, CD4 T cells, and CD8 T cells (regression lines shown in red, p values for Spearman rank correlations). (B) tSNE plots of T cells from non-infected controls or individuals with co-incident PCR-positive SARS-CoV-2 infection. Contour plots are shown in the two left-hand panels, followed by dot plots colored by CD4/CD8 staining or relative Ki67 staining as a proliferation marker. Red circles highlight a population of Ki67 high CD4 and CD8 cells exclusive to the PCR+ group (tSNE derived from flow cytometry data of CD4 and CD8 T cells, seven NICs, and nine PCR-positive). (C) Representative flow cytometry data for HLA-DR and Ki67 staining in either CD4 T cells or CD8 T cells from one non-infected control and one SARS-CoV-2 infected individual at the time of the first positive PCR infection. Numbers indicate percent positive for each marker including double-positives. (D) Summary HLA-DR and Ki67 staining data and median from seven uninfected controls and nine individuals with co-incident infection in either CD4 T cells or CD8 T cells. p value shown for Mann-Whitney test.
Figure 4
Figure 4
Cell proliferation response to co-incident SARS-CoV-2 infection associated with expansion of TCR clones enriched for SARS-CoV-2-reactive TCRs (A) Enumeration of expanded TCR α chain abundance (per million total sequences) in non-infection controls and samples from infected individuals stratified by time from first positive PCR. Individual data points are shown with violin plots depicting median, IQR, and frequency distributions (∗FDR < 0.05 by Kruskal-Wallis test for each group compared with NIC). (B and C) Correlation of (B) CCND1 module and (C) STAT1 module with TCR α chain sequences (log2 per million sequences). Regression lines are shown in red, with R and p values for Spearman rank correlations. (D) The dynamics of in-vivo-expanded TCRs (counts per million TCRs) identified as SARS-CoV-2 reactive in VDJdb, displayed as a heatmap in which each row is an individual TCR (α or β gene, right-hand key) from individual participants (left-hand key). NA, no sample available; ND, not detected in sample. (E) Number of TCR sequences (α and β genes) annotated for SARS-CoV-2, cytomegalovirus (CMV), and Epstein-Barr virus (EBV) in VDJdb matching either expanded or unexpanded TCR sequences from individuals with SARS-CoV-2 infection, giving the odds ratio (OR±95% CI, Fisher’s exact test) for enrichment of antigen-specific TCR sequences in each case. (F) Number of SARS-CoV-2-specific TCRs in VDJdb for which the reported HLA restriction (HLA A1 or HLA A2) matches the HLA haplotype of the individual in which the expansion was observed. The number is compared with the expected number of HLA matches if HLA allocation was random, and these numbers are used to derive the OR (±95% CI, Fisher’s exact test). (G) Number of ex vivo SARS-CoV-2 peptide-reactive TCR sequences (α and β genes) among expanded and unexpanded TCR sequences from individuals with SARS-CoV-2 infection, giving the OR (±95% CI, Fisher’s exact test) for enrichment of virus-specific TCR sequences.
Figure 5
Figure 5
Enriched immunoglobulin gene expression and antibody response to incident SARS-CoV-2 infection (A and B) (A) Frequency of B cell (N, naive; CM, classical memory; AM, activated memory; PC, plasma cells; PB, plasmablasts) subsets among total CD19-positive cells and (B) Ki67-positive CD19 cells in PBMCs from six NICs and seven individuals with co-incident infection, showing individual data points and the median (bars). (C) Heatmap of immunoglobulin constant heavy- and light-chain gene expression in blood per individual (columns) stratified by time to first positive SARS-CoV-2 infection, compared with NIC and convalescent (Conv) samples 5–6 months after incident infection, presented as standardized (Z) scores of transcripts per million (TPM) using mean and SD of NIC. (D and E) Blood TPM of (D) IGHG1 and (E) relative IgG anti-S1 antibody levels stratified by time to first positive SARS-CoV-2 infection, compared with NIC and Conv samples. Individual data points shown with violin plots depicting median, IQR, and frequency distributions (∗FDR < 0.05 by Kruskal-Wallis test for each group compared with NIC).

References

    1. Bastard P., Rosen L.B., Zhang Q., Michailidis E., Hoffmann H.-H., Zhang Y., Dorgham K., Philippot Q., Rosain J., Béziat V., et al. Autoantibodies against type I IFNs in patients with life-threatening COVID-19. Science. 2020;370:eabd4585. - PMC - PubMed
    1. Pairo-Castineira E., Clohisey S., Klaric L., Bretherick A.D., Rawlik K., Pasko D., Walker S., Parkinson N., Fourman M.H., Russell C.D., et al. Genetic mechanisms of critical illness in COVID-19. Nature. 2021;591:92–98. - PubMed
    1. Zhang Q., Bastard P., Liu Z., Le Pen J., Moncada-Velez M., Chen J., Ogishi M., Sabli I.K.D., Hodeib S., Korol C., et al. Inborn errors of type I IFN immunity in patients with life-threatening COVID-19. Science. 2020;370:eabd4570. - PMC - PubMed
    1. Boyton R.J., Altmann D.M. The immunology of asymptomatic SARS-CoV-2 infection: what are the key questions? Nat. Rev. Immunol. 2021;21:762–768. - PMC - PubMed
    1. Swadling L., Diniz M.O., Schmidt N.M., Amin O.E., Chandran A., Shaw E., Pade C., Gibbons J.M., Le Bert N., Tan A.T., et al. Pre-existing polymerase-specific T cells expand in abortive seronegative SARS-CoV-2. Nature. 2022;601:110–117. - PMC - PubMed

Publication types

Substances