. 2022 Apr 6;7(15):12524-12535.
doi: 10.1021/acsomega.1c05264. eCollection 2022 Apr 19.

Microbial Carbonation of Monocalcium Silicate

Affiliations

Microbial Carbonation of Monocalcium Silicate

Michael S Guzman et al. ACS Omega. .

Abstract

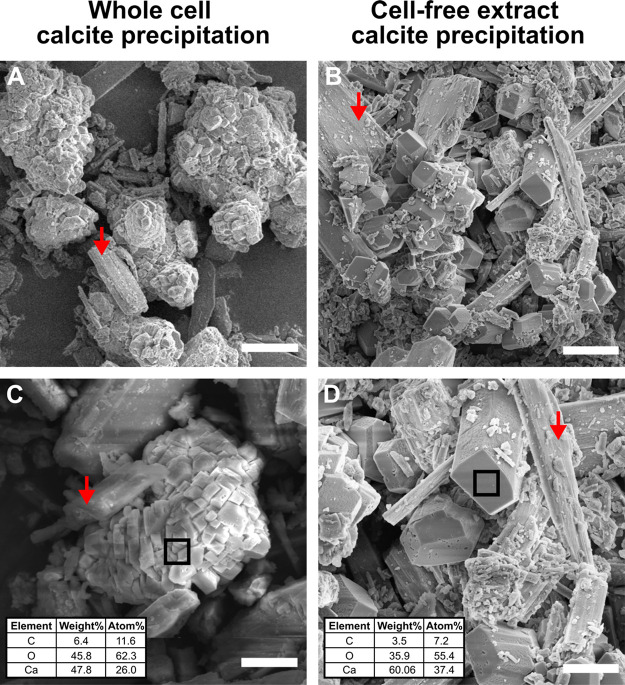
Biocement formed through microbially induced calcium carbonate precipitation (MICP) is an emerging biotechnology focused on reducing the environmental impact of concrete production. In this system, CO2 species are provided via ureolysis by Sporosarcina pasteurii (S. pasteurii) to carbonate monocalcium silicate for MICP. This is one of the first studies of its kind that uses a solid-state calcium source, while prior work has used highly soluble forms. Our study focuses on microbial physiological, chemical thermodynamic, and kinetic studies of MICP. Monocalcium silicate incongruently dissolves to form soluble calcium, which must be coupled with CO2 release to form calcium carbonate. Chemical kinetic modeling shows that calcium solubility is the rate-limiting step, but the addition of organic acids significantly increases the solubility, enabling extensive carbonation to proceed up to 37 mol %. The microbial urease activity by S. pasteurii is active up to pH 11, 70 °C, and 1 mol L-1 CaCl2, producing calcite as a means of solidification. Cell-free extracts are also effective albeit less robust at extreme pH, producing calcite with different physical properties. Together, these data help determine the chemical, biological, and thermodynamic parameters critical for scaling microbial carbonation of monocalcium silicate to high-density cement and concrete.


Conflict of interest statement

The authors declare no competing financial interest.

Figures

Figure 1
Figure 1
Modeling of ICD and calcium carbonation. (A) Model predictions for the increase in the temperature of slurries (i.e., a solid-to-liquid ratio of 0–100 wt %) under adiabatic conditions due to the exothermic heat of reaction associated with monocalcium silicate carbonation. (B) Model predictions for pH and calcium concentration evolution in a 15 wt % monocalcium silicate suspension. Experimental and modeled pH (C) and soluble calcium concentration (D) with the addition of acetic acid (0, 0.5, and 1 mol L–1) to monocalcium silicate (15 wt %). Experimental data shown are the averages of replicates ± standard deviation (n = 3).
Figure 2
Figure 2
Effect of temperature, pH, and calcium salt concentration on urease activity of Sporosarcina pasteurii ATCC 11859. (A) Effect of temperature and pH on urease activity. (B) Influence of calcium salt (CaCl2) concentration on urease activity and the calcium carbonate (CaCO3) precipitation rate. Data shown are the averages of biological replicates assayed in triplicate ± standard deviation (n = 3).
Figure 3
Figure 3
Whole-cell-induced carbonation of acetic acid-treated monocalcium silicate slurries. Experimental and modeled (A) ammonia production, (B) pH, (C) soluble calcium concentration, and (D) calcium carbonate precipitation with the addition of acetic acid (0, 0.5, and 1 mol L–1) to 15 wt % (i.e., the solid-to-liquid ratio) monocalcium silicate slurries. Data shown are the averages of biological replicates assayed in triplicate ± standard deviation (n = 3).
Figure 4
Figure 4
Effect of temperature, pH, and calcium salt concentration on cell-free extract urease activity. (a) Effect of temperature and pH on urease activity of cell-free extracts. (b) Influence of calcium salt (CaCl2) concentration on urease activity and the calcium uptake rate of cell-free extracts. Data shown are the averages of biological replicates assayed in triplicate ± standard deviation (n = 3).
Figure 5
Figure 5
Cell-free extract-induced carbonation of acetic acid-treated monocalcium silicate slurries. Experimentally determined (A) ammonia production, (B) pH, (C) soluble calcium concentration, and (D) calcium carbonate precipitation with the addition of acetic acid (0, 0.5, and 1 mol L–1) to 15 wt % (i.e., the solid-to-liquid ratio) monocalcium silicate slurries containing cell-free extracts. Data shown are the averages of biological replicates assayed in triplicate ± standard deviation (n = 3).
Figure 6
Figure 6
SEM and EDS analysis of whole-cell- and cell-free extract-induced calcium carbonate precipitation. SEM images of 15 wt % monocalcium silicate slurries (i.e., the solid-to-liquid ratio) pretreated with 1 mol L–1 acetic acid and amended with either whole cells (A,C) or cell-free extracts (B,D). Scale bars: 10 (A,B) and 5 μm (C,D). Elemental analysis of crystal regions is indicated by the black box (all elements detected are shown in table insets in (C) and (D)). Red arrows indicate representative monocalcium silicate particles.
Figure 7
Figure 7
XRD analysis of whole-cell- and cell-free extract-induced calcium carbonate precipitation. X-ray diffraction of 15 wt % (i.e., the solid-to-liquid ratio) monocalcium silicate slurries amended with either whole cells (A) or cell-free extracts (B). The top (yellow) spectrum of each graph shows monocalcium silicate slurries treated with 1 mol L–1 acetic acid and either whole cells (A) or cell-free extracts (B). The middle (black) panel shows spectra for abiotic, untreated monocalcium silicate slurries (negative control). The inset spectra in the middle panels indicate monocalcium silicate slurries treated with increasing concentrations of acetic acid (0–1 mol L–1) and either whole cells (A) and cell-free extracts (B). The calcite peak is shown to increase with increasing acetic acid concentration. Reference spectra for monocalcium silicate (Wollastonite 2M, blue) and calcite (red) are shown in the lower panel of each diagram.

References

    1. Worrell E.; Price L.; Martin N.; Hendriks C.; Meida L. O. Carbon dioxide emissions from the global cement industry. Annu. Rev. Energy 2001, 26, 303–329.
    1. Tracking Industrial Energy Efficiency and CO2 Emissions. IEA, June 2007. https://www.iea.org/reports/tracking-industrial-energy-efficiency-and-co... (accessed 2021-09-22).
    1. Huang H.; Wang T.; Kolosz B.; Andresen J.; Garcia S.; Fang M.; Maroto-Valer M. M. Life-cycle assessment of emerging CO2 mineral carbonation-cured concrete blocks: Comparative analysis of CO2 reduction potential and optimization of environmental impacts. J. Cleaner Prod. 2019, 241, 11835910.1016/j.jclepro.2019.118359. - DOI
    1. Riman R. E.; Gupta S.; Atakan V.; Li Q.. Bonding element, bonding matrix and composite material having the bonding element, and method of manufacturing thereof. US 9,868,667, 2018.
    1. Riman R. E.; Atakan V.; Kuppler J. P.; Smith K. M.. Precursors and transport methods for hydrothermal liquid phase sintering (HLPS). US 9,266,147, 2016.

LinkOut - more resources