. 2022 Apr 23;11(4):e1389.
doi: 10.1002/cti2.1389. eCollection 2022.

Allogeneic haematopoietic stem cell transplantation resets T- and B-cell compartments in sickle cell disease patients

Affiliations

Allogeneic haematopoietic stem cell transplantation resets T- and B-cell compartments in sickle cell disease patients

Luciana Ribeiro Jarduli-Maciel et al. Clin Transl Immunology. .

Abstract

Objectives: Allogeneic haematopoietic stem cell transplantation (allo-HSCT) is the only currently available curative treatment for sickle cell disease (SCD). Here, we comprehensively evaluated the reconstitution of T- and B-cell compartments in 29 SCD patients treated with allo-HSCT and how it correlated with the development of acute graft-versus-host disease (aGvHD).

Methods: T-cell neogenesis was assessed by quantification of signal-joint and β-chain TCR excision circles. B-cell neogenesis was evaluated by quantification of signal-joint and coding-joint K-chain recombination excision circles. T- and B-cell peripheral subset numbers were assessed by flow cytometry.

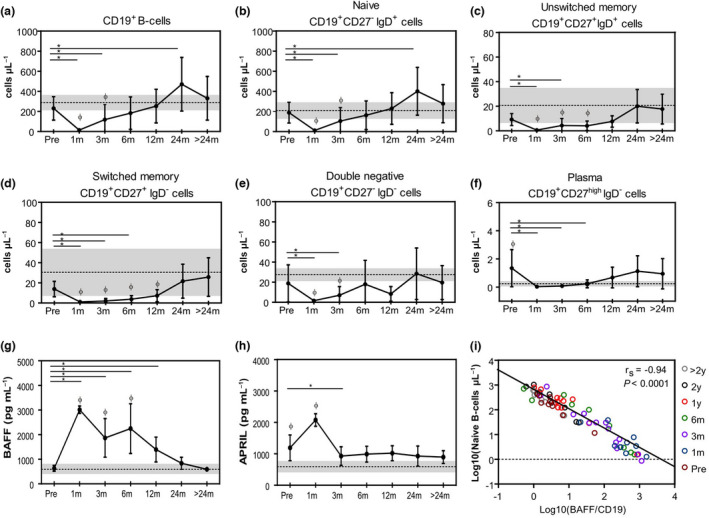
Results: Before allo-HSCT (baseline), T-cell neogenesis was normal in SCD patients compared with age-, gender- and ethnicity-matched healthy controls. Following allo-HSCT, T-cell neogenesis declined but was fully restored to healthy control levels at one year post-transplantation. Peripheral T-cell subset counts were fully restored only at 24 months post-transplantation. Occurrence of acute graft-versus-host disease (aGvHD) transiently affected T- and B-cell neogenesis and overall reconstitution of T- and B-cell peripheral subsets. B-cell neogenesis was significantly higher in SCD patients at baseline than in healthy controls, remaining high throughout the follow-up after allo-HSCT. Notably, after transplantation SCD patients showed increased frequencies of IL-10-producing B-regulatory cells and IgM+ memory B-cell subsets compared with baseline levels and with healthy controls.

Conclusion: Our findings revealed that the T- and B-cell compartments were normally reconstituted in SCD patients after allo-HSCT. In addition, the increase of IL-10-producing B-regulatory cells may contribute to improve immune regulation and homeostasis after transplantation.

Keywords: B‐cell neogenesis; T‐cell neogenesis; allogeneic haematopoietic stem cell transplantation; peripheral homeostasis; sickle cell disease.


Conflict of interest statement

The authors declare no conflict of interest.

Figures

Figure 1
Figure 1
T‐cell neogenesis is transiently decreased following transplantation and then normalised after allo‐HSCT. Mean (± SD) total number of (a) sjTREC and (b) β‐TREC values measured by RT‐PCR before (pre‐transplantation, n = 19) and at 1 (n = 20), 3 (n = 20), 6 (n = 18), 12 (n = 16), 24 (n = 12) and > 24 (n = 14) months after allogeneic transplantation (allo‐HSCT). (c) Intrathymic T‐cell division (n) was calculated using the following formula: n = log2(sjTREC/ β‐TREC). Shaded areas indicate mean (dotted lines) and ± SD values for the group of healthy controls (n = 16). *Statistical difference between pre‐ and post‐transplantation time points (P < 0.05). ɸ Statistical difference comparing all time points (post‐transplantation) with those of the healthy control group (P < 0.05).
Figure 2
Figure 2
Reconstitution of peripheral T‐cell subsets in SCD patients following allo‐HSCT. Mean (± SD) frequency of (a) absolute number of lymphocytes and (b) CD3+ lymphocytes, (c) CD3+CD4+ and CD3+CD8+ lymphocytes, (d) naïve CD4+ T cells [(CD4+)CD27+CD45RO‐] and naïve CD8+ T cells [(CD8+)CD27+CD45RO‐], (e) central memory, (f) effector memory, (g) effector’s cells, and (h) CD4+ and recent thymic emigrant (RTE) cells. The subsets were quantified by flow cytometry before the transplant (pre‐transplant, n = 15) and following time points after allogeneic transplantation (allo‐HSCT) at 1 month, 3 and 6 months (n = 16), 12 and 24 months (n = 11) and > 24 months (n = 10). Shaded areas indicate mean (dotted lines) and ± SD values for the group of healthy controls (n = 5). *Statistical difference between pre‐ and post‐transplantation time points (P < 0.05). ɸ Statistical difference comparing all time points (post‐transplantation) with those of the healthy control group (P < 0.05). (i) Spearman’s correlation between CD4+CD35RA+CD31+ cells and sjTREC values. Different time points can be identified by different colours.
Figure 3
Figure 3
Acute GvHD leads to a delayed T‐cell neogenesis in the first months after transplantation. Mean (± SD) of total number of (a) sjTREC and (b) b‐TREC values measured by RT‐PCR before the transplant (pre‐transplant) and following time points after allogeneic transplantation (allo‐ HSCT) at 1, 3, 6, 12, 24 and > 24 months in SCD patients who developed aGvHD and in SCD patients who did not develop GvHD. Black lines represent non‐GvHD group, and red lines represent the aGvHD group. Statistical analysis was performed using the linear regression mixed model composed of random and fixed effects. *Statistical difference between pre‐ and post‐transplantation time points in the non‐GvHD and aGvHD group (P < 0.05). For the sjTREC comparison: * aGvHD: pre‐ vs. 1m and 3 m and non‐GvHD: pre‐ vs. 1m and 3m. For the β‐TREC comparison: * aGvHD: pre‐ vs. 6m and non‐GvHD: pre‐ vs. 1m. For the CS comparison: * aGvHD: pre‐ vs. 24m and non‐GvHD: pre‐ vs. 3m; ** statistical difference between non‐GvHD and aGvHD (P < 0.05); § statistical difference between aGvHD and the healthy control group (P < 0.05); §§ statistical difference between non‐GvHD and the healthy control group (P < 0.05); other combinations were NS.
Figure 4
Figure 4
B‐cell neogenesis is increased in SCD patients before and after treatment with allo‐HSCT. Mean (± SD) of total number of (a) sjKREC and (b) Cj values measured by RT‐PCR before the transplant (pre‐transplant, n = 19) and following time points after allogeneic transplantation (allo‐ HSCT) at 1 month and 3 months (n = 20), 6 months (n = 18), 12 months (n = 16), 24 months (n = 12) and > 24 months (n = 14). (c) B‐cell division (n) was calculated using the following formula: n = log2(Cj/ sjKREC). Shaded areas indicate mean (dotted lines) and ± SD values for the group of healthy controls (n = 16). *P < 0.05 and ɸ P < 0.05 comparing all time point values with those of the healthy control group.
Figure 5
Figure 5
Reconstitution of peripheral B‐cell subsets in SCD patients and early increase of BAFF and APRIL serum levels following allo‐HSCT. Mean (± SD) frequency of (a) CD19+ B cells, (b) CD19+CD27IgD+ naïve, (c) CD19+CD27+IgD+ unswitched memory, (d) CD19+CD27+IgD switched memory, (e) CD19+IgDCD27 double negative and (f) CD19+CD27highIgD plasma cells immunophenotyped by flow cytometry before the transplant (pre‐transplant, n = 15) and following time points after allogeneic transplantation (allo‐HSCT) at 1 month, 3 and 6 months (n = 16), 12 and 24 months (n = 11) and > 24 months (n = 10). Shaded areas indicate mean (dotted lines) and ± SD values for the group of healthy controls (n = 5). (g) Mean (± SD) serum levels of BAFF and APRIL (h) determined before the transplant (pre‐transplant, n = 17) and following time points after allogeneic transplantation (allo‐HSCT) at 1 month and 3 months (n = 15), 6 and 12 months (n = 13), 24 months (n = 9) and > 24 months (n = 6). Shaded areas indicate mean (dotted lines) and ± SD values for the group of healthy controls (n = 4). *Statistical difference between pre‐ and post‐transplantation time points (P < 0.05). ɸ Statistical difference comparing all time points (post‐transplantation) with those of the healthy control group (P < 0.05). (i) Spearman’s correlation between CD19+ naïve B‐cell counts and BAFF concentration by CD19+ cells before the transplant and following time points after allo‐HSCT. Different time points can be identified by different colours.
Figure 6
Figure 6
F Correlations of parameters related to B‐cell neogenesis and proliferative state. Spearman’s correlation between frequency of (a) naïve B cells and sjKREC/150 000 PBMC counts, (b) CD19+ B cells and Cj/150 000 PBMC counts and (c) BAFF concentration by CD19+ cells and sjKREC/150 000 PBMC counts before the transplant and following time points after allo‐HSCT. Different time points can be identified by different colours. y, years; m, months; pre, pre‐transplantation period.
Figure 7
Figure 7
Increased IL‐10 production by regulatory B‐cell subsets after allo‐HSCT. (a) Gating strategy of one representative patient demonstrating the frequency of CD19+CD24hiCD38hi transitional and CD19+CD24hiCD27+ memory regulatory B cells (Bregs) immunophenotyped by flow cytometry. (b) Frequency of CD19+CD24hiCD38+ and CD19+CD24hiCD27+ regulatory B cells from a group of healthy control individuals (n = 6), before the transplant (pre‐transplant, n = 6) and at 12 months (n = 6) after transplantation. (c) Total PBMCs from allo‐HSCT SCD patients before the transplant (pre‐transplant, n = 6) and at 12 months (n = 6) after transplantation and from a group of healthy control individuals (n = 6) were cultured for 18 hours with CpG or CpG and rhCD40L followed by restimulation with phorbol myristate acetate + ionomycin + BFA (PIB) in the last 6 hours of culture, fixed and permeabilised. Intracellular IL‐10 was assessed in CD19+ B cells by flow cytometry. The position of all gates was determined using isotype‐matched control mAb staining. Negative controls consisted of PBMCs cultured in the presence of CpG control and BFA. These data are representative of those obtained in six independent experiments. Numbers in the boxes represent the frequency of IL‐10‐producing CD19+ cells. (d) Quantification (%) of IL‐10‐producing CD19+ cells from a group of healthy control individuals (n = 6), before the transplant (pre‐transplant, n = 6) and at 12 months (n = 6) after transplantation and Spearman’s correlation with log10(sjKREC/150.000 PBMC) one year after allo‐HSCT. (e) IL‐10 expression by CD19+CD24hiCD38hi and CD19+CD24hiCD27+ Bregs from a group of healthy control individuals (n = 6), before the transplant (pre‐transplant, n = 6) and at 12 months (n = 6) after transplantation. *Statistical difference (P < 0.05).

References

    1. Ware RE, de Montalembert M, Tshilolo L, Abboud MR. Sickle cell disease. Lancet 2017; 390: 311–323. - PubMed
    1. Odièvre M‐H, Verger E, Silva‐Pinto AC, Elion J. Pathophysiological insights in sickle cell disease. Indian J Med Res 2011; 134: 532–537. - PMC - PubMed
    1. Hounkpe BW, Fiusa MML, Colella MP et al. Role of innate immunity‐triggered pathways in the pathogenesis of Sickle Cell Disease: a meta‐analysis of gene expression studies. Sci Rep 2015; 5: 17822. - PMC - PubMed
    1. Zhang D, Xu C, Manwani D, Frenette PS. Neutrophils, platelets, and inflammatory pathways at the nexus of sickle cell disease pathophysiology. Blood 2016; 127: 801–809. - PMC - PubMed
    1. Kato GJ, Piel FB, Reid CD, Gaston MH et al. Sickle cell disease. Nat Rev Dis Prim 2018; 4: 18010. - PubMed