. 2022 Apr 20;11(4):e1386.
doi: 10.1002/cti2.1386. eCollection 2022.

Deficient DNASE1L3 facilitates neutrophil extracellular traps-induced invasion via cyclic GMP-AMP synthase and the non-canonical NF-κB pathway in diabetic hepatocellular carcinoma

Affiliations

Deficient DNASE1L3 facilitates neutrophil extracellular traps-induced invasion via cyclic GMP-AMP synthase and the non-canonical NF-κB pathway in diabetic hepatocellular carcinoma

Na Li et al. Clin Transl Immunology. .

Abstract

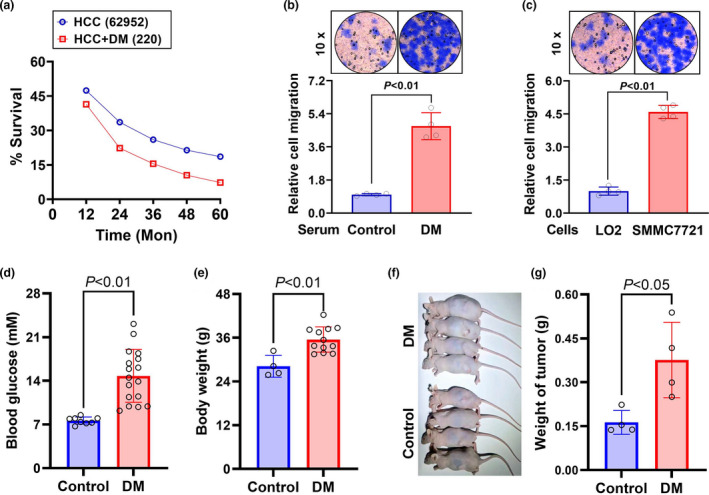
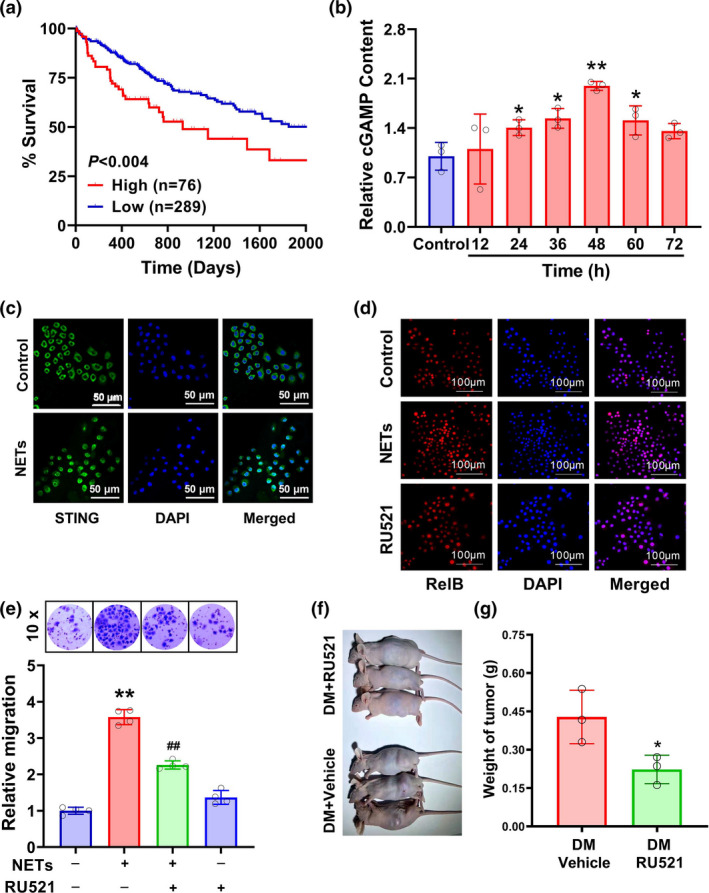
Objective: Diabetic hepatocellular carcinoma (HCC) patients have high mortality and metastasis rates. Diabetic conditions promote neutrophil extracellular traps (NETs) generation, which mediates HCC metastasis and invasion. However, whether and how diabetes-induced NETs trigger HCC invasion is largely unknown. Here, we aimed to observe the effects of diabetes-induced NETs on HCC invasion and investigate mechanisms relevant to a DNA sensor cyclic GMP-AMP synthase (cGAS).

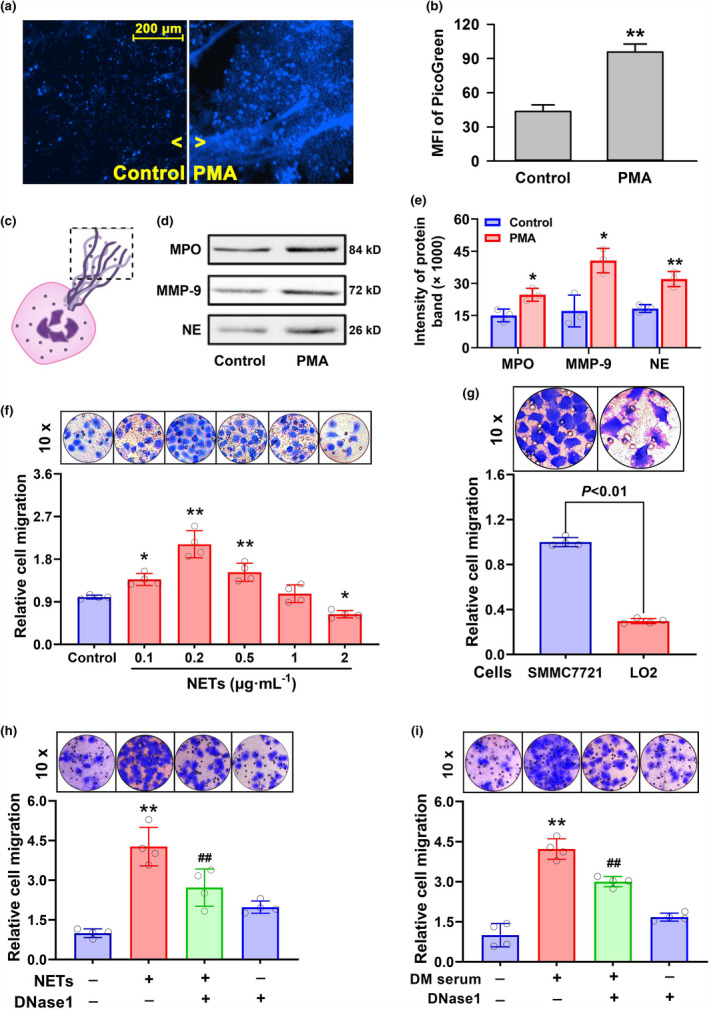
Methods: Serum from diabetic patients and healthy individuals was collected. Human neutrophil-derived NETs were isolated for stimulating HCC cell invasion. Data from the SEER and TCGA databases were used for bioinformatics analysis. In HCC cells and allograft models, NETs-triggered invasion was observed.

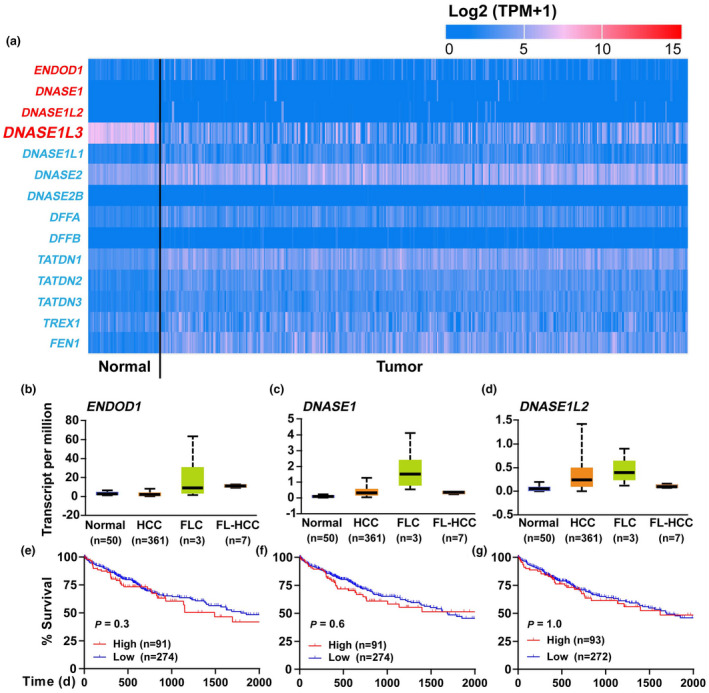
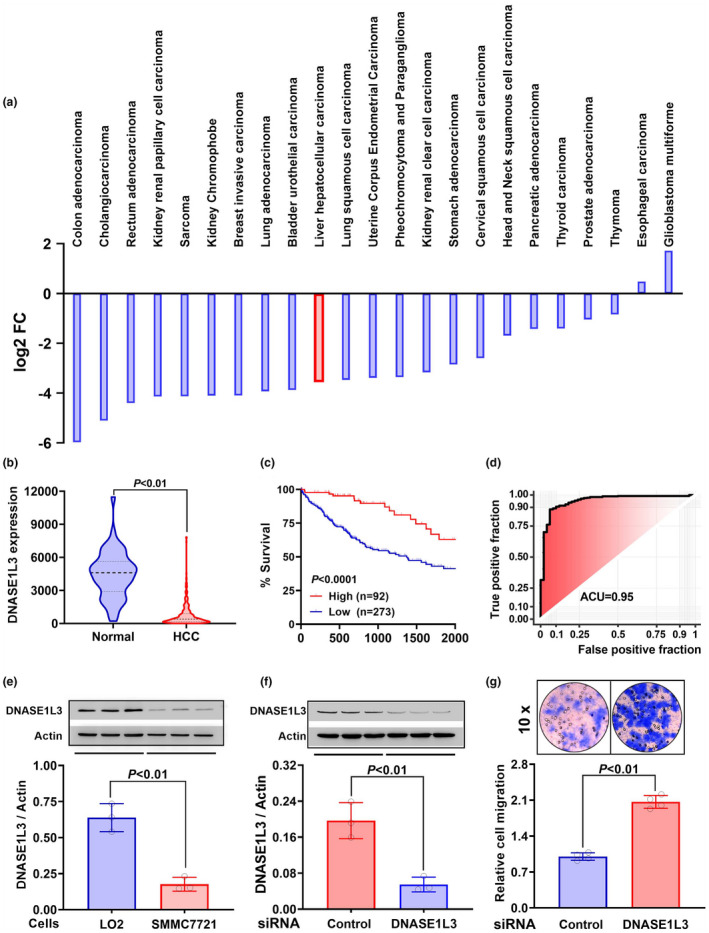
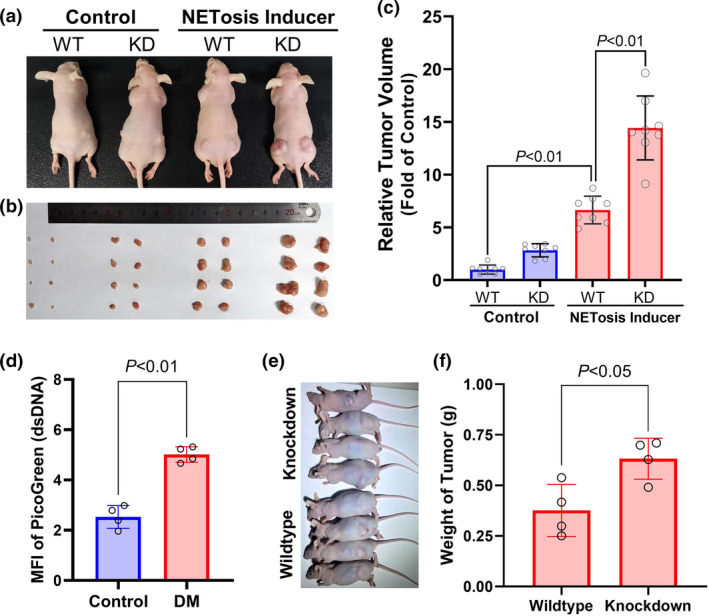
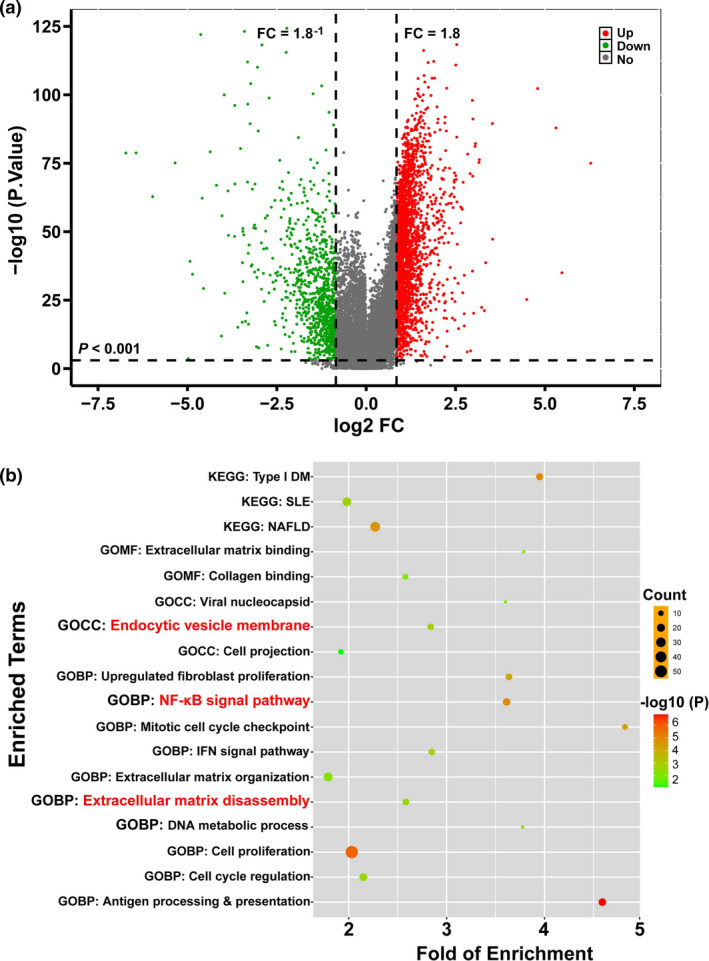
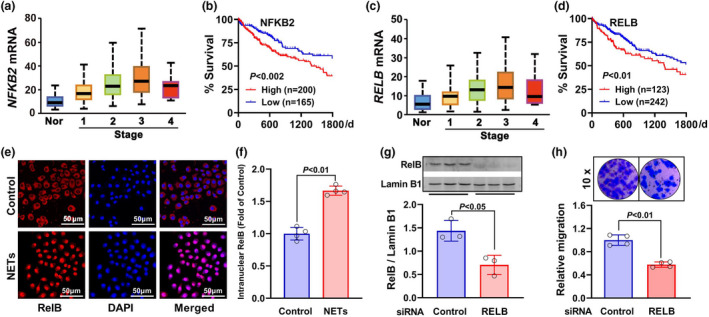
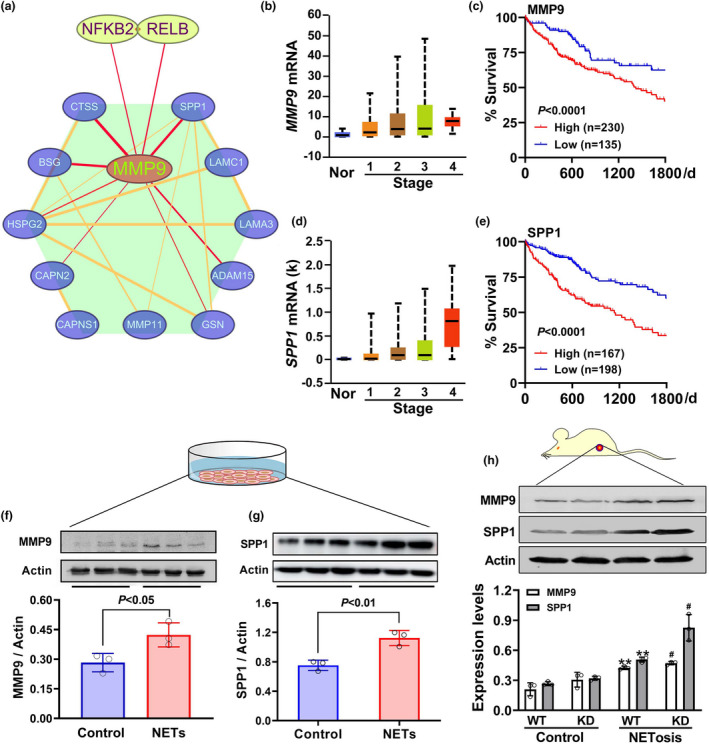
Results: Diabetic HCC patients had poorer survival than non-diabetic ones. Either diabetic serum or extracted NETs caused HCC invasion. Induction of diabetes or NETosis elicited HCC allograft invasion in nude mice. HCC cell invasion was attenuated by the treatment with DNase1. In TCGA_LIHC, an extracellular DNase DNASE1L3 was downregulated in tumor tissues, while function terms (the endocytic vesicle membrane, the NF-κB pathway and extracellular matrix disassembly) were enriched. DNASE1L3 knockdown in LO2 hepatocytes or H22 cell-derived allografts facilitated HCC invasion in NETotic or diabetic nude mice. Moreover, exposure of HCC cells to NETs upregulated cGAS and the non-canonical NF-κB pathway and induced expression of metastasis genes (MMP9 and SPP1). Both cGAS inhibitor and NF-κB RELB knockdown diminished HCC invasion caused by NETs DNA. Also, cGAS inhibitor was able to retard translocation of NF-κB RELB.

Conclusion: Defective DNASE1L3 aggravates NETs DNA-triggered HCC invasion on diabetic conditions via cGAS and the non-canonical NF-κB pathway.

Keywords: cyclic GMP‐AMP synthase; diabetes; hepatocellular carcinoma; metastasis; neutrophil extracellular traps; non‐canonical NF‐κB pathway.


Conflict of interest statement

The authors declare no conflict of interest.

Figures

Figure 1
Figure 1
Effects of diabetes on HCC cell invasion. (a) Analysis of survival rate of 62 952 HCC patients and 220 diabetic HCC patients diagnosed from 2008 to 2017 in the SEER*Stat 8.3 program. (b, c) HCC SMMC7721 cells were treated with the serum from diabetic patients or healthy individuals (b) and, HCC SMMC7721 cells or LO2 hepatocytes were treated with the diabetic serum (c) for 48 h. The cell invasion was observed with the transwell assay. A diabetic model of nude mice was established through a high‐fat and carbohydrate diet combined with an intraperitoneal streptozotocin injection. (d) Blood glucose of the diabetic (n = 17) and control (n = 8) mice was tested. (e) Body weight of the diabetic (n = 12) and control (n = 4) mice was measured. (f, g) Four allografts in either group were observed and weighed. Data are shown as mean ± SD.
Figure 2
Figure 2
Roles of extracellular DNA in NETs‐induced HCC cell invasion. (a–e) Neutrophils isolated from human peripheral blood were treated with 20 nm PMA for 2 h. DNA was labelled using Hoechst 33324 staining followed by fluorescence photography (a). Extracellular DNA was collected and quantified with a fluorescence microplate reader following PicoGreen staining (b). A schematic diagram showing NETs release from neutrophils (c). Granule proteins (MPO, MMP9 and NE) in the nets from PMA‐treated or control cell supernatant were measured by Western blot assay after total proteins were quantified with a BCA kit (d), and the band intensity was quantified with the ImageJ software (e). (f–i) HCC SMMC7721 cells were stimulated with increasing concentrations of NETs (f). SMMC7721 cells or LO2 hepatocytes were treated with 0.2 μg mL−1 NETs (g). SMMC7721 cells were treated with 0.2 μg mL−1 NETs (h) or diabetic serum (i) in the absence or presence of 1.5 U DNase1. The cell invasion was observed with the transwell assay (mean ± SD, n = 4). *P < 0.05, **P < 0.01 vs. Control group. ## P < 0.01 vs. DNase1‐free group.
Figure 3
Figure 3
Expression of DNA‐degrading enzymes in HCC tissues. (a) Gene expression of extracellular (red) and intracellular (blue) DNA‐degrading enzymes between HCC and adjacent normal tissues is displayed in the heat plot. (b–d) RNA levels of three extracellular DNA‐degrading enzymes (ENDOD1, DNASE1 and DNASE1L2) in the TCGA_LIHC cohort. (e–g) Effects of the three enzymes on survival of HCC patients.
Figure 4
Figure 4
Roles of DNA‐degrading enzyme DNASE1L3 in HCC cell invasion. (a) Expression of DNASE1L3 in various TCGA cancers. Data are shown as log2 (tumor median/normal median). (b) Expression of DNASE1L3 in HCC (n = 371) and adjacent normal tissues (n = 50) in the TCGA_LIHC cohort. Data are shown as median ± quartile in the violin plot. (c) Survival analysis of HCC patients between high and low DNASE1L3 expression groups. (d) Receiver operating characteristic (ROC) curve showing false‐positive fraction and true‐positive fraction of DNASE1L3 expression in the TCGA_LIHC cohort. The AUC is reported. (e) Expression of DNASE1L3 in LO2 hepatocytes and HCC SMMC7721 cells was measured by Western blot assay (n = 3). (f) RNA interference was applied to knock down the expression of DNASE1L3 in LO2 hepatocytes (n = 3). (g) Observation of NETs DNA‐induced invasion between DNASE1L3 knockdown and LO2 hepatocytes (n = 4). Data are shown as mean ± SD ( e–g ).
Figure 5
Figure 5
Downregulation of DNASE1L3 promoted invasive growth of allografts in diabetic nude mice. (a–c) Nude mice were injected intraperitoneally with 1 mg kg−1 lipopolysaccharide to induce NETosis. DNASE1L3 knockdown (KD) and wild‐type (WT) H22 cells were engrafted subcutaneously. Invasive growth of the allografts was monitored for 3 weeks. Before the mice were sacrificed, animal pictures were taken (a). Two allografts (b) were taken out from the nude mice in four groups and measured (c) (mean ± SD, n = 8). (d) Four of diabetic (DM) or control nude mice were sacrificed, and their serum was isolated for measuring NETs DNA. (e) DNASE1L3 knockdown and wildtype H22 cells were subcutaneously engrafted in the diabetic nude mice and underwent a 3‐week growth. The pictures of animals with allografts were taken. (f) Four mice in either group were sacrificed, and the allografts were isolated for weighing. Data are shown as mean ± SD.
Figure 6
Figure 6
Investigation of linkage between DNASE1L3 and HCC cell invasion. The TCGA_LIHC dataset was downloaded using the TCGAbiolinks R package and analysed for differential gene expression with the limma R package. (a) A volcano plot was built using the ggplot2 R package. Dots in the upper right quadrant stand for upregulated genes and the ones in the upper left quadrant stand for downregulated genes. (b) Functional enrichment analysis was conducted by drawing a bubble plot with the ggplot2 R package. KEGG, signalling pathway analysis; GO, gene ontology analysis; BP, biological process; CC, cellular component; MF, molecular function.
Figure 7
Figure 7
Roles of the non‐canonical NF‐κB pathway in HCC cell invasion. (a–d) Gene expression of NF‐κB pathway subunits NFKB2 (a) and RELB (c) in various HCC stages and adjacent normal tissues (Nor). Influence of these genes on the survival of HCC patients in the TCGA_LIHC cohort (b, d). (e, f) NETs DNA‐induced nuclear translocation of RelB in HCC SMMC7721 cells was observed with immunofluorescence imaging under a confocal microscope (n = 4). (g) RNA interference was applied to knock down RELB expression in SMMC7721 cells (n = 3). (h) NETs DNA‐induced invasion was observed between RELB‐downregulated and control SMMC7721 cells (n = 4). Data are shown as mean ± SD.
Figure 8
Figure 8
Roles of MMP9 and SPP1 in non‐canonical NF‐κB‐mediated HCC invasion. (a) The PPI network was constructed to reveal the target genes of the non‐canonical NF‐κB pathway using the STRING online tool. (b–e) In the TCGA_LIHC cohort, gene expression of MMP9 (b) and SPP1 (d) in various HCC stages was quantified, and their influence on survival was analysed (c, e). (f, g) After treatment of HCC SMMC7721 cells with 0.25 μg mL−1 NETs DNA for 48 h, intracellular MMP9 and SPP1 were tested by Western blot assay (n = 3). (h) In the NETotic and control nude mice, DNASE1L3 knockdown (KD) and wild‐type (WT) H22 cells were subcutaneously engrafted, respectively. Three weeks later, the expression of MMP9 and SPP1 was measured by Western blot assay (n = 3). Data are shown as mean ± SD. **P < 0.01 vs. WT in control group. # P < 0.05 vs. WT in NETotic group.
Figure 9
Figure 9
Roles of cGAS in NETs DNA‐triggered HCC invasion. (a) Effects of cGAS on the survival of HCC patients in the TCGA_LIHC cohort. (b) HCC SMMC7721 cells were treated with 0.25 μg mL−1 NETs DNA various times, and then, the content of intracellular cGAMP was measured with a commercial ELISA kit (n = 3). (c) SMMC7721 cells were stimulated with 0.25 μg mL−1 NETs DNA for 48 h, and the location of STING proteins was observed under a confocal microscope. After the exposure of SMMC7721 cells to 0.25 μg mL−1 NETs DNA with/without 20 μg mL−1 RU521 (a cGAS inhibitor), (d) RelB nuclear translocation and (e) cell invasion (n = 4) were observed. (f, g) The diabetic nude mice were administrated with RU521 or vehicle control. After a 3‐week growth, H22 cell allografts were captured (f) and weighed (g). Data are shown as mean ± SD. *P < 0.05, **P < 0.01 vs. Control group. ## P < 0.01 vs. NETs alone group.

Similar articles

Cited by

References

    1. Llovet JM, Kelley RK, Villanueva A et al. Hepatocellular carcinoma. Nat Rev Dis Primers 2021; 7: 6. - PubMed
    1. Yang JD, Hainaut P, Gores GJ, Amadou A, Plymoth A, Roberts LR. A global view of hepatocellular carcinoma: trends, risk, prevention and management. Nat Rev Gastroenterol Hepatol 2019; 16: 589–604. - PMC - PubMed
    1. Yang LY, Luo Q, Lu L et al. Increased neutrophil extracellular traps promote metastasis potential of hepatocellular carcinoma via provoking tumorous inflammatory response. J Hematol Oncol 2020; 13: 3. - PMC - PubMed
    1. Tohme S, Yazdani HO, Al‐Khafaji AB et al. Neutrophil extracellular traps promote the development and progression of liver metastases after surgical stress. Cancer Res 2016; 76: 1367–1380. - PMC - PubMed
    1. Brinkmann V, Reichard U, Goosmann C et al. Neutrophil extracellular traps kill bacteria. Science 2004; 303: 1532–1535. - PubMed