. 2022 Apr 8:19:139-154.
doi: 10.1016/j.bioactmat.2022.03.042. eCollection 2023 Jan.

Amelioration of ligamentum flavum hypertrophy using umbilical cord mesenchymal stromal cell-derived extracellular vesicles

Affiliations

Amelioration of ligamentum flavum hypertrophy using umbilical cord mesenchymal stromal cell-derived extracellular vesicles

Cheng Ma et al. Bioact Mater. .

Abstract

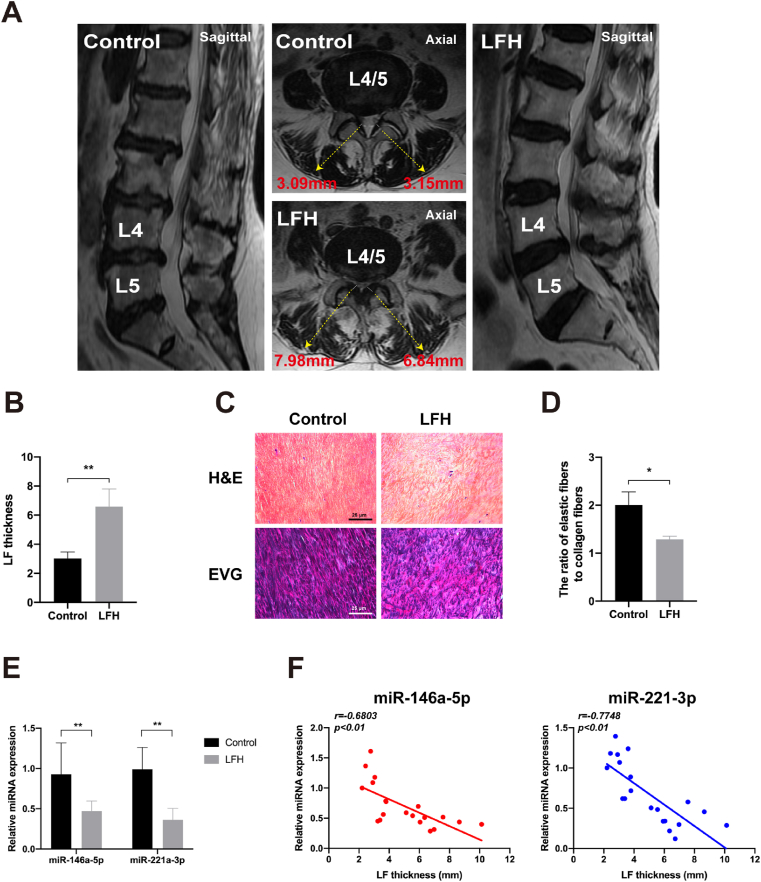
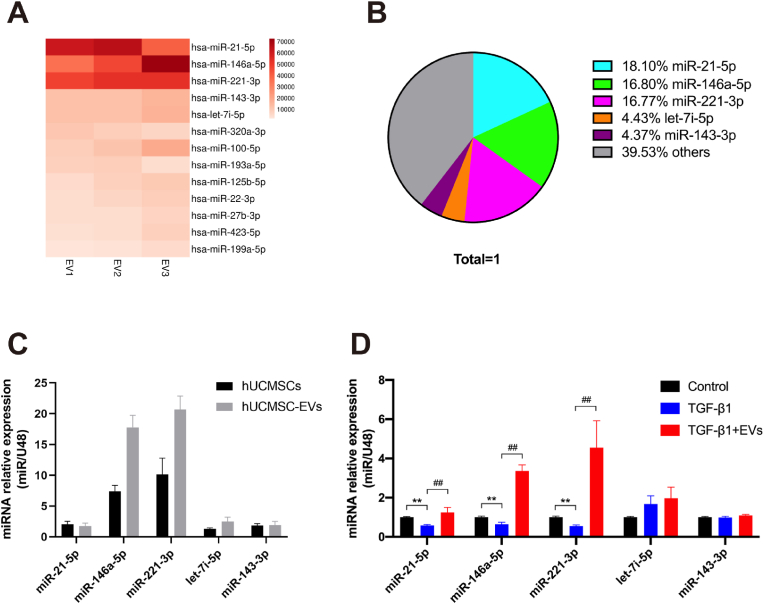
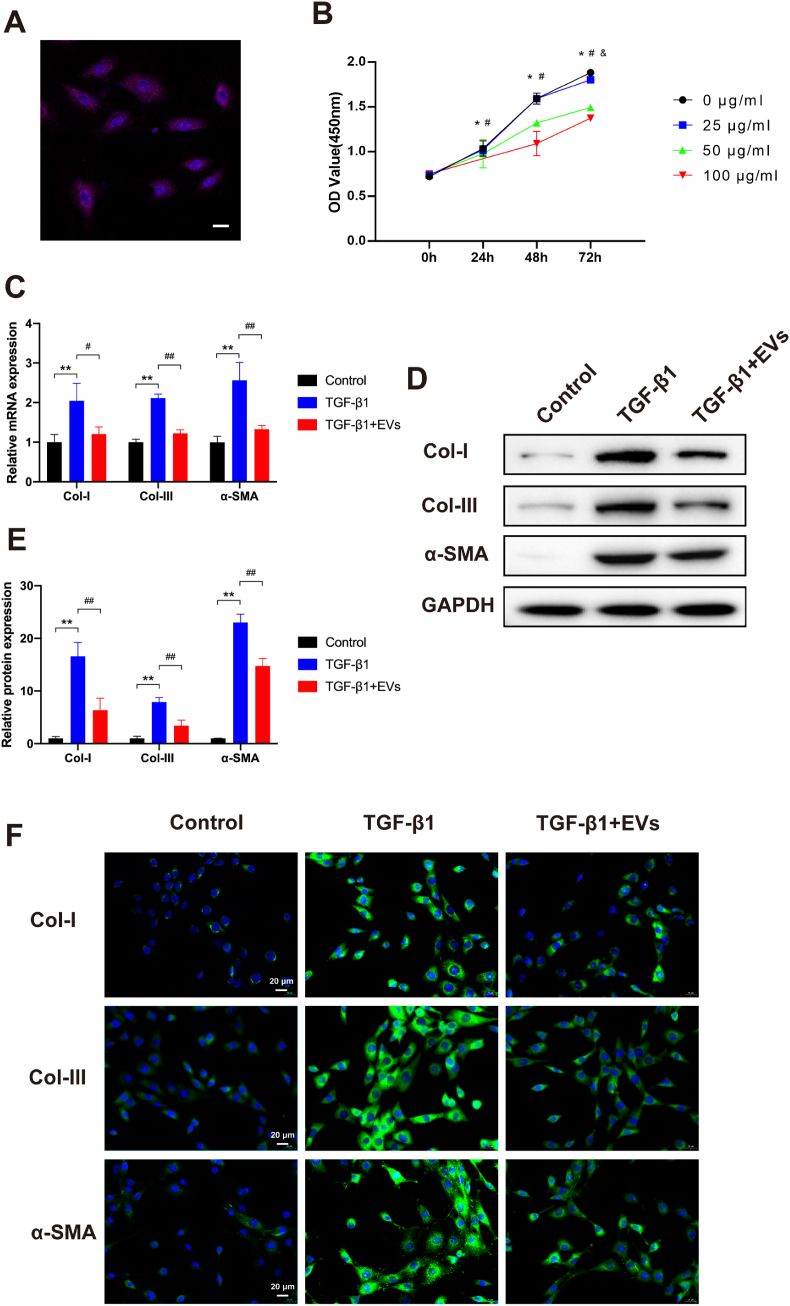
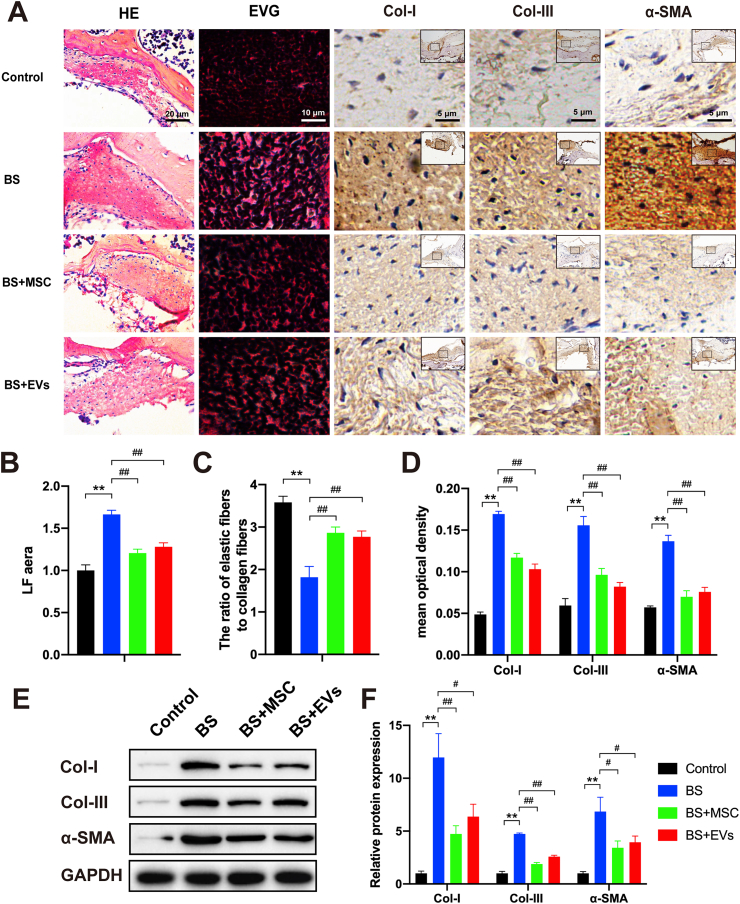
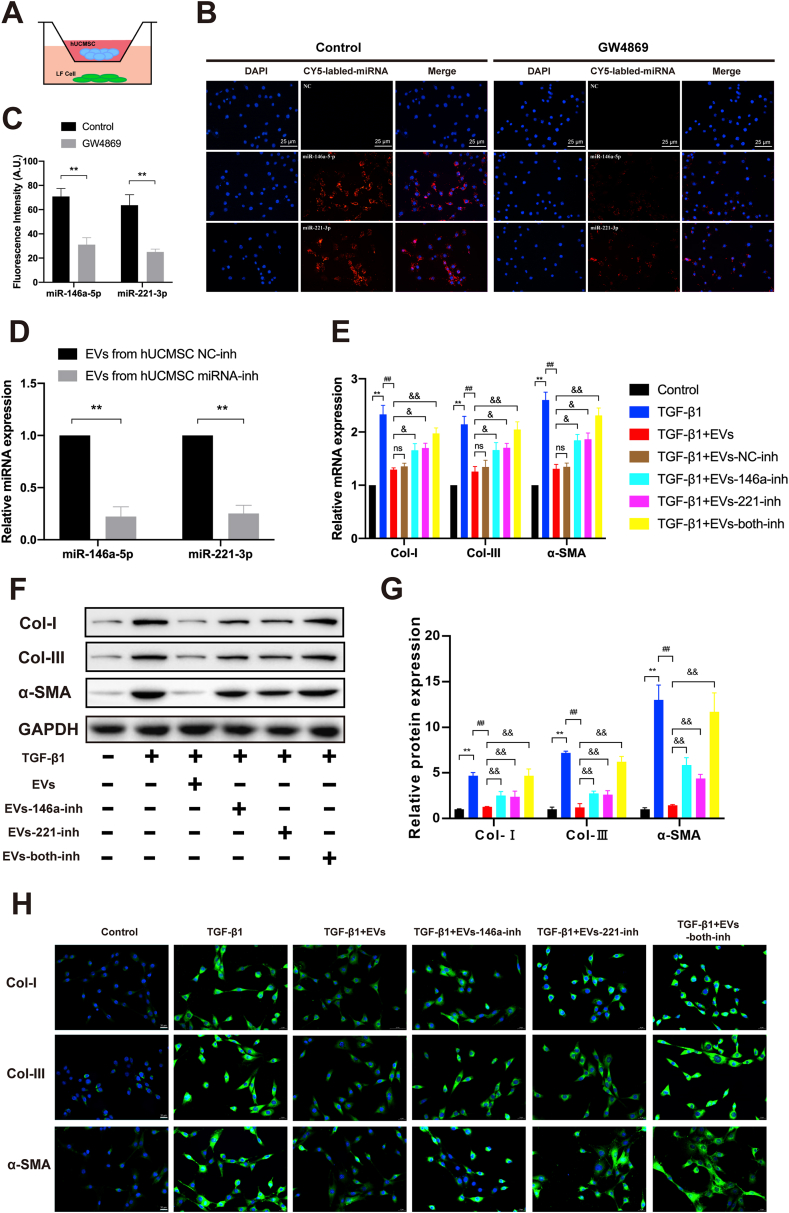
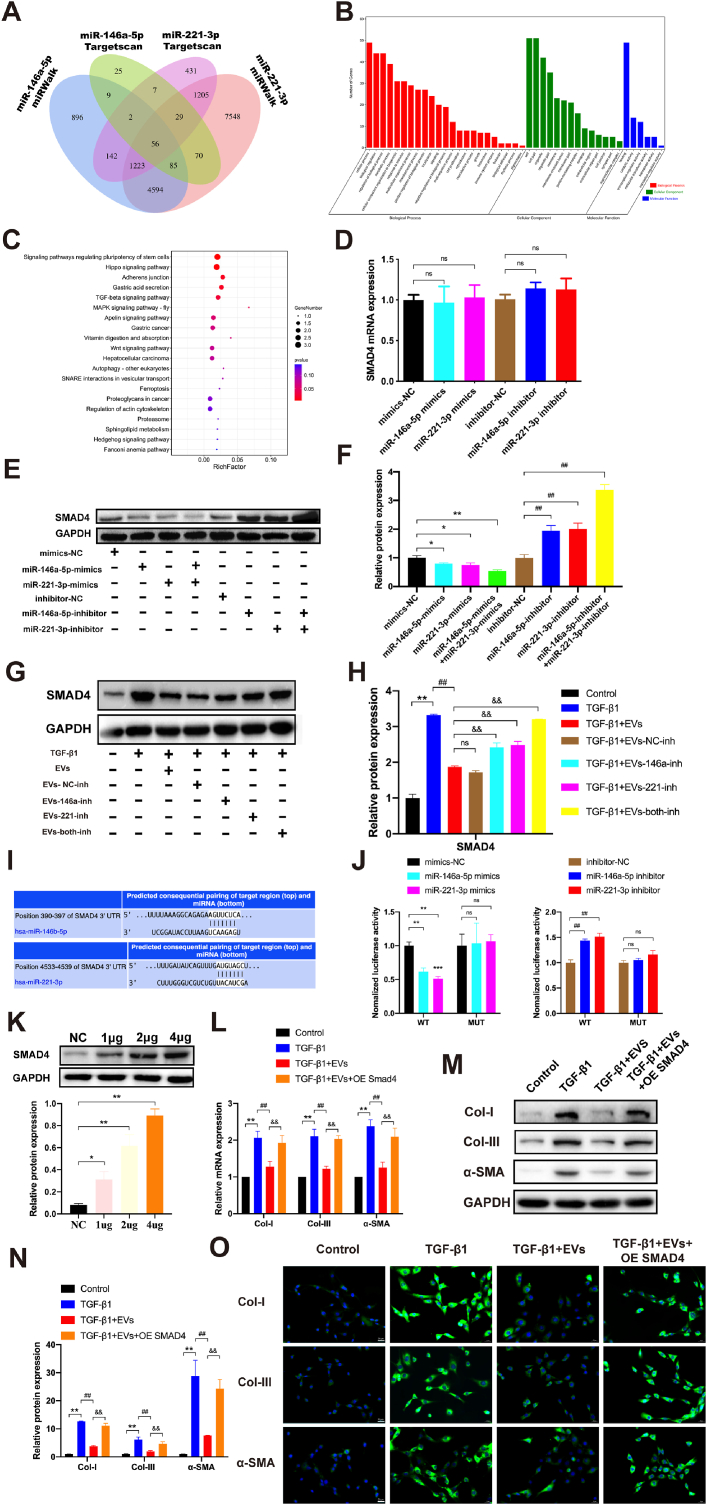
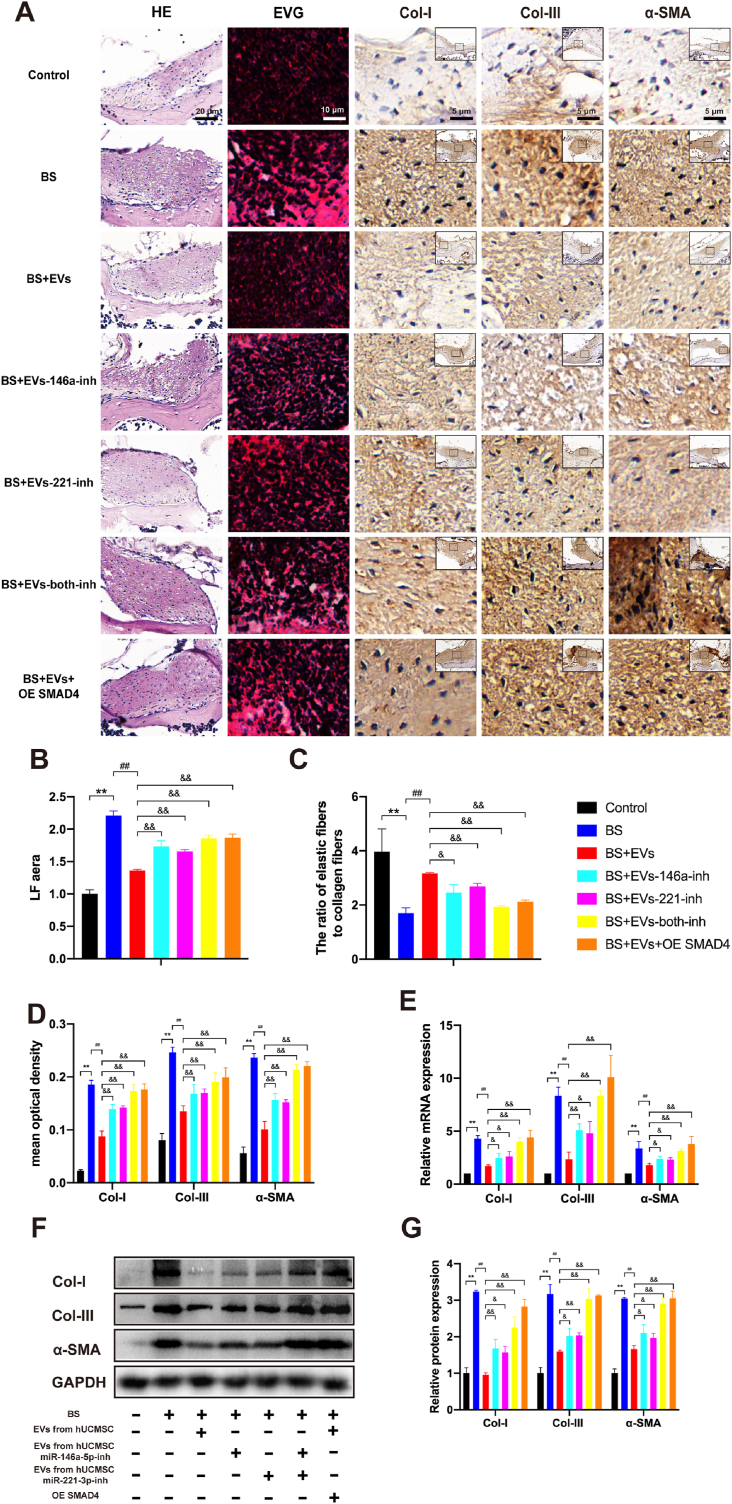
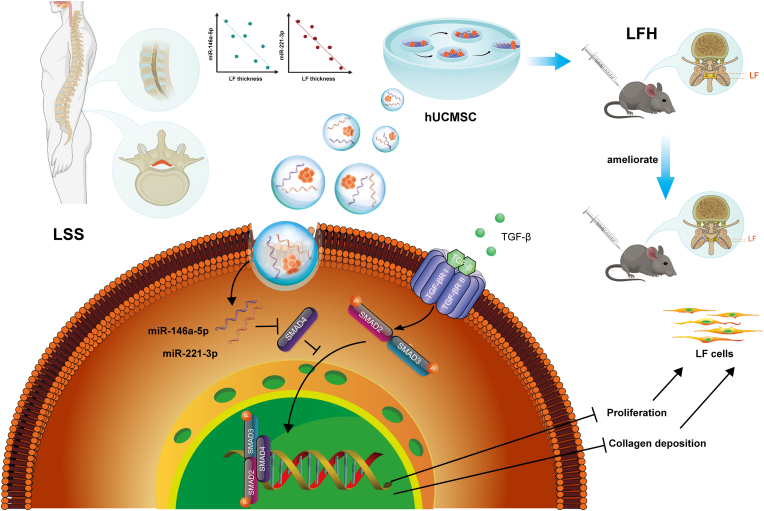
Ligamentum flavum (LF) hypertrophy (LFH) has been recognised as one of the key contributors to lumbar spinal stenosis. Currently, no effective methods are available to ameliorate this hypertrophy. In this study, human umbilical cord mesenchymal stromal cell-derived extracellular vesicles (hUCMSC-EVs) were introduced for the first time as promising vehicles for drug delivery to treat LFH. The downregulation of miR-146a-5p and miR-221-3p expressions in human LF tissues negatively correlated with increased LF thickness. The hUCMSC-EVs enriched with these two miRNAs significantly suppressed LFH in vivo and notably ameliorated the progression of transforming growth factor β1(TGF-β1)-induced fibrosis in vitro after delivering these two miRNAs to mouse LF cells. The results further demonstrated that miR-146a-5p and miR-221-3p directly bonded to the 3'-UTR regions of SMAD4 mRNA, thereby inhibiting the TGF-β/SMAD4 signalling pathway. Therefore, this translational study determined the effectiveness of a hUCMSC-EVs-based approach for the treatment of LFH and revealed the critical target of miR-146a-5p and miR-221-3p. Our findings provide new insights into promising therapeutics using a hUCMSC-EVs-based delivery system for patients with lumbar spinal stenosis.

Keywords: ECM, extracellular matrix; Extracellular vesicle; Fibrosis; LF, Ligamentum flavum; LFH, Ligamentum flavum hypertrophy; LSS, Lumbar spinal stenosis; Ligamentum flavum hypertrophy; MRI, magnetic resonance imaging; SMAD, mothers against the decapentaplegic homolog; TGF-β1, transforming growth factor-β1; Umbilical cord mesenchymal stromal cells; hUCMSC-EVs, human umbilical cord mesenchymal stromal cell-derived extracellular vesicles; miR-146a-5p; miR-221-3p.


Conflict of interest statement

The authors declare that the research was conducted in the absence of any commercial or financial relationships that could be construed as a potential conflict of interest.

Figures

Fig. 1
Fig. 1
MiR-146a-5p and miR-221-3p negatively correlate with LF thickness in humans. (A) LF thickness measurement on representative coronal and sagittal T2-weighted MRI scans of patients diagnosed with lumbar disk herniation (LDH) and lumbar spinal stenosis (LSS). (B) Results of the quantitative analysis of LF thickness between the control and LFH groups. (C) Representative image of the H&E staining (scale bar: 200 μm) and EVG staining (scale bar: 200 μm) of the LF specimens from the control and LFH groups. (D) Results of the quantitative analysis of the ratio of the elastic fibre area to the collagen fibre area. (E) Results of the RT-qPCR analysis of the miRNA expressions of miR-146a-5p and miR-221-3p in the LF specimens of the control and LFH groups. (F) Results of the correlation analysis between miR-146a-5p and miR-221-3p expression levels and LF thickness (n = 20). Data are presented as mean ± SD, *P < 0.05, **P < 0.01, compared with the control group.
Fig. 2
Fig. 2
MiR-146a-5p and miR-221-3p are enriched in hUCMSC-EVs. (A) Heat map of the top 10 most abundant miRNAs in hUCMSC-EVs by miRNA-seq. (B) Relative percentage of miRNAs in total miRNA reads. (C) Results of the RT-PCR analysis of the top five most abundant miRNAs in hUCMSCs and hUCMSC-EVs (n = 3). (D) Results of the RT-PCR analysis of the top five miRNAs in LF cells in the presence or absence of TGF-β1 and hUCMSC-EVs (n = 3). Data are presented as mean ± SD. *P < 0.05, **P < 0.01, compared with the control group. #P < 0.05, ##P < 0.01, compared with the TGF-β1 group.
Fig. 3
Fig. 3
hUCMSC-EVs attenuate LF cell fibrosis. (A) Representative immunofluorescence images of CM-DiI (red)-labelled hUCMSC-EVs internalised by LF cells, the nuclei of which were stained with DAPI (blue). Scale bar: 20 μm. (B) Growth curves of LF cells at different hUCMSC-EVs concentrations (0, 25, 50, and 100 μg/ml) measured with the CCK8 assay at 24, 48, and 72 h (*P < 0.05, 0 μg/ml vs. 25 μg/ml; #P < 0.05, 0 μg/ml vs. 50 μg/ml; &P < 0.05, 0 μg/ml vs. 100 μg/ml). (C) Results of the RT-qPCR analysis of the mRNA expressions of the fibrosis markers (Col-I, α-SMA, and Col-III) in the presence or absence of TGF-β1 and hUCMSC-EVs (n = 3). (D, E) Results of the Western blot analysis of the protein expressions of the fibrosis markers (Col-I, α-SMA, and Col-III) in the presence or absence of TGF-β1 and hUCMSC-EVs (n = 3). (F) Representative immunofluorescence images of the fibrosis markers (Col-I, α-SMA, and Col-III) in the presence or absence of TGF-β1 and hUCMSC-EVs (n = 3). Data are presented as mean ± SD, *P < 0.05, **P < 0.01, compared with the control group. #P < 0.05, ##P < 0.01, compared with the TGF-β1 group. (For interpretation of the references to colour in this figure legend, the reader is referred to the Web version of this article.)
Fig. 4
Fig. 4
hUCMSCs and their EVs suppress LFH in bipedal standing mice. (A) Representative image of the H&E staining (scale bar: 20 μm), EVG staining (scale bar: 10 μm), and immunohistochemistry staining of Col-I, α-SMA, and Col-III (scale bar: 5 μm) in LF specimens treated with hUCMSCs or their EVs in bipedal standing mice (n = 3). (B) Results of the quantitative analysis of the LF area. (C) Quantitative analysis of the ratio of the elastic fibre area to the collagen fibres area. (D) Results of the quantitative analysis of the Col-I-, α-SMA-, and Col–III–positive areas (n = 3). (E, F) Western blot analysis of the protein expressions of the fibrosis markers (Col-I, α-SMA, and Col-III; n = 3). Data are presented as mean ± SD. *P < 0.05, **P < 0.01, compared with the control group. #P < 0.05, ##P < 0.01, compared with the TGF-β1 group.
Fig. 5
Fig. 5
MiR-146a-5p and miR-221-3p could be delivered into LF cells via EVs and ameliorate TGF-β1-induced fibrosis. (A) Schematic diagram of the hUCMSC and LF cell co-culture system. (B) Representative immunofluorescence images of the Cy5-labelled miR-146 a-5p and miR-221–3p transfected into the hUCMSCs treated in the presence or absence of GW4869 (scale bar: 25 μm). (C) The results of the quantitative analysis of the average fluorescence intensity (n = 3) are also shown. (D) Results of the RT-qPCR analysis of miR-146a-5p and miR-221-3p expressions after the transfection of hUCMSCs with NC, miR-146a-5p, and miR-221-3p inhibitors. (E) Results of the RT-qPCR analysis of the mRNA expressions of the fibrosis markers (Col-I, α-SMA, and Col-III) in the presence or absence of TGF-β1 and various modified hUCMSC-EVs (n = 3). (F, G) Western blot analysis of the protein expressions of the fibrosis markers (Col-I, α-SMA, and Col-III) in the presence or absence of TGF-β1 and various modified hUCMSC-EVs (n = 3). (H) Representative immunofluorescence images of the fibrosis markers (Col-I, α-SMA, and Col-III) in the presence or absence of TGF-β1 and various modified hUCMSC-EVs (n = 3). Data are presented as mean ± SD. *P < 0.05, **P < 0.01, compared with the control group. #P < 0.05, ##P < 0.01, compared with the TGF-β1 group. &P < 0.05, &&P < 0.01, compared with the TGF-β1+EV group.
Fig. 6
Fig. 6
hUCMSC-EVs ameliorate TGF-β1-induced LF cell fibrosis by inhibiting TGF-β/SMAD4 signalling through the activities of miR-146a-5p and miR-221-3p. (A) A Venn diagram predicting all common targets of miRNAs with different algorithms. (B) Result of the Gene Ontology analysis of the putative target genes of miR-146a-5p and miR-221-3p. (C) Results of the Kyoto Encyclopedia of Genes and Genomes pathway analysis of the putative target genes of miR-146a-5p and miR-221-3p. (D) Results of the RT-qPCR analysis of the mRNA expression of SMAD4 in LF cells after transfection of miR-146a-5p and miR-221-3p mimics/mimics NC and their inhibitors/inhibitor NC (n = 3). (E, F) Results of the Western blot analysis of the protein expression of SMAD4 in LF cells after transfection of miR-146a-5p and miR-221-3p mimics/mimics NC and their inhibitors/inhibitor NC (n = 3). (G, H) Results of the Western blot analysis of the protein expression of SMAD4 in the presence or absence of TGF-β1 and various modified hUCMSC-EVs (n = 3). (I) Result of the bioinformatic analysis of the predicted binding site of miR-146a-5p and miR-221-3p targeting the 3′-UTR of SMAD4 in TargetScan (http://www.targetscan.org/vert_72/). (J) Luciferase activities detected using a dual-luciferase reporter assay system after mimic-NC, miR-146a-5p mimic, miR-221-3p mimic, inhibitor-NC, miR-146a-5p inhibitor, or miR-221-3p inhibitor and plasmid containing the wild-type or mutant 3′-UTR of SMAD4 were co-transfected into LF cells (n = 3). (K) Results of the Western blot analysis of the protein expression of SMAD4 with different amounts of transfected plasmid DNA (n = 3). (L) Results of the RT-qPCR analysis of the mRNA expressions of the fibrosis markers (Col-I, α-SMA, and Col-III) in the presence or absence of TGF-β1, hUCMSC-EVs, and SMAD4 overexpression (n = 3). (M, N) Results of the Western blot analysis of the protein expressions of the fibrosis markers (Col-I, α-SMA, and Col-III) in the presence or absence of TGF-β1, hUCMSC-EVs, and SMAD4 overexpression (n = 3). (O) Representative immunofluorescence images of the fibrosis markers (Col-I, α-SMA, and Col-III) in the presence or absence of TGF-β1, hUCMSC-EVs, and SMAD4 overexpression (n = 3). Data are presented as mean ± SD. *P < 0.05, **P < 0.01, compared with the control group. #P < 0.05, ##P < 0.01, compared with the TGF-β1 group. &P < 0.05, &&P < 0.01, compared with the TGF-β1+EVs group.
Fig. 7
Fig. 7
hUCMSC-EVs suppress LFH by inhibiting TGF-β/SMAD4 signalling through the activities of miR-146a-5p and miR-221-3p in bipedal standing (BS) mice. (A) Representative image of H&E staining (scale bar: 20 μm), EVG staining (scale bar: 10 μm), and immunohistochemistry staining of Col-I, α-SMA, and Col-III (scale bar: 5 μm) in LF specimens treated with hUCMSC-EVs with or without various modifications or AAV2-SMAD4 in bipedal standing mice (n = 3). Results of the quantitative analysis of the (B) LF area, (C) ratio of the elastic fibre area to the collagen fibre area, and (D) Col-I-, α-SMA-, and Col–III–positive areas. (E) Results of the RT-qPCR analysis of the mRNA expressions of the fibrosis markers (Col-I, α-SMA, and Col-III; n = 3). (F, G) Results of the Western blot analysis of the protein expressions of the fibrosis markers (Col-I, α-SMA, and Col-III; n = 3). Data are presented as mean ± SD. *P < 0.05, **P < 0.01, compared with the control group; #P < 0.05, ##P < 0.01, compared with the BS group; and &P < 0.05, &&P < 0.01, compared with the BS + EVs group.
Fig. 8
Fig. 8
Schematic diagram illustrating the proposed mechanism of the therapeutic ability of hUCMSCs-EVs on the progression of ligamentum flavum hypertrophy. hUCMSC-EVs could suppress LFH in bipedal standing mice in vivo and attenuate the progression of LF cell fibrosis induced by TGF-β1. Moreover, miR-146a-5p and miR-221-3p enriched in hUCMSC-EVs could be delivered to LF cells to prevent proliferation and excessive deposition of connective tissue in the extracellular matrix via direct targeting of SMAD4, resulting in the attenuation of LFH.

References

    1. Kalichman L., Cole R., Kim D.H., Li L., Suri P., Guermazi A., et al. Spinal stenosis prevalence and association with symptoms: the Framingham Study. Spine J. 2009;9(7):545–550. doi: 10.1016/j.spinee.2009.03.005. - DOI - PMC - PubMed
    1. Wang G., Peng Z., Li J., Song Z., Wang P. Diagnostic performance of the nerve root sedimentation sign in lumbar spinal stenosis: a systematic review and meta-analysis. Neuroradiology. 2019;61(10):1111–1121. doi: 10.1007/s00234-019-02248-3. - DOI - PubMed
    1. Lai M.K.L., Cheung P.W.H., Cheung J.P.Y. A systematic review of developmental lumbar spinal stenosis. Eur. Spine J. 2020;29(9):2173–2187. doi: 10.1007/s00586-020-06524-2. - DOI - PubMed
    1. Lafian A.M., Torralba K.D. Lumbar spinal stenosis in older adults. Rheum. Dis. Clin. N. Am. 2018;44(3):501–512. doi: 10.1016/j.rdc.2018.03.008. - DOI - PubMed
    1. Sakai Y., Ito S., Hida T., Ito K., Harada A., Watanabe K. Clinical outcome of lumbar spinal stenosis based on new classification according to hypertrophied ligamentum flavum. J. Orthop. Sci. 2017;22(1):27–33. doi: 10.1016/j.jos.2016.08.007. - DOI - PubMed

LinkOut - more resources