. 2022 Mar 15;2(3):100182.
doi: 10.1016/j.crmeth.2022.100182. eCollection 2022 Mar 28.

PeakVI: A deep generative model for single-cell chromatin accessibility analysis

Affiliations

PeakVI: A deep generative model for single-cell chromatin accessibility analysis

Tal Ashuach et al. Cell Rep Methods. .

Abstract

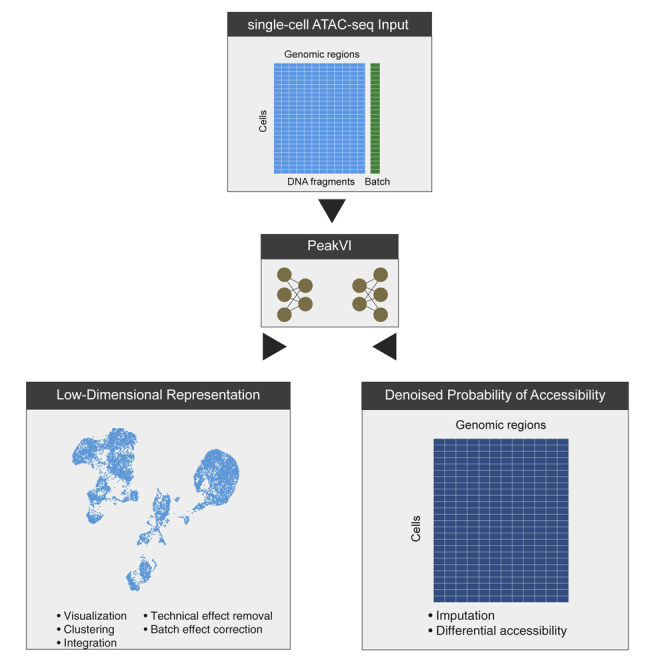
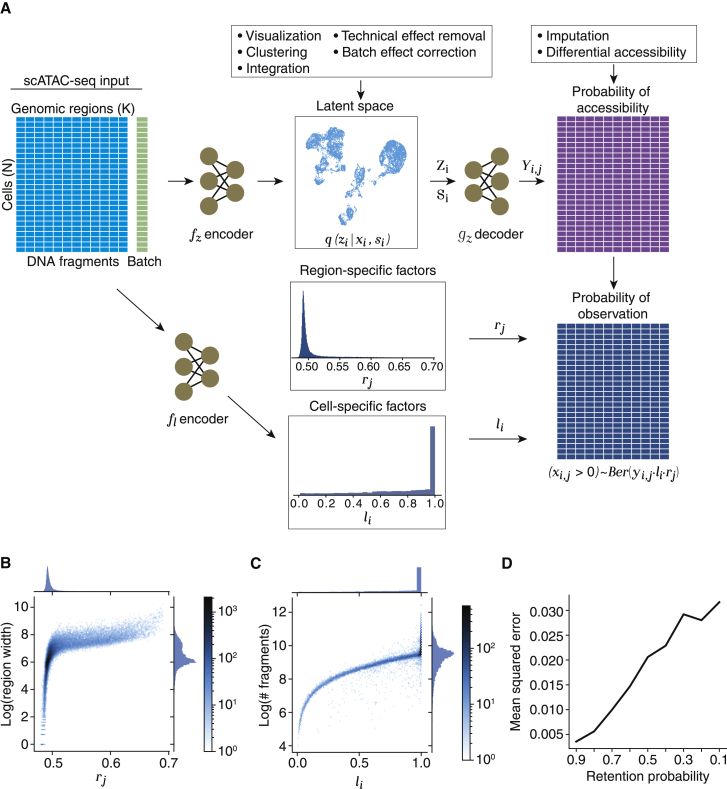
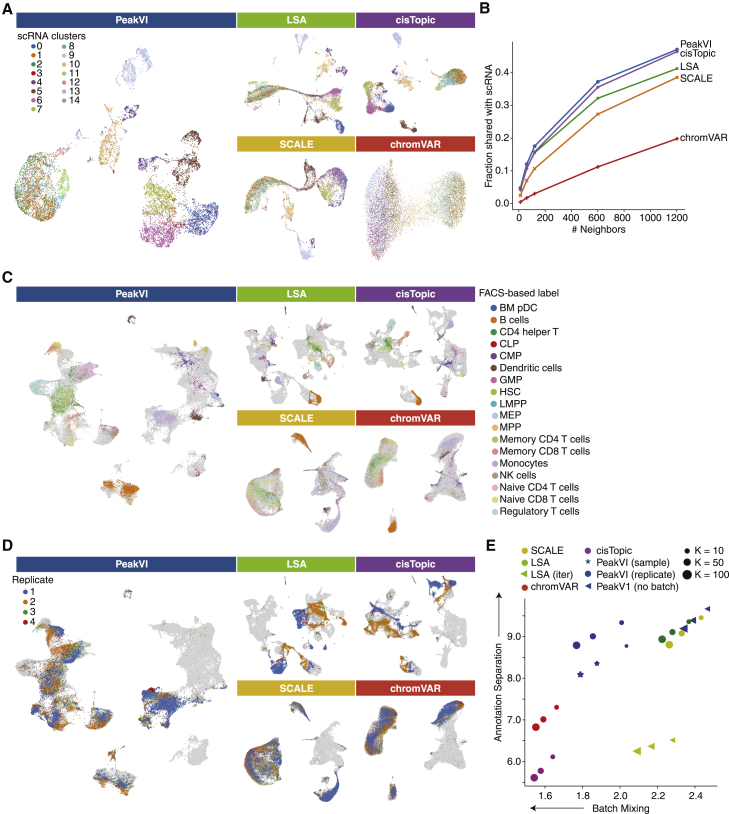
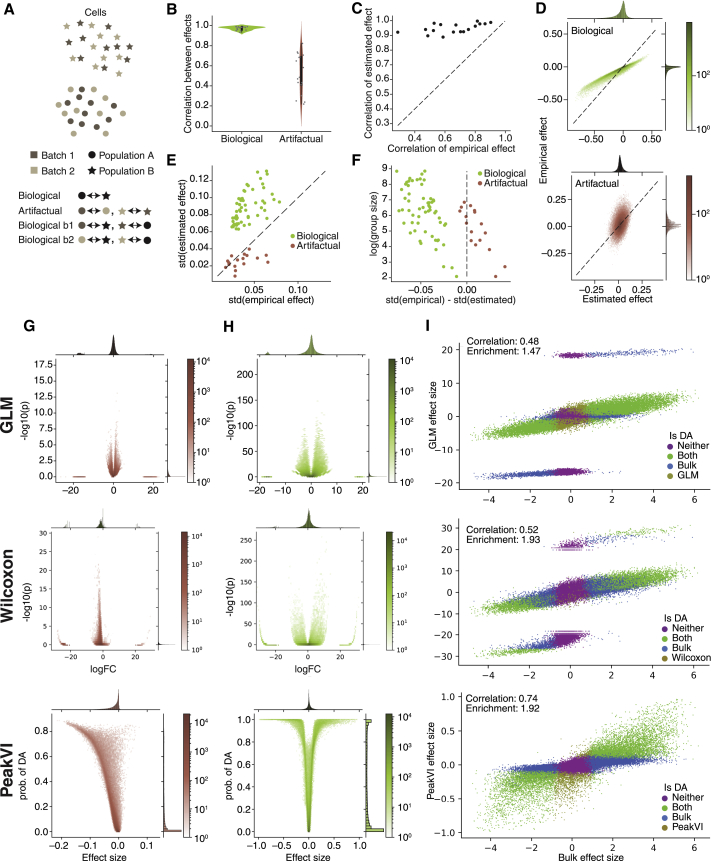
Single-cell ATAC sequencing (scATAC-seq) is a powerful and increasingly popular technique to explore the regulatory landscape of heterogeneous cellular populations. However, the high noise levels, degree of sparsity, and scale of the generated data make its analysis challenging. Here, we present PeakVI, a probabilistic framework that leverages deep neural networks to analyze scATAC-seq data. PeakVI fits an informative latent space that preserves biological heterogeneity while correcting batch effects and accounting for technical effects, such as library size and region-specific biases. In addition, PeakVI provides a technique for identifying differential accessibility at a single-region resolution, which can be used for cell-type annotation as well as identification of key cis-regulatory elements. We use public datasets to demonstrate that PeakVI is scalable, stable, robust to low-quality data, and outperforms current analysis methods on a range of critical analysis tasks. PeakVI is publicly available and implemented in the scvi-tools framework.

Keywords: deep learning; single-cell ATAC-seq; single-cell chromatin accessibility; single-cell genomics.


Conflict of interest statement

All authors declare no competing interests.

Figures

None
Graphical abstract
Figure 1
Figure 1
PeakVI model overview (A) Conceptual model illustration. The input region-by-cell count matrix (left) is estimated as the product of region-specific effects (center top), cell-specific effects (center), and accessibility probability estimates (center bottom). The observation probability matrix (right) is used to calculate the likelihood of the data for optimization. (B) The region-specific factor rj is assigned higher values for wider regions, indicating a higher probability of those regions being fragmented. (C) The cell-specific factor i increases with the number of fragments up to a saturation point. Cells with sufficient fragments are not penalized even if other cells have significantly more fragments. (D) Random corruption of the data at increasing rates leads to a small but steady increase in the mean squared error (measured from corrupted indices). See also Figures S1A and S1B; Table S1.
Figure 2
Figure 2
UMAP visualizations of latent representations from PeakVI, LSA, cisTopic, SCALE, and chromVAR (A) The paired scRNA-scATAC sample PBMC dataset from 10× Genomics. Cells are colored based on the scRNA-based clustering; umaps are computed from the scATAC representations. All methods except for chromVAR are comparably consistent with the scRNA data. (B) Quantitative consistency of the latent representation with the scRNA data; fraction of the K-nearest neighbors in the scATAC representation that are also among the K-nearest neighbors in the scRNA representation, for various values of K. PeakVI marginally outperforms cisTopic, followed by LSA, SCALE, and chromVAR. (C) Data from Satpathy et al. (2019); cells are colored using the FACS-based cell-type-specific labels. Cells from unsorted samples or non-specific sorted samples are colored in light gray. PeakVI, LSA, and cisTopic all achieve good separation of cell types. (D) Data from Satpathy et al. (2019); cells are colored using the unsorted PBMC replicates. Cells from all other samples are colored in light gray. Batch effects are reduced with PeakVI, chromVAR, and SCALE. (E) Enrichment of labels among the K-nearest neighbors for each cell; the x axis is the enrichment of batch labels, where lower enrichment indicates better batch mixing. The y axis is the enrichment of cell-type labels, where higher enrichment indicates better separation. PeakVI reaches a better balance of the two tasks. See also Figures S2A, S2B, and S3.
Figure 3
Figure 3
Differential accessibility analysis with PeakVI (A) Illustration of the different comparisons. “real,” compare cells between two population; “null,” compare cells from different batches within a single population; “real b1”/“real b2,” compare cells from a specific batch in a population to all cells in the other population. (B) Pearson correlations between the estimated and empirical effects. (C) Correlation of effect size in “real b1” and corresponding effect in “real b2” comparisons. PeakVI estimated effects are far less sensitive to batch effects. (D) An example (using cluster 14) relationship between the PeakVI estimated effect to the empirical effect in real (top) and null (bottom) comparisons. (E) The width (measured by the SD) of the effect distributions; PeakVI amplifies real differential effects, and silences nuisance ones. (F) Level of amplification/silencing depends on level of noise in the empirical effect. (G) Volcano plots for a GLM (top), Wilcoxon (middle), and PeakVI (bottom) when comparing between two batches of NK cells. (H) Volcano plots for a GLM (top), Wilcoxon (middle), and PeakVI (bottom) when comparing between B cells and NK cells. (I) PeakVI (bottom) effect is better correlated with a bulk ATAC-based ground truth comparison and more numerically stable than GLM (top) and Wilcoxon (middle). See also Figure S4A and Table S2.
Figure 4
Figure 4
PeakVI unlocks multiple paths for annotation and identification (A–C) PeakVI supports transfer learning. (A) Mapping of query data (sample PBMC data from 10× Genomics) onto reference data (from Satpathy et al., 2019). PeakVI mixes the query data with the reference despite the data being generated by a different protocol and processed by a different pipeline. (B) The reference data, colored by FACS-based cell-type-specific labels. (C) The query data, colored by the transferred cell-type-specific labels. (D–F) De novo annotation using PeakVI’s differential accessibility analysis. (D) Hematopoiesis data colored by clusters. (E) Regions that are preferentially accessible in each cluster were analyzed for enriched cell-type signatures from ARCHS (Lachmann et al., 2018) signatures, using enrichr (Chen et al., 2013; Kuleshov et al., 2016). Heatmap shows distribution of cell-type-specific labels for each cluster, normalized by row. (F) Volcano plot for a differential accessibility analysis between the two B cell clusters (clusters 13 and 17). (G) Volcano plot for only significant regions, labeled by associated genes that are implicated in naive B cells (red) and memory B cells (blue). See also Figures S4B and S4C.

References

    1. Boyle A.P., Davis S., Shulha H.P., Meltzer P., Margulies E.H., Weng Z., Furey T.S., Crawford G.E. High-resolution mapping and characterization of open chromatin across the genome. Cell. 2008;132:311–322. - PMC - PubMed
    1. Buenrostro J.D., Wu B., Chang H.Y., Greenleaf W.J. ATAC-seq: a method for assaying chromatin accessibility genome-wide. Curr. Protoc. Mol. Biol. 2015;109:21.29.1–21.29.9. - PMC - PubMed
    1. Buenrostro J.D., Wu B., Litzenburger U.M., Ruff D., Gonzales M.L., Snyder M.P., Chang H.Y., Greenleaf W.J. Single-cell chromatin accessibility reveals principles of regulatory variation. Nature. 2015;523:486–490. - PMC - PubMed
    1. Calderon D., Nguyen M.L.T., Mezger A., Kathiria A., Müller F., Nguyen V., Lescano N., Wu B., Trombetta J., Ribado J.V., et al. Landscape of stimulation-responsive chromatin across diverse human immune cells. Nat. Genet. 2019;51:1494–1505. - PMC - PubMed
    1. Carlson M., Maintainer B.P. 2015. TxDb.Hsapiens.UCSC.hg19.knownGene: Annotation package for TxDb object(s). (R package version 3.2.2.) https://bioconductor.org/packages/release/data/annotation/html/TxDb.Hsap....

Publication types

MeSH terms

LinkOut - more resources