. 2021 Jun 21;1(2):100038.
doi: 10.1016/j.crmeth.2021.100038.

CUBIC-Cloud provides an integrative computational framework toward community-driven whole-mouse-brain mapping

Affiliations

CUBIC-Cloud provides an integrative computational framework toward community-driven whole-mouse-brain mapping

Tomoyuki Mano et al. Cell Rep Methods. .

Abstract

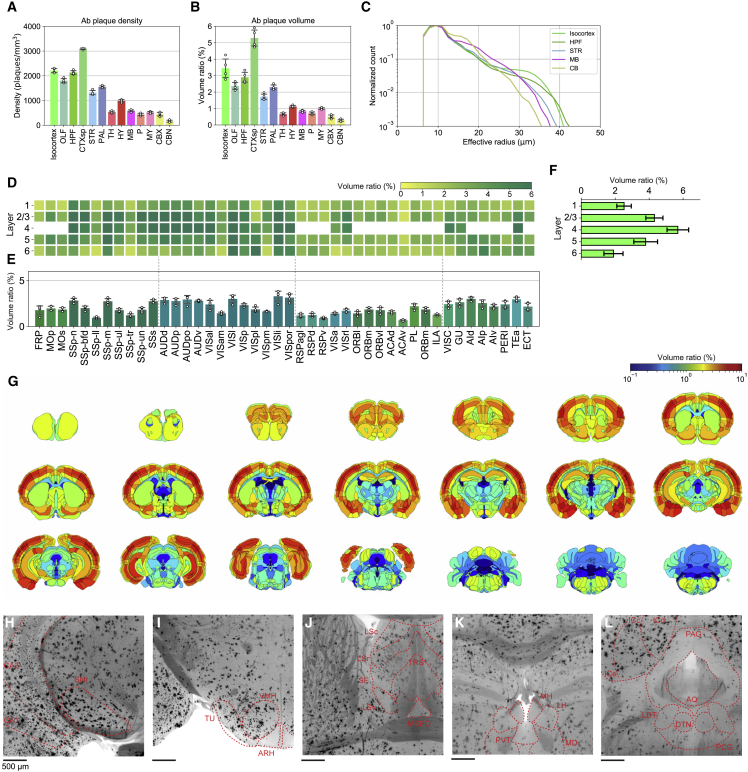
Recent advancements in tissue clearing technologies have offered unparalleled opportunities for researchers to explore the whole mouse brain at cellular resolution. With the expansion of this experimental technique, however, a scalable and easy-to-use computational tool is in demand to effectively analyze and integrate whole-brain mapping datasets. To that end, here we present CUBIC-Cloud, a cloud-based framework to quantify, visualize, and integrate mouse brain data. CUBIC-Cloud is a fully automated system where users can upload their whole-brain data, run analyses, and publish the results. We demonstrate the generality of CUBIC-Cloud by a variety of applications. First, we investigated the brain-wide distribution of five cell types. Second, we quantified Aβ plaque deposition in Alzheimer's disease model mouse brains. Third, we reconstructed a neuronal activity profile under LPS-induced inflammation by c-Fos immunostaining. Last, we show brain-wide connectivity mapping by pseudotyped rabies virus. Together, CUBIC-Cloud provides an integrative platform to advance scalable and collaborative whole-brain mapping.

Keywords: Alzheimer's disease; Kiss1; LPS; arcuate nucleus of the hypothalamus; c-Fos; cloud computing; inflammation; light-sheet fluorescence microscopy; rabies virus; tissue clearing.


Conflict of interest statement

T.M., R.G.Y., and E.A.S are employees of CUBICStars, Inc. H.R.U. is a founder and CTO of CUBICStars, Inc. T.M. and H.R.U. are co-inventors on patent applications filed by CUBICStars, Inc., regarding the CUBIC-Cloud framework. CUBIC-Cloud web service is provided and maintained by CUBICStars, Inc. H.R.U. is a co-inventor on patents and patent applications owned or filed by RIKEN covering the CUBIC reagents.

Figures

None
Graphical abstract
Figure 1
Figure 1
CUBIC-Cloud: A cloud-based computational framework for whole mouse brain analysis Overview of the whole-brain analysis pipeline by CUBIC-Cloud. In this study, mouse brains were cleared by CUBIC-L and CUBIC-R+ reagents and 3D stained by the CUBIC-HV protocol. Cleared brains were imaged by using macro-zoom LSFM. From the obtained image stacks, single cells were isolated by using ilastik software, converting the raw raster image into an ensemble of discrete cells (i.e., point cloud). Users then upload the point-cloud cells and structure image to CUBIC-Cloud. In the cloud, brain registration is automatically performed to align individual brains with the reference brain. Thereby, the user's own brain database is constructed. Then, the user can perform various kinds of brain-wide quantification using “notebook.” CUBIC-Cloud also offers an interactive 3D whole-brain viewer (“studio”). Last, CUBIC-Cloud lets users share and publish their point-cloud whole-brain data, as well as notebooks and studios, to allow broad access to researchers. Abbreviation are as follows: AAV/RV, adeno-associated virus/rabies virus; IEGs, immediate-early genes.
Figure 2
Figure 2
Whole-brain analysis of PV-, SST-, ChAT-, and TH-expressing cells Whole-brain distribution of PV-, SST-, ChAT-, TH-, and Iba1-expressing cells was investigated by applying 3D immunostaining and by using the CUBIC-Cloud analysis framework. (A–F) Whole-brain views of labeled cells. Each point (i.e., single cell) was assigned a pseudo-color on the basis of its fluorescence intensity. (A) Merge, (B) PV, (C) SST, (D) ChAT, (E) TH, (F) Iba1. (G) Relative population heatmap of all brain regions outside the isocortex. The number of each cell type was normalized by the total number of cells in each region, derived from CUBIC-Atlas (n = 4 for PV, SST, ChAT, and TH; n = 7 for Iba1). (H) Density of PV- and SST-expressing cells in the isocortex. Data are shown as the mean ± SD (n = 4). (I) From the cluster of ChAT-expressing cells, the boundary surface including LDT was extracted (n = 4). (J) From the cluster of TH-expressing cells, the boundary surface including LC was extracted (n = 4). (K) Merge of the two boundary surfaces ( color coding is as follows: yellow, ChAT; magenta, TH; cyan, overlapping region). (L) The volume overlaps of the boundary surfaces. Data are shown as mean ± SD (n = 4). Brain region acronyms follow the ontology defined by the Allen Brain Atlas.
Figure 3
Figure 3
Whole-brain analysis of Aβ plaque accumulation in an AD model mouse brain Using the AppNL-G-F/NL-G-F AD model mouse brain (9 to 10 months of age), brain-wide accumulation of Aβ plaques was quantified by applying whole-mount 3D immunostaining and by using the CUBIC-Cloud analysis framework. (A) Density of Aβ plaques (number of plaques/mm3) in major brain divisions (n = 4). Data are shown as the mean ± SD (n = 4). (B) Volume ratio of Aβ plaques in major brain divisions (n = 4), computed as (total plaque volume in the region)/(region volume). Data are shown as the mean ± SD (n = 4). (C) Distribution of effective radius of Aβ plaques in the isocortex, hippocampus (HPF), striatum (STR), midbrain (MB), and cerebellum (CB) (n = 4). (D and E) The volume ratio of Aβ plaques in the isocortex (n = 4). In (E), data are shown as the mean ± SD. (F) Layer-wise average of (D). Data are shown as the mean ± SD (n = 4). (G) Cartoon heatmaps showing the Aβ plaque volume ratio in each brain region (n = 4). (H–L) Raw 6E10 immunostaining images around SNr (H), VMH (I), TRS and MEPO (J), LDT and DTN (K), and MH, LH, and PVT (L).
Figure 4
Figure 4
Whole-brain analysis of c-Fos expression level changes by LPS administration LPS acutely induces sleep in mice. Brain-wide neural activity change induced by LPS was quantified by applying whole-mount 3D immunostaining of c-Fos and by using the CUBIC-Cloud analysis framework. (A) Whole-brain views of all c-Fos+ cells, showing saline- (top) and LPS- (bottom) administered brains. Each point (i.e., single cell) was assigned a pseudo-color based on its fluorescence intensity. (B) Magnified 3D views of (A), where the left isocortex is selectively displayed. Orientation arrows stand for R (right), D (dorsal), and P (posterior). (C) A p value heatmap showing the isocortex regions whose c-Fos+ cell density was significantly affected by LPS (n = 4 each). The p value was computed by comparing the c-Fos+ cell count. The color lookup table is log scaled (base 10), where red represents the regions that were activated (i.e., more c-Fos+ cells) by LPS, and blue represents the repressed regions. Regions with no statistical significance (p > 0.05) were assigned a gray color. (D) Distinct brain regions activated by LPS (n = 4 each). The top row shows the voxel-wise p value map. Color lookup table follows that of (C). The second and third rows are the raw c-Fos images of saline- and LPS-administered groups, respectively. The fourth row shows the number of c-Fos+ cells of the identified regions. Data are shown and mean ± SD (n = 4). (E) Plot of c-Fos+ cells in PVT. Cells are pseudo-colored with their intensity values. Pink (blue) dots are from LPS (saline)-administered brains, respectively. (F) The number of c-Fos+ cells in the PVT in 10 divisions along the anterior-posterior (AP) axis. Data are shown and mean ± SD (n = 4). (G) The number of c-Fos+ cells in the anterior and posterior half of the PVT. The boundary between anterior and posterior regions was set at the center of the PVT along the AP axis. Data are shown and mean ± SD (n = 4). (H) The c-Fos expression levels per cell in the PVT, 10 divisions along the AP axis. Data are shown and mean ± SD (n = 4). (I) The c-Fos expression levels per cell in the anterior and posterior halves of the PVT. Data are shown and mean ± SD (n = 4). ∗p<0.05, ∗∗p<0.01, Welch's t test. Brain region acronyms follow the ontology defined by the Allen Brain Atlas.
Figure 5
Figure 5
Whole-brain analysis of input cell populations projecting to ARHKiss1+ neurons (A) Virus injection scheme. AAV carrying mCherry, TVA receptor, and optimized glycoprotein (oG) was injected into the ARH of Kiss1-Cre transgenic mouse, followed by injection of modified rabies virus carrying GFP. Cells expressing both mCherry and GFP are the starter cells. (B) Quantification of starter cell localization. The ratio was computed by dividing the cell count in each region by the total number of starter cells. The total number of starter cells in each sample is shown on the right end of the heatmap. (C) Whole-brain view of all input cells. (D) Total cell count and the distribution of input cells. Only male brains were considered here. (E) Cell-density heatmap of all brain regions (excluding the isocortex and cerebellum, where virtually no input cells were detected). The means of male and female brains are shown. (F) The plot shows extremely sparse input cell populations in previously unidentified brain regions (n = 3). Only male brains were considered here. Data are shown and mean ± SD (n = 3). (G) Raw GFP (black) and nuclear staining (RedDot2, purple) images showing the regions identified in (F). Macro views (top) and zoomed-in views (of boxed areas; bottom) are shown. Brain region acronyms follow the ontology defined by the Allen Brain Atlas.

References

    1. Adzic G., Chatley R. Proceedings of the 2017 11th Joint Meeting on Foundations of Software Engineering - ESEC/FSE. ACM Press; 2017. Serverless computing: economic and architectural impact; pp. 884–889.
    1. Armstrong D.M., Saper C.B., Levey A.I., Wainer B.H., Terry R.D. Distribution of cholinergic neurons in rat brain: demonstrated by the immunocytochemical localization of choline acetyltransferase. J. Comp. Neurol. 1983;216:53–68. - PubMed
    1. Ascoli G.A., Donohue D.E., Halavi M. NeuroMorpho.Org: a central resource for neuronal morphologies. J. Neurosci. 2007;27:9247–9251. - PMC - PubMed
    1. Avants B.B., Epstein C.L., Grossman M., Gee J.C. Symmetric diffeomorphic image registration with cross-correlation: evaluating automated labeling of elderly and neurodegenerative brain. Med. Image Anal. 2008;12:26–41. - PMC - PubMed
    1. Bannon D., Moen E., Schwartz M., Borba E., Cui S., Huang K., Camplisson I., Koe N., Kyme D., Kudo T., et al. Dynamic allocation of computational resources for deep learning-enabled cellular image analysis with Kubernetes. bioRxiv. 2019:505032.

Publication types