. 2022 Apr 1;5(4):e229178.
doi: 10.1001/jamanetworkopen.2022.9178.

Association of Socioeconomic Status and Infarct Volume With Functional Outcome in Patients With Ischemic Stroke

Affiliations

Association of Socioeconomic Status and Infarct Volume With Functional Outcome in Patients With Ischemic Stroke

Ahmed Ghoneem et al. JAMA Netw Open. .

Abstract

Importance: Long-term disability after stroke is associated with socioeconomic status (SES). However, the reasons for such disparities in outcomes remain unclear.

Objective: To assess whether lower SES is associated with larger admission infarct volume and whether initial infarct volume accounts for the association between SES and long-term disability.

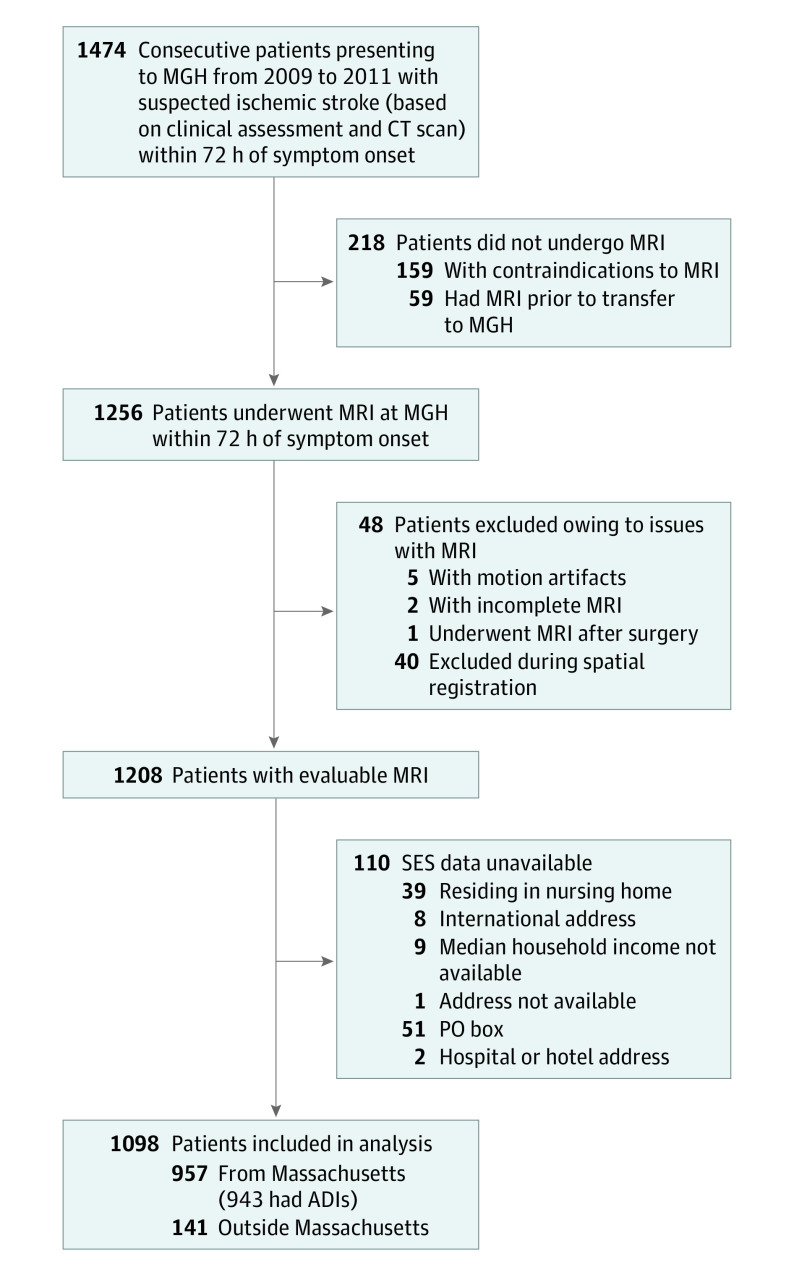
Design, setting, and participants: This cohort study was conducted in a prospective, consecutive population (n = 1256) presenting with acute ischemic stroke who underwent magnetic resonance imaging (MRI) within 24 hours of admission. Patients were recruited in Massachusetts General Hospital, Boston, from May 31, 2009, to December 31, 2011. Data were analyzed from May 1, 2019, until June 30, 2020.

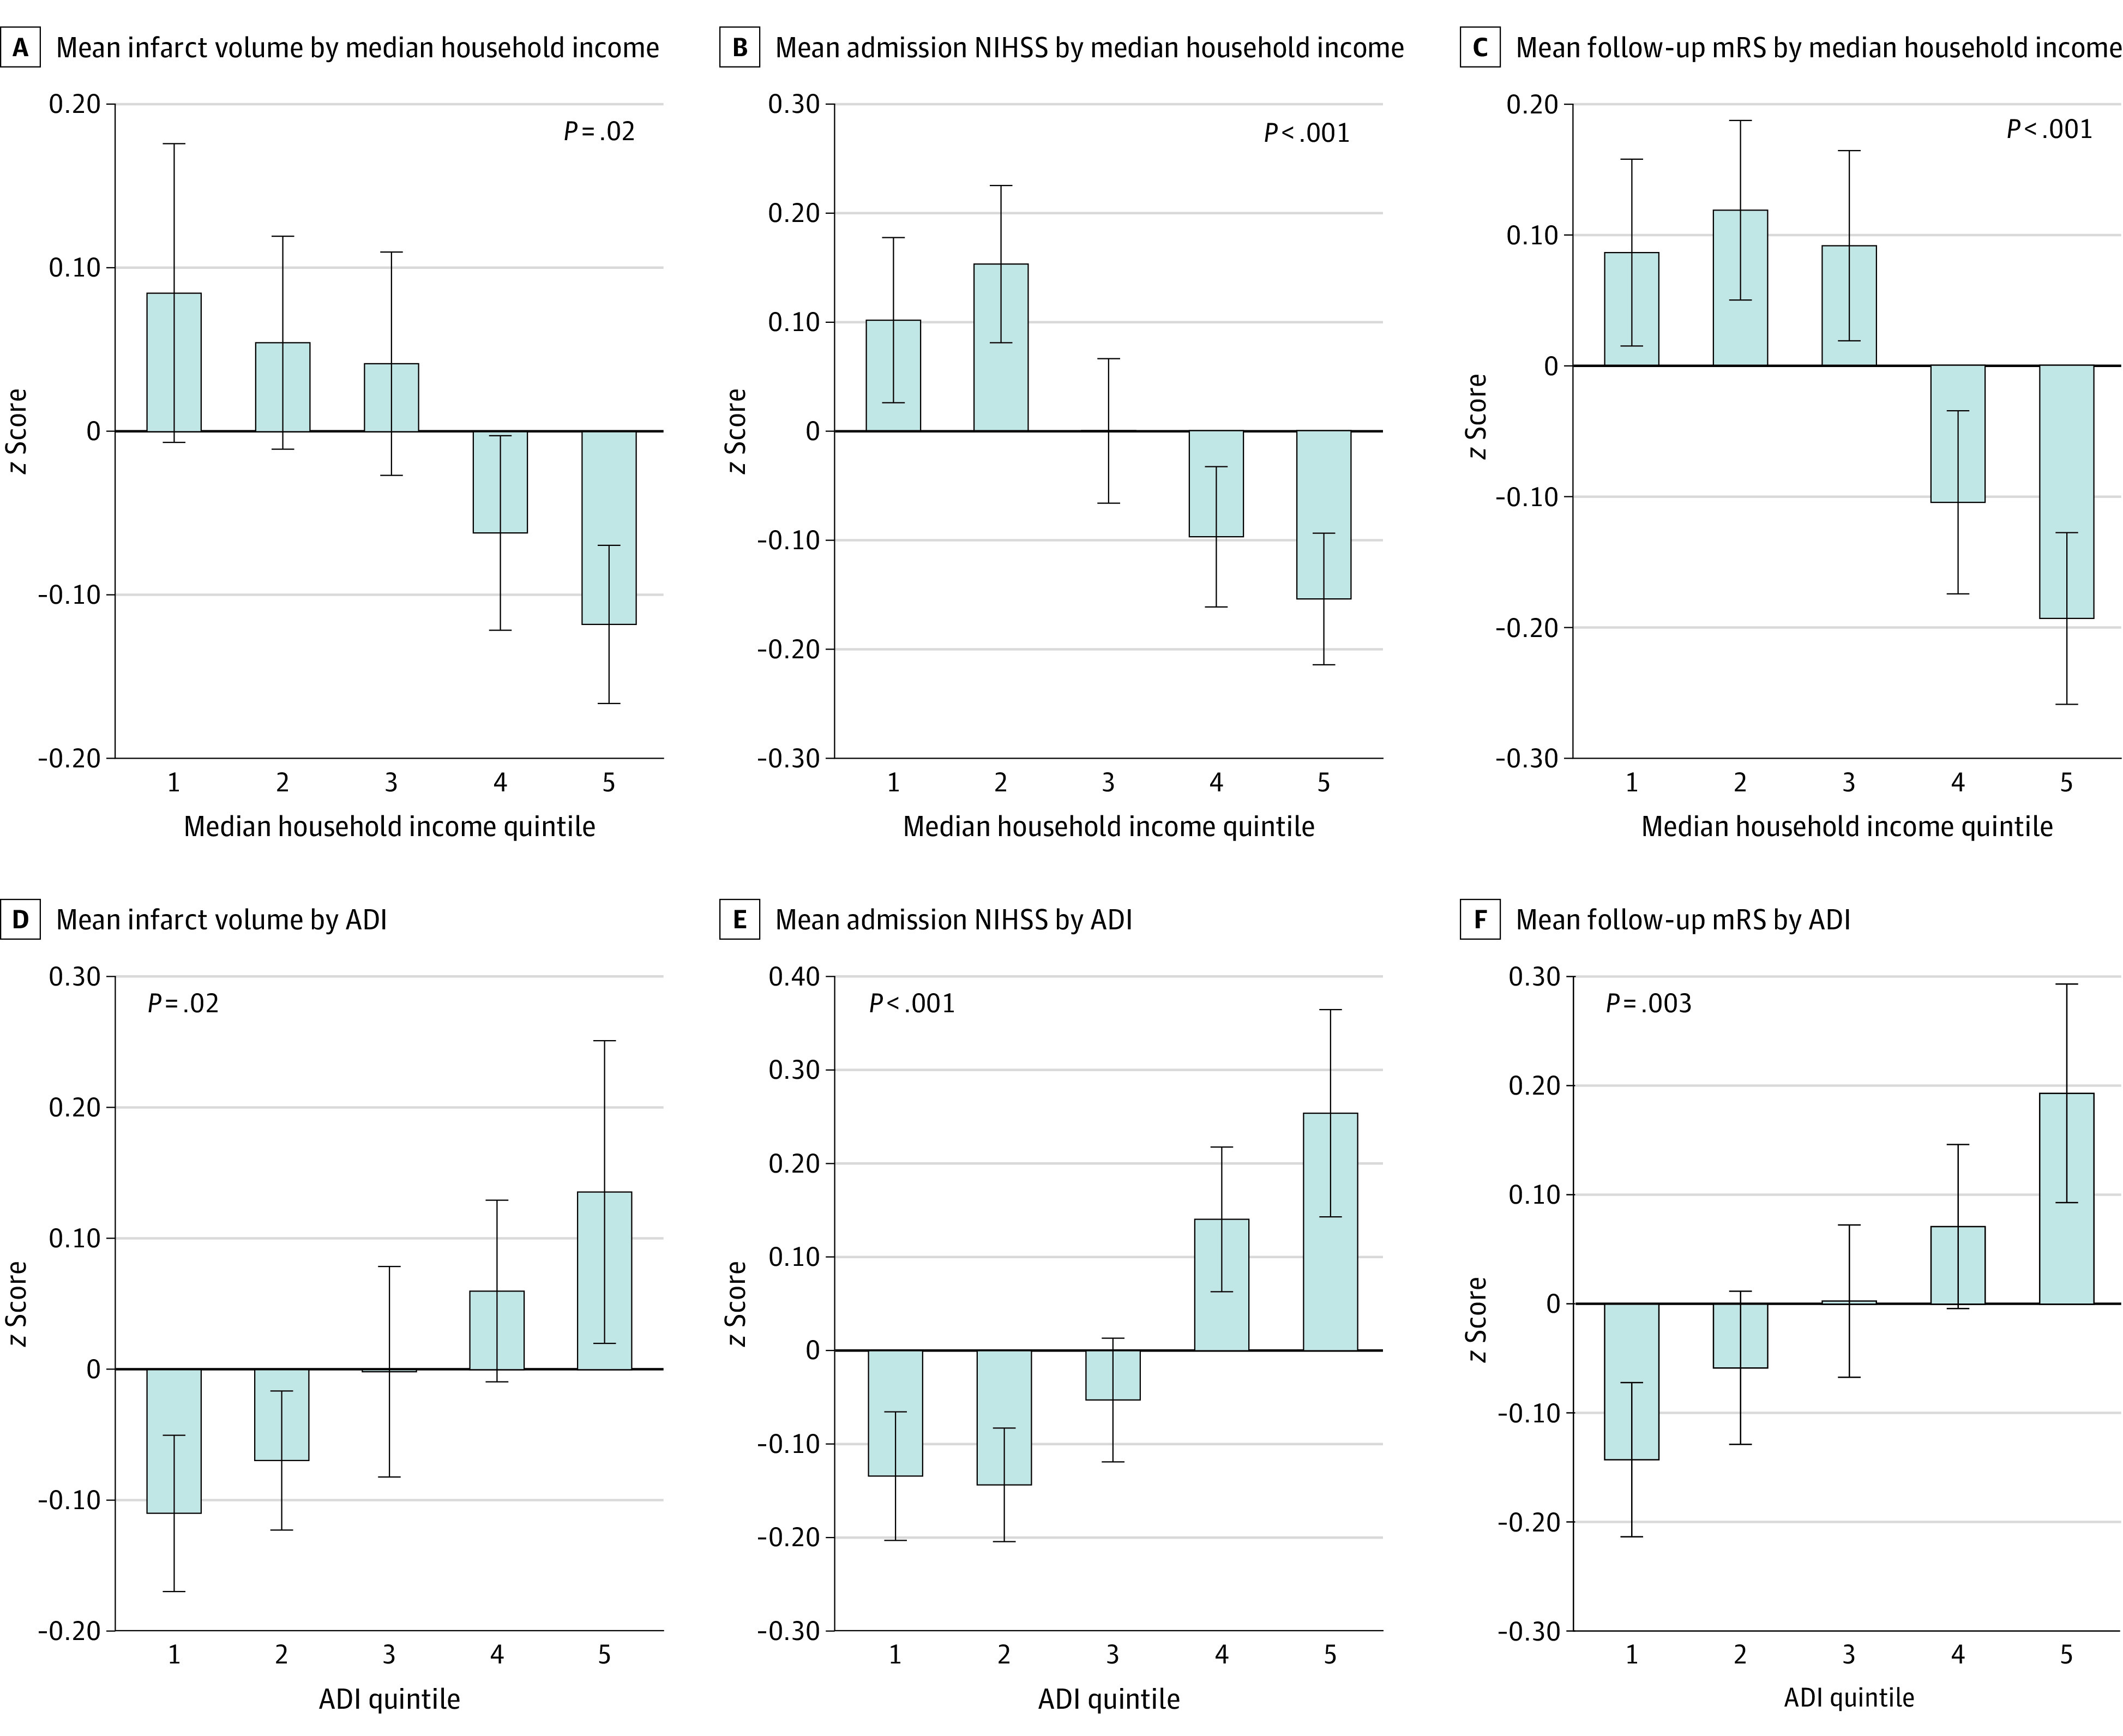
Main outcomes and measures: Initial stroke severity (within 24 hours of presentation) was determined using clinical (National Institutes of Health Stroke Scale [NIHSS]) and imaging (infarct volume by diffusion-weighted MRI) measures. Stroke etiologic subtypes were determined using the Causative Classification of Ischemic Stroke algorithm. Long-term stroke disability was measured using the modified Rankin Scale. Socioeconomic status was estimated using zip code-derived median household income and census block group-derived area deprivation index (ADI). Regression and mediation analyses were performed.

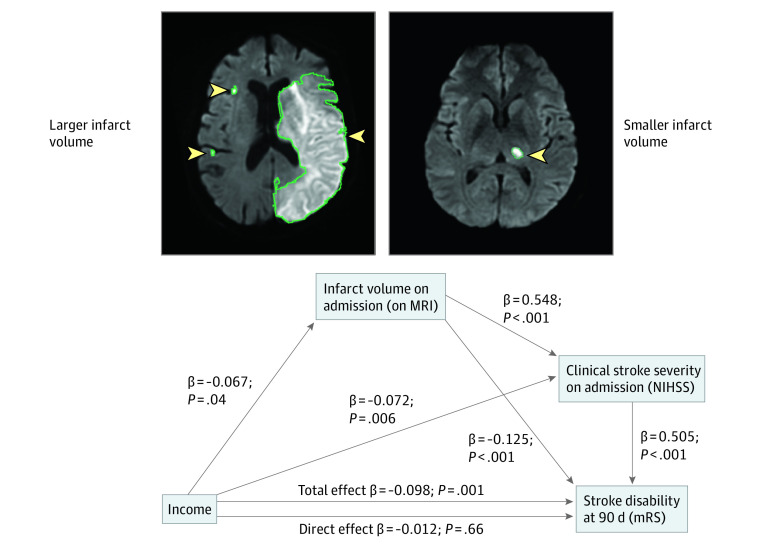
Results: A total of 1098 patients had imaging and SES data available (mean [SD] age, 68.1 [15.7] years; 607 men [55.3%]). Income was inversely associated with initial infarct volume (standardized β, -0.074 [95% CI, -0.127 to -0.020]; P = .007), initial NIHSS (standardized β, -0.113 [95% CI, -0.171 to -0.054]; P < .001), and long-term disability (standardized β, -0.092 [95% CI, -0.149 to -0.035]; P = .001), which remained significant after multivariable adjustments. Initial stroke severity accounted for 64% of the association between SES and long-term disability (standardized β, -0.063 [95% CI, -0.095 to -0.029]; P < .05). Findings were similar when SES was alternatively assessed using ADI.

Conclusions and relevance: The findings of this cohort study suggest that lower SES is associated with larger infarct volumes on presentation. These SES-associated differences in initial stroke severity accounted for most of the subsequent disparities in long-term disability in this study. These findings shift the culpability for SES-associated disparities in poststroke disability from poststroke factors to those that precede presentation.


Conflict of interest statement

Conflict of Interest Disclosures: Dr Osborne reported receiving grants from the National Institutes of Health and consulting fees from WCG Intrinsic Imaging outside the submitted work. Dr Wasfy reported receiving grants from the American Heart Association during the conduct of the study and personal fees from Pfizer Inc and Biotronik outside the submitted work. Dr Ay reported receiving grants from the National Institute of Neurological Disorders and Stroke during the conduct of the study; personal fees from Takeda Pharmaceutical Company Limited outside the submitted work; and authorship royalties from UpToDate. Dr Tawakol reported grants from Genentech Inc and consulting fees from Actelion and Esperion Therapeutics Inc outside the submitted work. No other disclosures were reported.

Figures

Figure 1.
Figure 1.. Study Design Flowchart
ADI indicates area deprivation index; CT, computed tomography; MGH, Massachusetts General Hospital; MRI, magnetic resonance imaging; PO, post office; and SES, socioeconomic status.
Figure 2.
Figure 2.. Socieconomic Status Measures vs Study End Points
Measures of SES included income (A-C) and area deprivation index (ADI) (D-F) in quintiles. Infarct size was measured using volume on magnetic resonance imaging; clinical stroke severity on admission, using the National Institutes of Health Stroke Scale (NIHSS); and 90-day functional outcome, using the modified Rankin Scale (mRS). Error bars indicate 1 SD.
Figure 3.
Figure 3.. Multistep Path Linking Socioeconomic Status to Functional Outcome After Stroke
A serial 2-mediator model shows that initial stroke severity indexes significantly mediate the association between income and functional outcome (modified Rankin Scale [mRS]). Within this model, all indirect pathways involving both infarct volume or admission National Institutes of Health Stroke Scale (NIHSS) score (whether alone or in series) were statistically significant. The direct path (which excludes a role for initial stroke severity indexes) becomes nonsignificant. Regression coefficients and P values correspond to models adjusted for age and sex. Arrowheads and green lines indicate the location and border of infarct, respectively. MRI indicates magnetic resonance imaging. The following 3 distinct indirect pathways were associated with 90-day disability: (1) decreased income to increased infarct volume to increased 90-day disability (standardized β, −0.008 [95% CI, −0.016 to −0.004]; P < .05); (2) decreased income to increased infarct volume to increased NIHSS score to increased 90-day disability (standardized β, −0.018 [95% CI, −0.032 to −0.004]; P < .05); and (3) decreased income to increased NIHSS score to increased 90-day disability (standardized β, −0.036 [95% CI, −0.061 to −0.012]; P < .05). Collectively these 3 indirect pathways account for 64% of the association between socioeconomic status and long-term disability (standardized β, −0.063 [95% CI, −0.095 to −0.029]; P < .05).

References

    1. Heron M. Deaths: leading causes for 2016. Natl Vital Stat Rep. 2018;67(6):1-77. - PubMed
    1. Benjamin EJ, Virani SS, Callaway CW, et al. ; American Heart Association Council on Epidemiology and Prevention Statistics Committee and Stroke Statistics Subcommittee . Heart disease and stroke statistics—2018 update: a report from the American Heart Association. Circulation. 2018;137(12):e67-e492. doi:10.1161/CIR.0000000000000558 - DOI - PubMed
    1. Thorne K, Williams JG, Akbari A, Roberts SE. The impact of social deprivation on mortality following acute myocardial infarction, stroke or subarachnoid haemorrhage: a record linkage study. BMC Cardiovasc Disord. 2015;15:71. doi:10.1186/s12872-015-0045-x - DOI - PMC - PubMed
    1. Lindmark A, Glader EL, Asplund K, Norrving B, Eriksson M; Riks-Stroke Collaboration . Socioeconomic disparities in stroke case fatality—observations from Riks-Stroke, the Swedish stroke register. Int J Stroke. 2014;9(4):429-436. doi:10.1111/ijs.12133 - DOI - PubMed
    1. Marshall IJ, Wang Y, Crichton S, McKevitt C, Rudd AG, Wolfe CD. The effects of socioeconomic status on stroke risk and outcomes. Lancet Neurol. 2015;14(12):1206-1218. doi:10.1016/S1474-4422(15)00200-8 - DOI - PubMed

Publication types