. 2022 Apr 29;8(17):eabn1823.
doi: 10.1126/sciadv.abn1823. Epub 2022 Apr 27.

Identification of four novel T cell autoantigens and personal autoreactive profiles in multiple sclerosis

Affiliations

Identification of four novel T cell autoantigens and personal autoreactive profiles in multiple sclerosis

Mattias Bronge et al. Sci Adv. .

Abstract

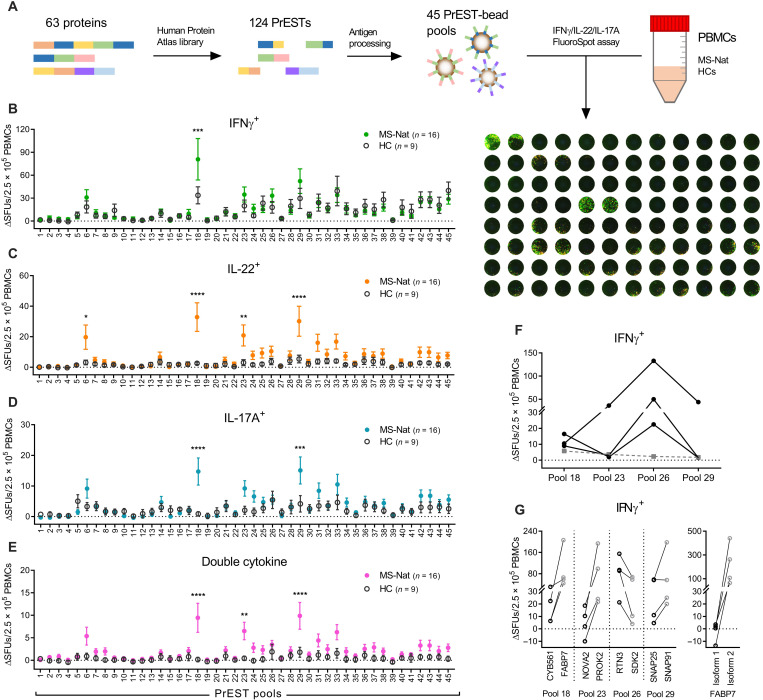
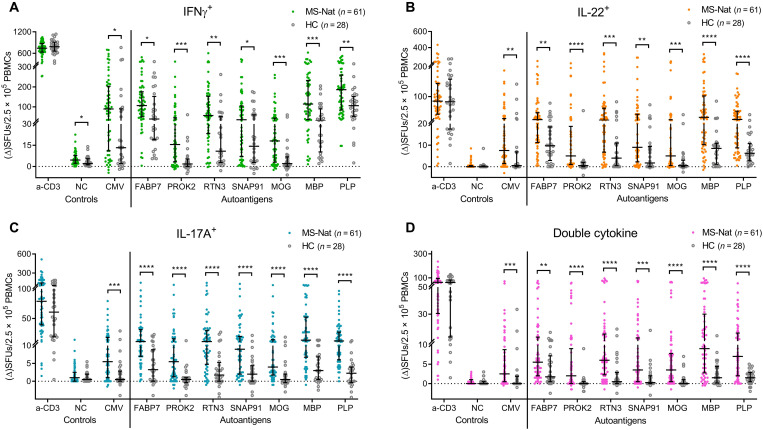
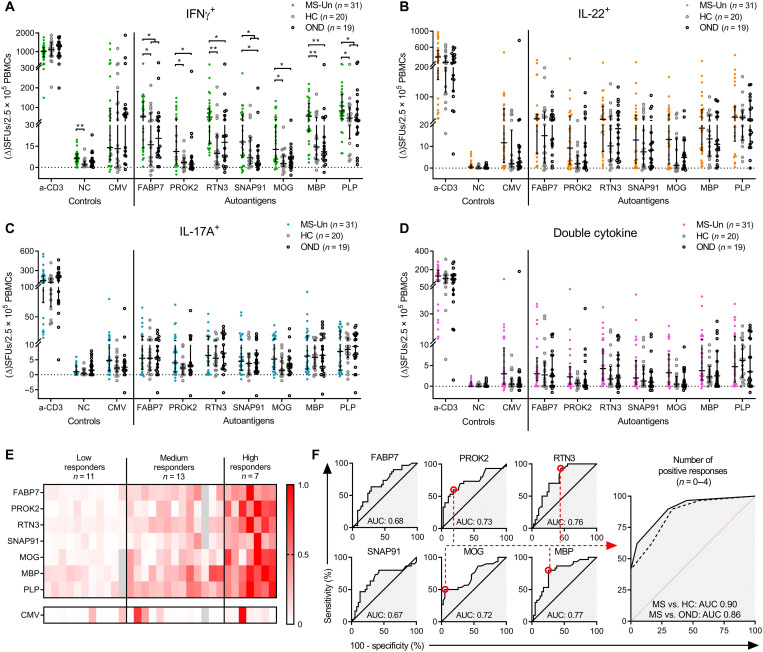
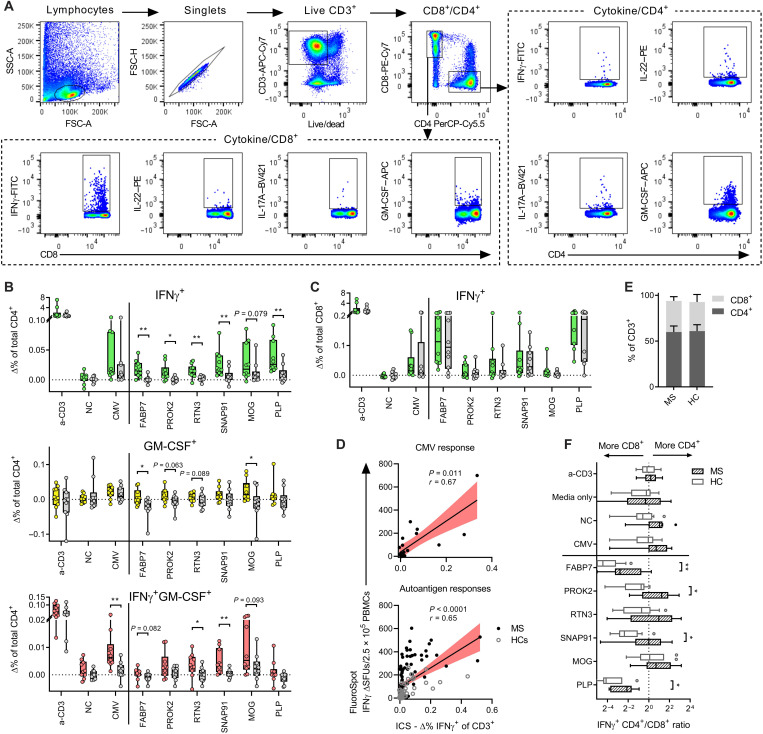
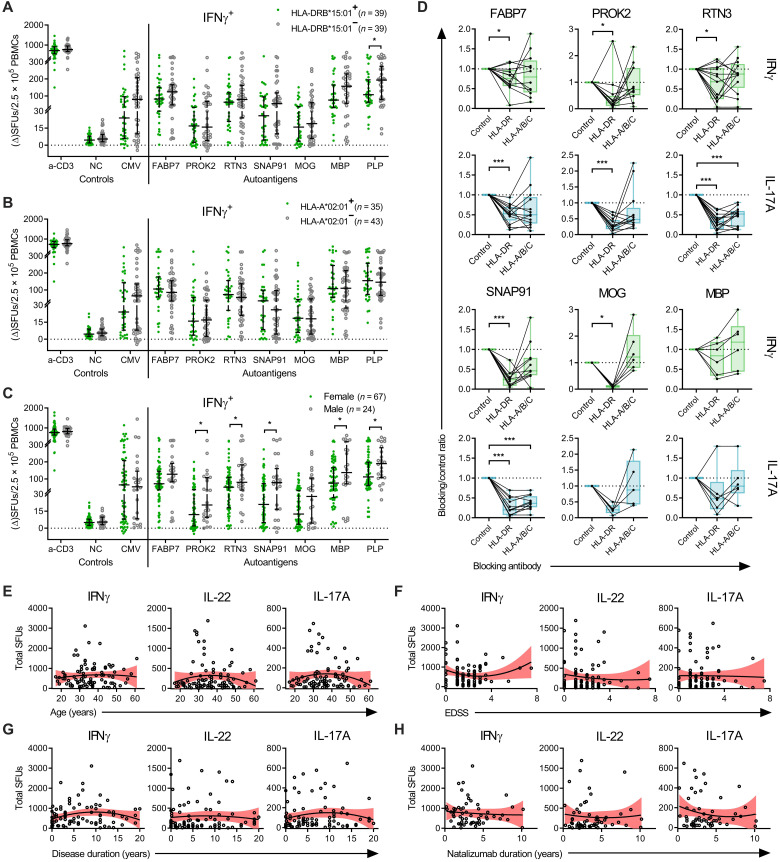
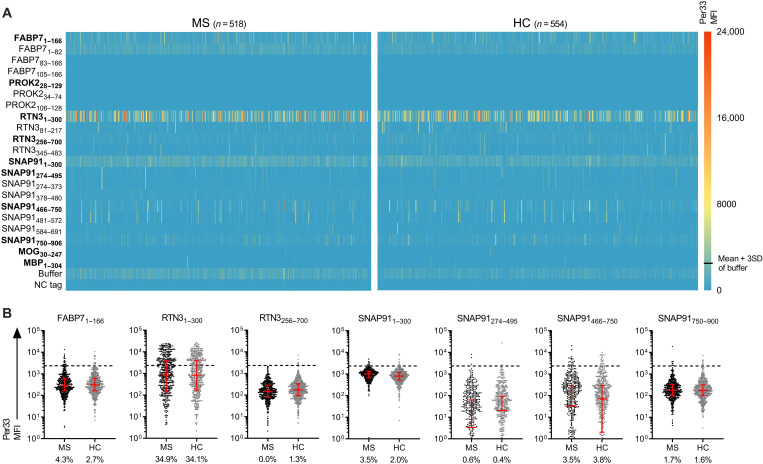
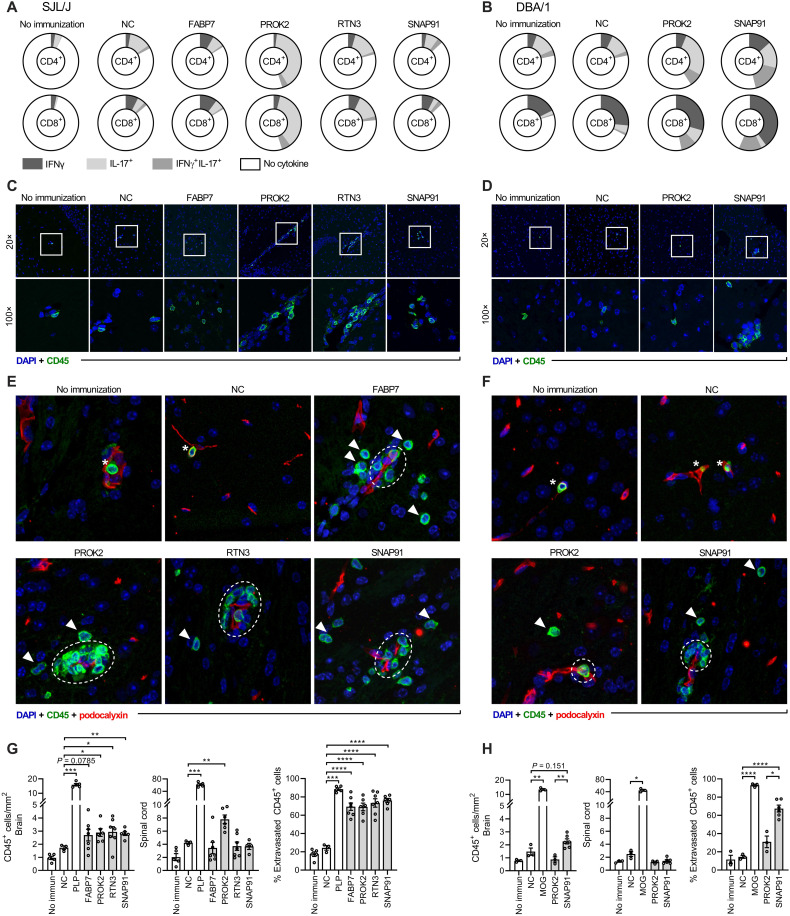
Multiple sclerosis (MS) is an inflammatory disease of the central nervous system (CNS), in which pathological T cells, likely autoimmune, play a key role. Despite its central importance, the autoantigen repertoire remains largely uncharacterized. Using a novel in vitro antigen delivery method combined with the Human Protein Atlas library, we screened for T cell autoreactivity against 63 CNS-expressed proteins. We identified four previously unreported autoantigens in MS: fatty acid-binding protein 7, prokineticin-2, reticulon-3, and synaptosomal-associated protein 91, which were verified to induce interferon-γ responses in MS in two cohorts. Autoreactive profiles were heterogeneous, and reactivity to several autoantigens was MS-selective. Autoreactive T cells were predominantly CD4+ and human leukocyte antigen-DR restricted. Mouse immunization induced antigen-specific responses and CNS leukocyte infiltration. This represents one of the largest systematic efforts to date in the search for MS autoantigens, demonstrates the heterogeneity of autoreactive profiles, and highlights promising targets for future diagnostic tools and immunomodulatory therapies in MS.


Figures

Fig. 1.
Fig. 1.. T cell reactivity screening using a PrEST library.
A panel of PrESTs was tested for their ability to activate PBMCs from natalizumab-treated pwMSs (MS-Nat; n = 16) and age- and sex-matched HCs (n = 9) in an IFNγ/IL-22/IL-17A FluoroSpot assay. (A) Brief overview of the method with a representative developed FluoroSpot plate. (B to E) Number of spot-forming units (SFUs) above background response (ΔSFUs) per 2.5 × 10⁵ PBMCs producing (B) IFNγ, (C) IL-22, (D) IL-17A, or (E) two different cytokines in the FluoroSpot assay after stimulation with the PrESTs pools (#1 to #45). Means ± SEM presented for MS (closed, colored circles) and HCs (open, dark gray circles). P values were calculated with two-way analysis of variance (ANOVA) with Sidak correction for multiple comparisons. *P < 0.05, **P < 0.01, ***P < 0.001, and ****P < 0.0001. (F) IFNγ response in three pwMSs that had a high response to antigen pool #26. Black dots represent IFNγ spots with each line representing one individual and gray dashed line representing the three individuals’ mean IL-22 responses. (G) Four patients with MS with high responses to the PrEST pools in the screening were again tested with the PrESTs from the individual proteins contained in the pools (left graph). Four patients with responses against the FABP7 PrEST were also tested against recombinant full-length versions of the two different FABP7 isoforms (right graph). Each line represents one patient. CYB561, cytochrome b561; NOVA2, NOVA alternative splicing regulator 2; SDK2, sidekick cell adhesion molecule 2.
Fig. 2.
Fig. 2.. T cell reactivity using a full-length autoantigen panel.
The four hits from the screening were produced as full-length proteins and were used as stimuli in an IFNγ/IL-22/IL-17A FluoroSpot assay, testing a cohort of natalizumab-treated pwMSs (n = 61) alongside age- and sex-matched HCs (n = 28). The number of SFUs producing (A) IFNγ, (B) IL-22, (C) IL-17A, or (D) two different cytokines after stimulation with the full-length autoantigen panel. Each dot represents one individual with brackets representing median and interquartile range (IQR). The anti-CD3 positive control stimulation is plotted as ΔSFUs per 1.25 × 10⁵ PBMCs, and NC is plotted as raw SFUs per 2.5 × 10⁵ PBMCs. P values were calculated with two-tailed Mann-Whitney U tests with false discovery rate (FDR) correction for multiple comparisons. FDR-adjusted P values are reported. *P < 0.05, **P < 0.01, ***P < 0.001, and ****P < 0.0001.
Fig. 3.
Fig. 3.. T cell reactivity and autoreactive profiles in untreated pwMSs.
A second validation cohort consisting of untreated pwMSs (MS-Un) (n = 31), HCs (n = 20), and persons with OND (n = 19) was tested with the full-length autoantigen panel in a FluoroSpot assay. The number of SFUs producing (A) IFNγ, (B) IL-22, (C) IL-17A, or (D) two different cytokines after stimulation with the full-length autoantigen panel. Each dot represents one individual, and brackets represent median and IQR. The anti-CD3 positive control stimulation is plotted as ΔSFUs per 1.25 × 10⁵ PBMCs, and NC is plotted as raw SFUs. P values were calculated with two-tailed Mann-Whitney U tests with FDR correction for multiple comparisons. FDR-adjusted P values are reported. P values under 0.1 are shown. *P < 0.05 and **P < 0.01. (E) Heatmap of the individual IFNγ responses of pwMSs. Each column represents one individual. Intensity is based on the ratio of response/highest observed response for the same antigen (0.0 to 1.0). Grouped into low/medium/high responders based on the number of responses with a ratio of >0.25 (low = 0, medium = 1 to 5, and high = 6 to 7). Missing values are in gray. (F) ROC analysis to identify optimal cutoffs based on the IFNγ ΔSFUs of MS versus HC plus OND [data from graph in (A)]. The rightmost graph represents a composite test using the number of positive responses (n = 0 to 4), based on cutoffs for positivity of four autoantigens (PROK2, RTN3, MOG, and MBP) (red circles). The solid line represents MS versus HC, and the dashed line represents MS versus OND. AUC: 0.5 to 1.0, 0.5 = no predictive value and 1 = perfect test.
Fig. 4.
Fig. 4.. Cytokine profiling of autoantigen-specific T cells.
Flow cytometry analysis of autoreactive T cells using intracellular cytokine staining after autoantigen stimulation. (A) Representative plots demonstrating gating strategy. SSC, side scatter; FSC; forward scatter. (B) IFNγ and GM-CSF responses in CD4+ T cells after stimulation with autoantigens or control antigens. (C) IFNγ responses in CD8+ T cells. (B) and (C) are plotted as the percentage of the total population after subtracting background responses (no stimuli, Δ%). Autoantigen-reactive pwMSs (n = 10) are in color, and HCs (n = 10) are in gray. Boxes represent median and IQR, and each dot represents one individual. P values were calculated using two-tailed Mann-Whitney U test and written as symbols when significant and in absolute numbers when 0.05 < P < 0.1. (D) Correlation between IFNγ SFUs as measured in FluoroSpot (y axis) and % IFNγ+ of total CD3+ population as measured with flow cytometry (x axis). The black line represents the linear regression slope, and the red area represents the 95% CI of the slope. P and r values were calculated using two-tailed nonparametric Spearman correlation. ICS, intracellular cytokine staining. (E) Proportion of CD4+ and CD8+ T cells in the CD3+ compartment of MS and HCs, based on unstimulated cells. Bars and staples represent means and SD. (F) Ratio of % IFNγ+CD4+ and % IFNγ+CD8+ after control and autoantigen stimulation in both MS and HCs. Boxes represent median and IQR, and brackets represent 1.5 × IQR (Tukey). P values were calculated using two-tailed Mann-Whitney U test and written when significant. For the whole figure, *P < 0.05 and **P < 0.01.
Fig. 5.
Fig. 5.. MHC and clinical correlations of autoreactivity.
(A to C) Pooled IFNγ FluoroSpot results from the first and second validation cohort stratified on the basis of (A) HLA-DRB1*15:01 status, (B) HLA-A*02:01 status, and (C) sex. P values were calculated using two-tailed Mann-Whitney U test and shown when significant. (D) Effect of HLA blocking on autoantigen responses. MSs (n = 16, n = 6 for MBP) were stimulated with autoantigen together with HLA-DR or HLA-A/B/C blocking antibodies or an isotype control antibody. Unresponsive individuals (<6 ΔSFUs for IFNγ and <4 ΔSFUs for IL-17A) were excluded from the analysis. Results plotted as the ratio of blocking versus isotype control. Boxes represent median and IQR, with range in brackets. P values were calculated using two-tailed Wilcoxon signed-rank test. *P < 0.05 and ***P < 0.001. (E to H) Correlation between total autoantigen responses in the FluoroSpot assay of patients with MS and their clinical parameters (E) age, (F) expanded disability status scale (EDSS), (G) disease duration, and (H) natalizumab treatment duration. On the basis of pooled data from both the first and second validation cohort [except (H)]. Y axis represents the total sum of each individual’s autoantigen responses for the respective cytokines. Black lines represent the best-fit nonlinear regression slope, and the red area represents the 95% CI. P values were calculated using two-tailed nonparametric Spearman correlation tests, but none reached significance.
Fig. 6.
Fig. 6.. Autoantibodies targeting T cell autoantigens.
The presence of autoantibodies was tested in a large cohort of pwMSs (n = 518) and HCs (n = 554) using a suspension bead array. Both the full-length autoantigens and PrESTs from the HPA of the corresponding proteins were used for detection. (A) Heatmap showing the adjusted antibody signal intensity, per33 median fluorescent intensity (MFI) of pwMSs (left heatmap) and HC (right heatmap) for the antigens. Each row represents one antigen, and each column represents one individual. Full-length antigens that were used in the FluoroSpot analysis are written in bold. (B) Dot plots showing the responses to the full-length antigens and frequencies of positive responses. The threshold for positivity (dashed line) was determined as the mean + 3SD of the response to the buffer (≥2350 MFI). Brackets represent median and IQR. P values were calculated using two-tailed Fisher’s exact test with Holm-Sidak correction for multiple comparisons.
Fig. 7.
Fig. 7.. Encephalitogenic potential in mouse models.
(A) Recall autoantigen responses in immunized SJL/J mice measured via intracellular cytokine staining and flow cytometry after ex vivo stimulation of splenocytes. (B) Recall responses in DBA/1 mice. Data shown represent the percentage of cytokine-positive CD4+/CD8+ cells (whole circle, 100% of cell population), displaying the mean results of all mice in the group (n = 3 to 8 per antigen) after stimulation with the same antigen as used for immunization. (C and D) Representative immunofluorescence of infiltrating CD45+ cells (green) in the brain of (C) SJL/J and (D) DBA/1 mice. Cell nuclei are visualized by 4′,6-diamidino-2-phenylindole (DAPI) (blue). Representative maximum intensity projections of 12-μm z-stacks are shown. White square in the 20× images indicates the area visible in 100×. (E and F) Representative immunofluorescence of the location of infiltrating CD45+ cells (green) in relation to blood vessels (red). Arrowheads indicate intraparenchymal leukocytes, dashed white circles indicate perivascular leukocytes, and asterisks indicate intravascular leukocytes. Full-size images are available in fig. S7. (G) Evaluation of CD45+ leukocyte infiltration into the brain and spinal cord in SJL/J mice after autoantigen immunization. Data from two experiments. No immunization (n = 5), NC (n = 3), PLP (n = 5), FABP7 (n = 7), PROK2 (n = 6), RTN3 (n = 7), and SNAP91 (n = 6). Rightmost graph shows the quantification of brain-infiltrating leukocytes that passed through the BBB. (H) Evaluation of CD45+ leukocyte infiltration into the brain and spinal cord of DBA/1 mice after autoantigen immunization. Data from one experiment. No immunization (n = 3), NC (n = 3), PLP (n = 3), PROK2 (n = 3), and SNAP91 (n = 6). Rightmost graph shows the quantification of brain-infiltrating leukocytes that passed through the BBB. Each dot represents one mouse, and bar and brackets represent means ± SEM. P values were calculated using one-way Brown-Forsythe and Welch ANOVA with Holm-Sidak correction for multiple comparison, comparing each group with the NC-immunized group. P values are shown when significant. *P < 0.05, **P < 0.01, **P < 0.001, and ****P < 0.0001.

Comment in

  • doi: 10.1126/sciadv.abq4849

References

    1. Hemmer B., Kerschensteiner M., Korn T., Role of the innate and adaptive immune responses in the course of multiple sclerosis. Lancet Neurol. 14, 406–419 (2015). - PubMed
    1. Olsson T., Barcellos L. F., Alfredsson L., Interactions between genetic, lifestyle and environmental risk factors for multiple sclerosis. Nat. Rev. Neurol. 13, 25–36 (2017). - PubMed
    1. Wang J., Jelcic I., Mühlenbruch L., Haunerdinger V., Toussaint N. C., Zhao Y., Cruciani C., Faigle W., Naghavian R., Foege M., Binder T. M. C., Eiermann T., Opitz L., Fuentes-Font L., Reynolds R., Kwok W. W., Nguyen J. T., Lee J. H., Lutterotti A., Münz C., Rammensee H. G., Hauri-Hohl M., Sospedra M., Stevanovic S., Martin R., HLA-DR15 molecules jointly shape an autoreactive T cell repertoire in multiple sclerosis. Cell 183, 1264–1281.e20 (2020). - PMC - PubMed
    1. Elong Ngono A., Pettre S., Salou M., Bahbouhi B., Soulillou J. P., Brouard S., Laplaud D. A., Frequency of circulating autoreactive T cells committed to myelin determinants in relapsing-remitting multiple sclerosis patients. Clin. Immunol. 144, 117–126 (2012). - PubMed
    1. Olsson T., Sun J., Hillert J., Hojeberg B., Ekre H. P., Andersson G., Olerup O., Link H., Increased numbers of T cells recognizing multiple myelin basic protein epitopes in multiple sclerosis. Eur. J. Immunol. 22, 1083–1087 (1992). - PubMed