. 2022 Apr 29;8(17):eabm8965.
doi: 10.1126/sciadv.abm8965. Epub 2022 Apr 27.

Lactate induces vascular permeability via disruption of VE-cadherin in endothelial cells during sepsis

Affiliations

Lactate induces vascular permeability via disruption of VE-cadherin in endothelial cells during sepsis

Kun Yang et al. Sci Adv. .

Abstract

Circulating lactate levels are a critical biomarker for sepsis and are positively correlated with sepsis-associated mortality. We investigated whether lactate plays a biological role in causing endothelial barrier dysfunction in sepsis. We showed that lactate causes vascular permeability and worsens organ dysfunction in CLP sepsis. Mechanistically, lactate induces ERK-dependent activation of calpain1/2 for VE-cadherin proteolytic cleavage, leading to the enhanced endocytosis of VE-cadherin in endothelial cells. In addition, we found that ERK2 interacts with VE-cadherin and stabilizes VE-cadherin complex in resting endothelial cells. Lactate-induced ERK2 phosphorylation promotes ERK2 disassociation from VE-cadherin. In vivo suppression of lactate production or genetic depletion of lactate receptor GPR81 mitigates vascular permeability and multiple organ injury and improves survival outcome in polymicrobial sepsis. Our study reveals that metabolic cross-talk between glycolysis-derived lactate and the endothelium plays a critical role in the pathophysiology of sepsis.


Figures

Fig. 1.
Fig. 1.. Elevated lactate levels increase vascular permeability in polymicrobial sepsis.
Lactate (0.5 g/kg body weight) was administrated through intraperitoneal injection 6 hours after CLP or sham surgery. (A) Serum lactate levels were assessed by a commercially available kit 24 hours after CLP/sham surgery (n = 6). (B and C) Left ventricular fraction shortening (FS) (B) and ejection fraction (EF) (C) were measured 24 hours after CLP/sham surgery (n = 4). (D and E) Serum levels of creatinine (D) and aspartate aminotransferase (AST) (E) were assessed by commercially available ELISA kits (n = 5). (F) Survival rates among sham, CLP, Lac, and CLP + Lac mice were compared by Kaplan-Meier test. (G) Relative levels of liver Evans Blue Dye (EBD) absorbance at 610 nm in sham and CLP mice with or without lactate administration (n = 6). (H) Relative levels of kidney EBD absorbance at 610 nm in sham and CLP mice with or without lactate administration (n = 6). (I and J) Sodium oxamate, an LDHA inhibitor, was administrated 3 hours before sham or CLP surgery to suppress lactate production (I). Serum lactate levels (J) were measured 24 hours following surgery (n = 6). (K) Relative levels of liver EBD absorbance at 610 nm in sham and CLP mice with or without oxamate administration (n = 6). (L) Relative levels of kidney EBD absorbance at 610 nm in sham and CLP mice with or without oxamate administration (n = 6). Values are means ± SD. Lac, lactate. OXA, sodium oxamate. LDHA, lactate dehydrogenase A. CLP, cecal ligation and puncture. Two-way ANOVA with Tukey’s test. *P < 0.05; **P < 0.01; ***P < 0.001. ns, no significant difference.
Fig. 2.
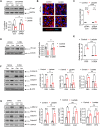
Fig. 2.. Lactate decreases VE-cadherin levels following polymicrobial sepsis.
(A) Representative flow density plot and quantitative analysis for VE-cadherin (CD144)–positive EC frequency in the tissues of Tie2-GFP reporter mice (n = 4). (B) Representative immunofluorescent staining images of GFP-labeled EC (green), VE-cadherin (red), and nuclei (DAPI, blue) in the lung tissues of Tie2-GFP reporter mice. Scale bar, 100 μm. (C) Western blot detection of VE-cadherin protein expression in whole heart lysates of sham, CLP, Lac, and Lac + CLP mice (n = 5). (D) Western blot detection of VE-cadherin protein expression in whole lung lysates of sham, CLP, Lac, and Lac + CLP mice (n = 5). (E) Western blot detection of VE-cadherin protein expression in whole heart lysates of sham, CLP, OXA, and OXA + CLP mice (n = 5). (F) Western blot detection of VE-cadherin protein expression in whole lung lysates of sham, CLP, OXA, and OXA + CLP mice (n = 5). VE-cad, VE-cadherin. Two-way ANOVA with Tukey’s test. *P < 0.05; **P < 0.01; ***P < 0.001.
Fig. 3.
Fig. 3.. Lactate promotes VE-cadherin disorganization by inducing ERK1/2 phosphorylation and decreasing junctional ERK2 expression.
(A) Representative immunofluorescent staining images of VE-cadherin (red), ERK (green), and nuclei (DAPI, blue) in sparse and confluent HUVECs. (B) HUVECs were treated with lactate for 6 hours followed by Western blot analysis of the ERK protein levels in the membrane fraction (n = 4). (C) Representative immunofluorescent staining images of VE-cadherin (red), ERK (green), and nuclei (DAPI, blue) in HUVECs treated with lactate or acidic medium (pH 6.8) for 6 hours. Colocalization between ERK and VE-cadherin staining was analyzed by plotting fluorescence intensity profiles along red arrow lines using ZEN 3.1 (blue edition). White arrowheads indicate the colocalization of ERK with VE-cadherin at the plasma membrane in HUVECs (n = 5). (D) HUVECs were treated with lactate for 6 hours. Protein lysates (200 μg) were precipitated with anti-ERK1/2 antibody followed by immunoblotting with anti–VE-cadherin antibody. (E) Western blot analysis of ERK1/2 levels in cytosolic and membrane fractions of untreated HUVECs (n = 3). (F and G) HUVECs were treated with lactate for 6 hours. Protein lysates (200 μg) were precipitated with anti-ERK2 (F) and anti-ERK1 (G) antibodies followed by immunoblotting with anti–VE-cadherin antibody (n = 3). (H) Western blot analysis of p-ERK and ERK expressions in lactate-treated ECs (n = 3). (I) Representative immunofluorescent staining images of p-ERK and ERK in confluent HUVECs. White arrows indicate membrane ERK staining in HUVECs. Membrane levels of p-ERK1/2 and ERK1/2 fluorescence were analyzed by ZEN 3.1 (blue edition) (n = 5). mem, membrane fraction. Cyto, cytosol fraction. CO-IP, co-immunoprecipitation. Student’s two-tailed unpaired t test (B, E, F, H, and I). One-way ANOVA with Tukey’s test (C). *P < 0.05; **P < 0.01; ***P < 0.001.
Fig. 4.
Fig. 4.. Lactate-suppressed adenylyl cyclase activity contributes to VE-cadherin down-regulation by activation of RAF1/MEK/ERK signaling.
(A) A scheme depicting lactate mode of action in regulating VE-cadherin stability via GPR81/cAMP signaling. (B) HUVECs were treated with adenylyl cyclase activator (forskolin, 10 μM) before lactate stimulation for 6 hours. Representative immunofluorescent staining images of VE-cadherin (red) and nuclei (DAPI, blue) in HUVECs. (C) Western blot analysis of VE-cadherin in HUVECs pretreated with forskolin followed by lactate stimulation for 6 hours (n = 4). (D) Western blot analysis of RAF1/MEK/ERK signaling in HUVECs pretreated with forskolin followed by lactate stimulation (n = 4). (E) HUVECs were transfected with siRNAs for MEK1/MEK2 and scramble control siRNA for 24 hours before lactate stimulation for 6 hours. Expression of VE-cadherin, p-ERK1/2, and MEK1/2 were assessed by Western blot (n = 4). (F) HUVECs were treated with EPAC agonist (8-CPT-2Me-cAMP, 100 μM) before lactate stimulation for 6 hours. Representative immunofluorescent staining images of VE-cadherin (red) and nuclei (DAPI, blue) in HUVECs. (G) Western blot analysis of VE-cadherin in HUVECs pretreated with EPAC agonist followed by lactate stimulation for 6 hours (n = 4). (H) Western blot analysis of RAF1/MEK/ERK signaling in HUVECs pretreated with forskolin followed by lactate stimulation (n = 4). EPAC, exchange protein directly activated by cAMP. Con, control. Two-way ANOVA with Tukey’s test. *P < 0.05; **P < 0.01; ***P < 0.001.
Fig. 5.
Fig. 5.. Calpain activation is required for lactate-induced disruption of VE-cadherin in ECs.
Lactate (0.5 g/kg body weight) was administrated through intraperitoneal injection 6 hours after CLP or sham surgery. (A and B) Representative immunofluorescent staining images of calpain1 (red, A) and calpain2 (red, B) in ECs of the lung tissues. ECs were stained with CD31 (green), and nuclei were stained with DAPI (blue) (n = 5). (C) Western blot analysis of calpain1 and calpain2 expressions following lactate treatment in ECs (n = 3). (D) Calpain enzyme activity in ECs treated with lactic acid or sodium lactate (n = 3). (E) Representative immunofluorescent staining images of VE-cadherin (red), calpain1 (green), and nuclei (DAPI, blue) in HUVECs treated with or without lactate (n = 3). Scale bar, 20 μm. (F and G) HUVECs were treated with lactate for 6 hours. Protein lysates (200 μg) were precipitated with anti–VE-cadherin antibody followed by immunoblotting with anti-calpain1 (F) or anti-calpain2 (G) antibodies. LacH, lactic acid. LacNa, sodium lactate. Two-way ANOVA with Tukey’s test (A and B). One-way ANOVA with Tukey’s test (C and D). Student’s two-tailed unpaired t test (E). *P < 0.05; **P < 0.01; ***P < 0.001.
Fig. 6.
Fig. 6.. Calpain activation is required for lactate-induced VE-cadherin endocytosis.
(A and B) HUVECs were treated with calpeptin (10 μM) for 1 hour before lactate stimulation for 6 hours. Protein lysates (200 μg) were precipitated with anti–VE-cadherin antibody followed by immunoblotting with anti-caveolin1 antibody (A) or anti-clathrin1 antibody (B) (n = 3). (C and D) HUVECs were treated with calpeptin (10 μM) for 1 hour before lactate stimulation for 6 hours. Protein lysates (200 μg) were precipitated with anti-caveolin1 antibody (C) or anti-clathrin1 antibody (D) followed by immunoblotting with anti–VE-cadherin antibody (n = 3). (E) Representative immunofluorescent staining images of VE-cadherin (red), caveolin1 (green), and nuclei (DAPI, blue) in lactate-stimulated HUVECs pretreated with DMSO or calpeptin. White arrows indicate colocalization between VE-cadherin and caveolin1. Scale bar, 20 μm. (F) Representative immunofluorescent staining images of VE-cadherin (red), clathrin1 (green), and nuclei (DAPI, blue) in lactate-stimulated HUVECs pretreated with DMSO or calpeptin. White arrows indicate colocalization between VE-cadherin and clathrin1. Scale bar, 20 μm. Two-way ANOVA with Tukey’s test (A to D). *P < 0.05; **P < 0.01; ***P < 0.001.
Fig. 7.
Fig. 7.. Lactate-induced VE-cadherin disorganization is mediated by GPR81 signaling.
(A and B) GPR81 was silenced by transfection with specific siRNA for 24 hours before lactate stimulation. Cells transfected with scramble siRNAs were used as controls. VE-cadherin expression was assessed by Western blot (A), and VE-cadherin localization was examined by immunofluorescent staining (B). Scale bar, 20 μm. (C) Levels of FITC-dextran penetration through GPR81-silenced HUVEC monolayer upon lactate stimulation (n = 4). Cells transfected with scramble siRNAs were used as controls. (D and E) HUVECs were treated with GPR81 antagonist 3-OBA (5 mM) for 1 hour before lactate stimulation. Expression of VE-cadherin was assessed by Western blot (D) (n = 3). Permeability was examined by levels of FITC-dextran penetration through endothelium (E) (n = 4). (F) HUVECs were treated with GPR81 antagonist 3-OBA (5 mM) for 1 hour before lactate stimulation. Expression of ERK, p-ERK, and calpain1 was assessed by Western blot (n = 3). (G) HUVECs were treated with an MCT inhibitor (CHC, 3 mM) for 1 hour before lactate stimulation. Expression of ERK, p-ERK, and calpain1 was assessed by Western blot (n = 3). Two-way ANOVA with Tukey’s test. 3-OBA, 3-hydroxy-butyrate acid. CHC, 2-Cyano-3-(4-hydroxyphenyl)-2-propenoic acid. siR, siRNA. *P < 0.05; **P < 0.01; ***P < 0.001.
Fig. 8.
Fig. 8.. Inhibition of GPR81 signaling attenuates vascular permeability and improves survival outcomes in polymicrobial sepsis.
(A) Western blot detection of GPR81 protein expression in whole heart lysates of WT and GPR81 knockout (KO) mice. (B) WT and GPR81 KO mice were subjected to CLP or sham surgery. Serum samples were collected 24 hours after surgery, and serum lactate levels were assessed by a commercially available kit (n = 6). (C) Representative flow density plot and quantitative analysis for VE-cadherin (CD144) positive EC (CD31) frequency in the heart and liver tissues of WT and GPR81 KO mice 24 hours following sham or CLP surgery (n = 3 to 4). (D) Western blot detection of VE-cadherin protein expression in whole heart lysates of WT and GPR81 KO mice following sham and CLP surgery (n = 5). (E) Western blot detection of VE-cadherin protein expression in whole lung lysates of WT and GPR81 KO mice following sham and CLP surgery (n = 5). (F and G) Serum levels of creatinine (F) and AST (G) were assessed by commercially available ELISA kits in WT and GPR81 KO mice following sham or CLP surgery (n = 7). (H and I) EF (C) and left ventricular FS (B) were measured 24 hours after CLP/sham surgery in WT and GPR81 KO mice (n = 4 to 6). (J) Survival outcomes of WT and GPR81 KO mice following sham or CLP surgery were monitored up to 10 days following surgery. Two-way ANOVA with Tukey’s test (B to I) and log-rank test (J). *P < 0.05; **P < 0.01; ***P < 0.001.
Fig. 9.
Fig. 9.. Scheme of lactate-induced vascular hyperpermeability by promoting VE-cadherin cleavage and endocytosis in sepsis.
During sepsis, aerobic glycolysis–derived lactate activates GPR81-dependent signaling in ECs, which results in suppressed cAMP formation and activation of RAF1/MEK/ERK signaling. ERK1/2 phosphorylation induces ERK2 disassociation from VE-cadherin. In addition, lactate induces ERK1/2-dependent activation of calpain1/2 for VE-cadherin cleavage and endocytosis. Endocytosis of VE-cadherin leads to endothelium permeability.

References

    1. Singer M., Deutschman C. S., Seymour C. W., Shankar-Hari M., Annane D., Bauer M., Bellomo R., Bernard G. R., Chiche J. D., Coopersmith C. M., Hotchkiss R. S., Levy M. M., Marshall J. C., Martin G. S., Opal S. M., Rubenfeld G. D., van der Poll T., Vincent J. L., Angus D. C., The third international consensus definitions for sepsis and septic shock (sepsis-3). JAMA 315, 801–810 (2016). - PMC - PubMed
    1. Joffre J., Hellman J., Ince C., Ait-Oufella H., Endothelial responses in sepsis. Am. J. Respir. Crit. Care Med. 202, 361–370 (2020). - PubMed
    1. Goldenberg N. M., Steinberg B. E., Slutsky A. S., Lee W. L., Broken barriers: A new take on sepsis pathogenesis. Sci. Transl. Med. 3, 88ps25 (2011). - PubMed
    1. Jaffee W., Hodgins S., McGee W. T., Tissue edema, fluid balance, and patient outcomes in severe sepsis: An organ systems review. J. Intensive Care Med. 33, 502–509 (2018). - PubMed
    1. Lee W. L., Slutsky A. S., Sepsis and endothelial permeability. N. Engl. J. Med. 363, 689–691 (2010). - PubMed