. 2022 Jul 1;33(8):br11.
doi: 10.1091/mbc.E21-10-0517-T. Epub 2022 Apr 27.

Trisomy 21 increases microtubules and disrupts centriolar satellite localization

Affiliations

Trisomy 21 increases microtubules and disrupts centriolar satellite localization

Bailey L McCurdy et al. Mol Biol Cell. .

Abstract

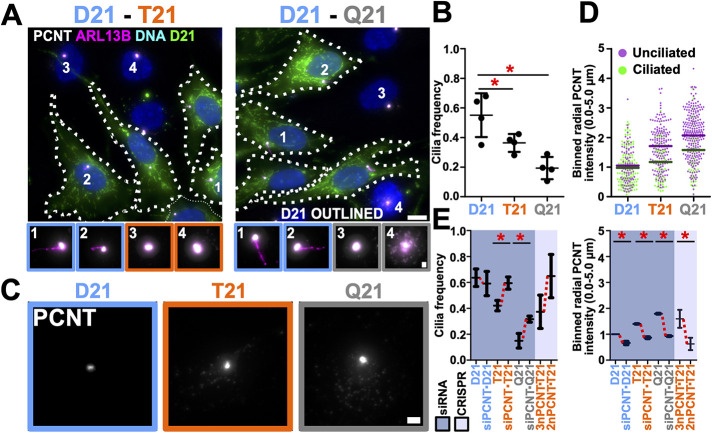
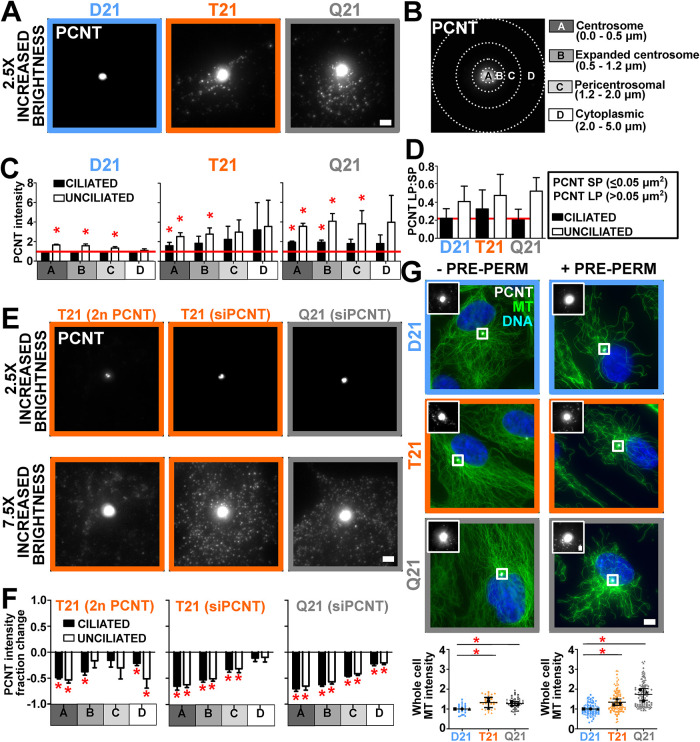
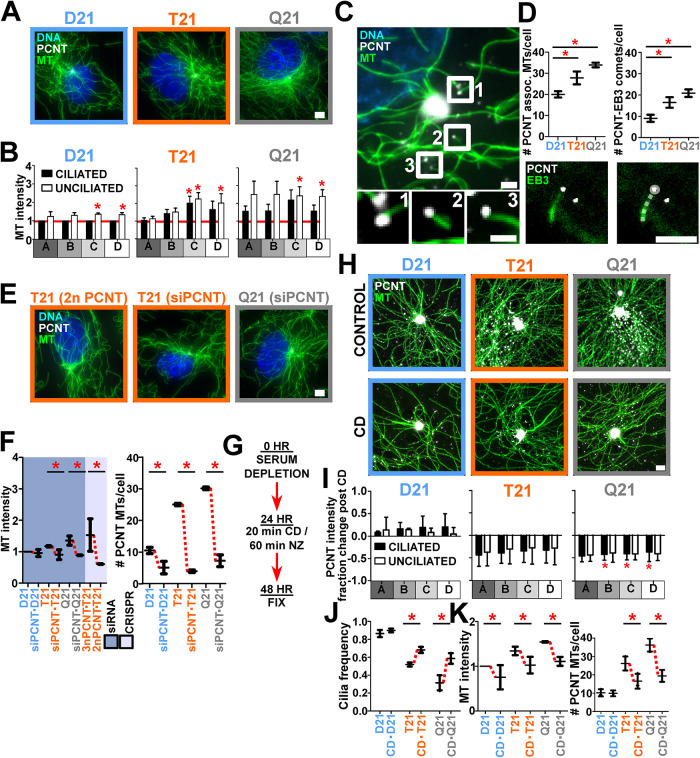
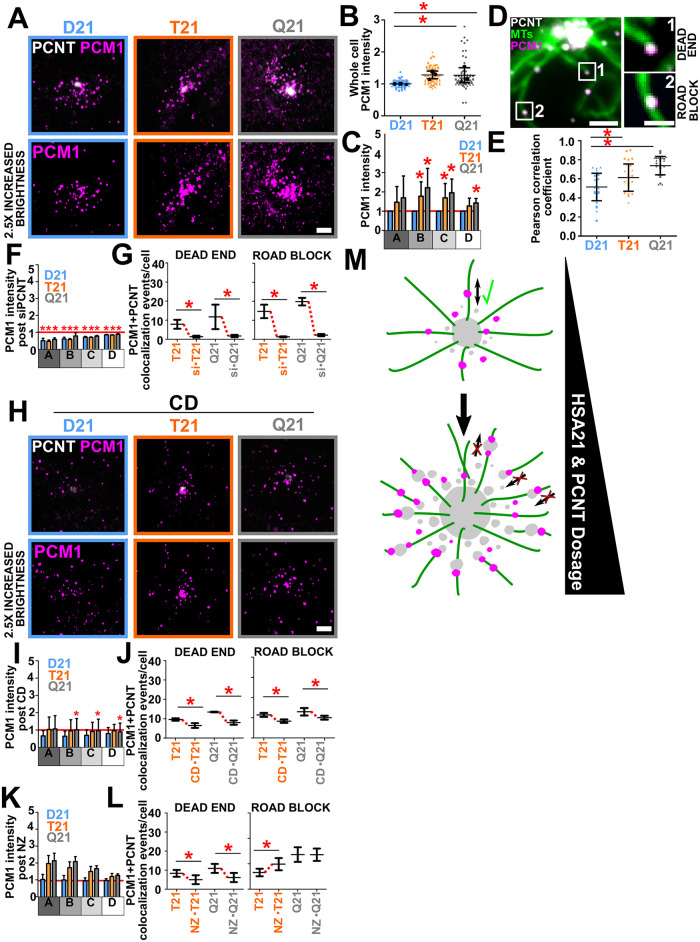
Trisomy 21, the source of Down syndrome, causes a 0.5-fold protein increase of the chromosome 21-resident gene Pericentrin (PCNT) and reduces primary cilia formation and signaling. We investigate how PCNT imbalances disrupt cilia. Using isogenic RPE-1 cells with increased chromosome 21 dosage, we find PCNT accumulates around the centrosome as a cluster of enlarged cytoplasmic puncta that localize along microtubules (MTs) and at MT ends. Cytoplasmic PCNT puncta impact the density, stability, and localization of the MT trafficking network required for primary cilia. The PCNT puncta appear to sequester cargo peripheral to centrosomes in what we call pericentrosomal crowding. The centriolar satellite proteins PCM1, CEP131, and CEP290, important for ciliogenesis, accumulate at enlarged PCNT puncta in trisomy 21 cells. Reducing PCNT when chromosome 21 ploidy is elevated is sufficient to decrease PCNT puncta and pericentrosomal crowding, reestablish a normal density of MTs around the centrosome, and restore ciliogenesis to wild-type levels. A transient reduction in MTs also decreases pericentrosomal crowding and partially rescues ciliogenesis in trisomy 21 cells, indicating that increased PCNT leads to defects in the MT network deleterious to normal centriolar satellite distribution. We propose that chromosome 21 aneuploidy disrupts MT-dependent intracellular trafficking required for primary cilia.


Figures

FIGURE 1:
FIGURE 1:
Elevated chromosome 21 dosage and PCNT disrupt primary cilia formation. (A) Left panel, cocultured disomy 21 (D21) and trisomy 21 (T21) RPE-1 cells stained for centrosomes (Pericentrin [PCNT]; grayscale), cilia (ARL13B; magenta), and DNA (Hoescht33258; blue). Right panel, analogously stained cocultured D21 and Q21 cells. D21 cells were CFSE stained (green) and outlined. Cell number labels are referenced in bottom panels. Scale bars, 10 μm and 1 μm for insets. (B) Cilia frequency decreases with HSA21 ploidy. Mean ± SD. *, p < 0.05 (Supplemental Table S1). (C) PCNT florescence at the centrosome (PCNT; grayscale) in D21, T21, and Q21 RPE-1 cells. Scale bar, 2 μm. (D) PCNT level increase with HSA21 ploidy and in unciliated relative to ciliated cells. Intensity values are normalized to D21 average. Data points represent PCNT fluorescence intensity within a 5-μm radius surrounding the centrosome. (E) Reducing PCNT via siRNA or CRISPR-Cas9 knockout of one allele of PCNT increases cilia frequencies in T21 and Q21 RPE-1 cells. Changes in mean values indicated with red lines. Intensity values normalized to D21 average. Data points represent PCNT fluorescence intensity within a 5-μm radius of the centrosome. Mean ± SD. *, p < 0.05 (Supplemental Table S1).
FIGURE 2:
FIGURE 2:
Elevated PCNT forms large puncta peripheral to the centrosome that disrupt cilia formation. (A) PCNT fluorescence (PCNT; grayscale) in D21, T21, and Q21 RPE-1 cells. Brightness increased by a factor of 2.5. Scale bar, 2 μm. (B) Centrosome (A), expanded centrosome (B), pericentrosomal (C), and cytoplasmic (D) regions for binned radial fluorescence intensity analysis from the centroid of the centrosome. (C) D21, T21, and Q21 regional binned PCNT fluorescence intensities. Intensity values normalized to ciliated D21 average (indicated with red line). Statistical comparisons made to ciliated D21 averages. Mean ± SD. *, p < 0.05 (Supplemental Table S1). (D) PCNT large puncta (LP) to small puncta (SP) ratios (LP:SP) in ciliated and unciliated D21, T21, and Q21 cells. Mean ± SD. (E) Regional PCNT fluorescence (PCNT; grayscale) in PCNT CRISPR-Cas9 knockout line (T21 [2n PCNT]) and cells treated with PCNT siRNA (T21 [siPCNT], Q21 [siPCNT]). Scale bar, 2 μm. Top panels, brightness increased by a factor of 2.5. Bottom panels, brightness increased by a factor of 7.5. (F) Reducing PCNT via CRISPR-Cas9 knockout of one allele in T21 and siRNA in T21 and Q21 RPE-1 cells reduces PCNT intensity at and peripheral to the centrosome. Graphical and statistical comparisons made to control intensities. Mean ± SD. *, p < 0.05 (Supplemental Table S1). (G) Left panels, D21, T21, and Q21 RPE-1 cells stained for MTs (DM1A; green), PCNT (PCNT; grayscale), and DNA (Hoescht 33258; blue). PCNT insets are shown for centrosomes. Brightness was increased for insets by a factor of 4. MTs were fixed without prepermeabilization (−PRE-PERM). Scale bar, 5.5 μm and 1 μm for insets. Right panels, D21, T21, and Q21 RPE-1 cells stained for MTs (DM1A; green), PCNT (PCNT; grayscale), and DNA (Hoescht 33258; blue). PCNT insets are shown for boxed centrosomes. Brightness was increased for insets by a factor of 4. MTs in these images were fixed with prepermeabilization (+PRE-PERM). Scale bar, 5.5 μm and 1 μm for insets. Left graph, D21, T21, and Q21 whole-cell MT fluorescence intensities without prepermeabilization. Right graph, D21, T21, and Q21 whole-cell MT fluorescence intensities with prepermeabilization. Intensity values are normalized to D21 average. Statistical comparisons made to D21 averages. Mean ± SD. *, p < 0.05 (Supplemental Table S1).
FIGURE 3:
FIGURE 3:
Large PCNT puncta nucleate free MTs that are associated with decreased ciliation. (A) D21, T21, and Q21 RPE-1 cells stained for MTs (DM1A; green), PCNT (PCNT; grayscale), and DNA (Hoescht 33258; blue). Prepermeabilization was performed before fixation. Scale bar, 4 μm. (B) D21, T21, and Q21 regional binned MT fluorescence intensities. Intensity values normalized to ciliated D21 average (indicated with red line). Statistical comparisons made to ciliated D21 averages. Mean ± SD. *, p < 0.05 (Supplemental Table S1). (C) PCNT localizes to MT ends. Unciliated D21 RPE-1 cell stained for MTs (DM1A; green) and PCNT (PCNT; grayscale). Labels are referenced in bottom panels. Scale bars, 2 μm and 0.75 μm for insets. (D) Top, HSA21 dosage increases PCNT colocalization at MT ends and PCNT-associated growing MTs. Bottom, RPE-1 cell labeled with EB3-mNeon and PCNT (PCNT; grayscale). Right panel includes a line trace of the EB3 comet. Scale bars, 2.5 μm. Mean ± SD. *, p < 0.05 (Supplemental Table S1). (E) CRISPR-Cas9 knockout line (T21 [2n PCNT]) and cells treated with PCNT siRNA (T21 [siPCNT], Q21 [siPCNT]) stained for MTs (DM1A; green), PCNT (PCNT; grayscale), and DNA (Hoescht33258; blue). Scale bar, 4 μm. (F) Left, reducing PCNT via siRNA in T21 and Q21 RPE-1or CRISPR-Cas9 knockout of one allele in T21 cells reduces MT intensities. Intensity values normalized to D21 average. Data points represent 5-μm binned radial MT fluorescence intensities. Right, reducing PCNT via siRNA reduces PCNT-associated MTs in D21, T21, and Q21 RPE-1 cells. Mean ± SD. *, p < 0.05 (Supplemental Table S1). (G) Timeline for cold-depolymerization (CD) and nocodazole (NZ) treatment experiments. (H) Top panels, D21, T21, and Q21 RPE-1 cells stained for MTs (DM1A; green) and PCNT (PCNT; grayscale). Bottom panels, D21, T21, and Q21 RPE-1 CD-treated cells stained for MTs (DM1A; green) and PCNT (PCNT; grayscale). Scale bar, 1.5 μm. (I) CD reduces PCNT intensities at and peripheral to the centrosome in T21 and Q21 RPE-1 cells. Statistical comparisons made to relative control intensities. Mean ± SD. *, p < 0.05 (Supplemental Table S1). (J) CD increases cilia frequencies in T21 and Q21 RPE-1 cells. Mean ± SD. *, p < 0.05 (Supplemental Table S1). (K) Left, CD reduces MT intensities in T21 and Q21 RPE-1 cells. Intensity values normalized to D21 average. Data points represent 5-μm binned radial MT fluorescence intensities. Right, CD reduces PCNT-associated MTs in D21, T21, and Q21 RPE-1 cells. Mean ± SD. *, p < 0.05 (Supplemental Table S1).
FIGURE 4:
FIGURE 4:
PCNT-associated free MTs and trafficking puncta inhibit proper localization of centriolar satellites. (A) D21, T21, and Q21 RPE-1 cells stained for PCNT (PCNT; grayscale) and PCM1 (PCM1; magenta). Brightness increased by a factor of 2.5. Scale bar, 3 μm. (B) D21, T21, and Q21 whole-cell PCM1 fluorescence intensity. Intensity values normalized to D21 average. Statistical comparisons made to D21 averages. Mean ± SD. *, p < 0.05 (Supplemental Table S1). (C) D21, T21, and Q21 regional binned PCM1 fluorescence intensities. Intensity values normalized to D21 average (indicated with red line). Statistical comparisons made to D21 averages. Mean ± SD. *, p < 0.05 (Supplemental Table S1). (D) PCM1 colocalizes with PCNT along MTs and at MT ends. Unciliated D21 RPE-1 cell stained for PCNT (PCNT; grayscale), MTs (DM1A; green), and PCM1 (PCM1; magenta). Labels are referenced in right panels. Scale bar, 2 μm and 1 μm for insets. (E) PCM1 and PCNT colocalization increases with HSA21 ploidy. Mean ± SD. *, p < 0.05 (Supplemental Table S1). (F) Reducing PCNT via siRNA reduces regional PCM1 intensities in D21, T21, and Q21 RPE-1 cells. Red line denotes D21 siControl intensity. Statistical comparisons made to control intensities for each cell type. Mean ± SD. *, p < 0.05 (Supplemental Table S1). (G) Reducing PCNT via siRNA reduces PCM1 colocalization with PCNT at MT ends (dead end) and along MTs (roadblock) in T21 and Q21 RPE-1 cells. Mean ± SD. *, p < 0.05 (Supplemental Table S1). (H) D21, T21, and Q21 RPE-1 CD-treated cells stained for PCNT (PCNT; grayscale) and PCM1 (PCM1; magenta). Fluorescence intensity brightness increased by a factor of 2.5. Scale bar, 3 μm. (I) CD reduces regional PCM1 intensities in D21, T21, and Q21 RPE-1 cells. Red line denotes D21 control intensity. Statistical comparisons made to relative control intensities for each cell type. Mean ± SD. *, p < 0.05 (Supplemental Table S1). (J) CD reduces PCM1 colocalization with PCNT at MT ends and along MTs in T21 and Q21 RPE-1 cells. Mean ± SD. *, p < 0.05 (Supplemental Table S1). (K) NZ does not reduce regional PCM1 intensity. Red line indicates D21 control intensity. (L) NZ reduces PCM1 colocalization with PCNT at MT ends and increases PCM1 colocalization with PCNT along MTs in T21 cells. Mean ± SD. *, p < 0.05 (Supplemental Table S1). (M) Elevated PCNT caused by HSA21 dosage increases PCNT at the centrosome (Figure 1; Galati et al., 2018), along MTs, and at MT ends. PCNT associated with MT ends are more distant from the centrosome and we propose that this population creates trafficking dead ends, inhibiting the ability for PCM1 to traffic to the centrosome. Enlarged PCNT puncta along MTs might increase trafficking roadblocks that inhibit the ability for PCM1 to traffic to and from the centrosome. The inability for proteins to efficiently traffic to and from the centrosome likely inhibits primary cilia formation. PCM1; magenta. PCNT; gray. MTs; green.

References

    1. Bernhard W, de Harven E (1960). L’ultrastructure du centriole et d’autres éléments de l’appareil achromatique. In Vierter Internationaler Kongress für Elektronenmikroskopie/Fourth International Conference on Electron Microscopy/Quatrième Congrès International de Microscopie Électronique: Berlin, September 10–17, 1958, Bargmann W., Möllenstedt G., Niehrs H., Peters D., Ruska E., Wolpers C. (eds.) (Springer, Berlin Heidelberg; ), pp. 217–227.
    1. Bettencourt-Dias M, Hildebrandt F, Pellman D, Woods G, Godinho SA (2011). Centrosomes and cilia in human disease. Trends Genet 27, 307–315. - PMC - PubMed
    1. Bornens M (2002). Centrosome composition and microtubule anchoring mechanisms. Curr Opin Cell Biol 14, 25–34. - PubMed
    1. Bornens M, Azimzadeh J (2007). Origin and evolution of the centrosome. Adv Exp Med Biol 607, 119–129. - PubMed
    1. Breslow DK, Holland AJ (2019). Mechanism and regulation of centriole and cilium biogenesis. Annu Rev Biochem 88, 691–724. - PMC - PubMed

Publication types