. 2022 Apr 27;14(642):eabn2263.
doi: 10.1126/scitranslmed.abn2263. Epub 2022 Apr 27.

Nonlesional lupus skin contributes to inflammatory education of myeloid cells and primes for cutaneous inflammation

Affiliations

Nonlesional lupus skin contributes to inflammatory education of myeloid cells and primes for cutaneous inflammation

Allison C Billi et al. Sci Transl Med. .

Abstract

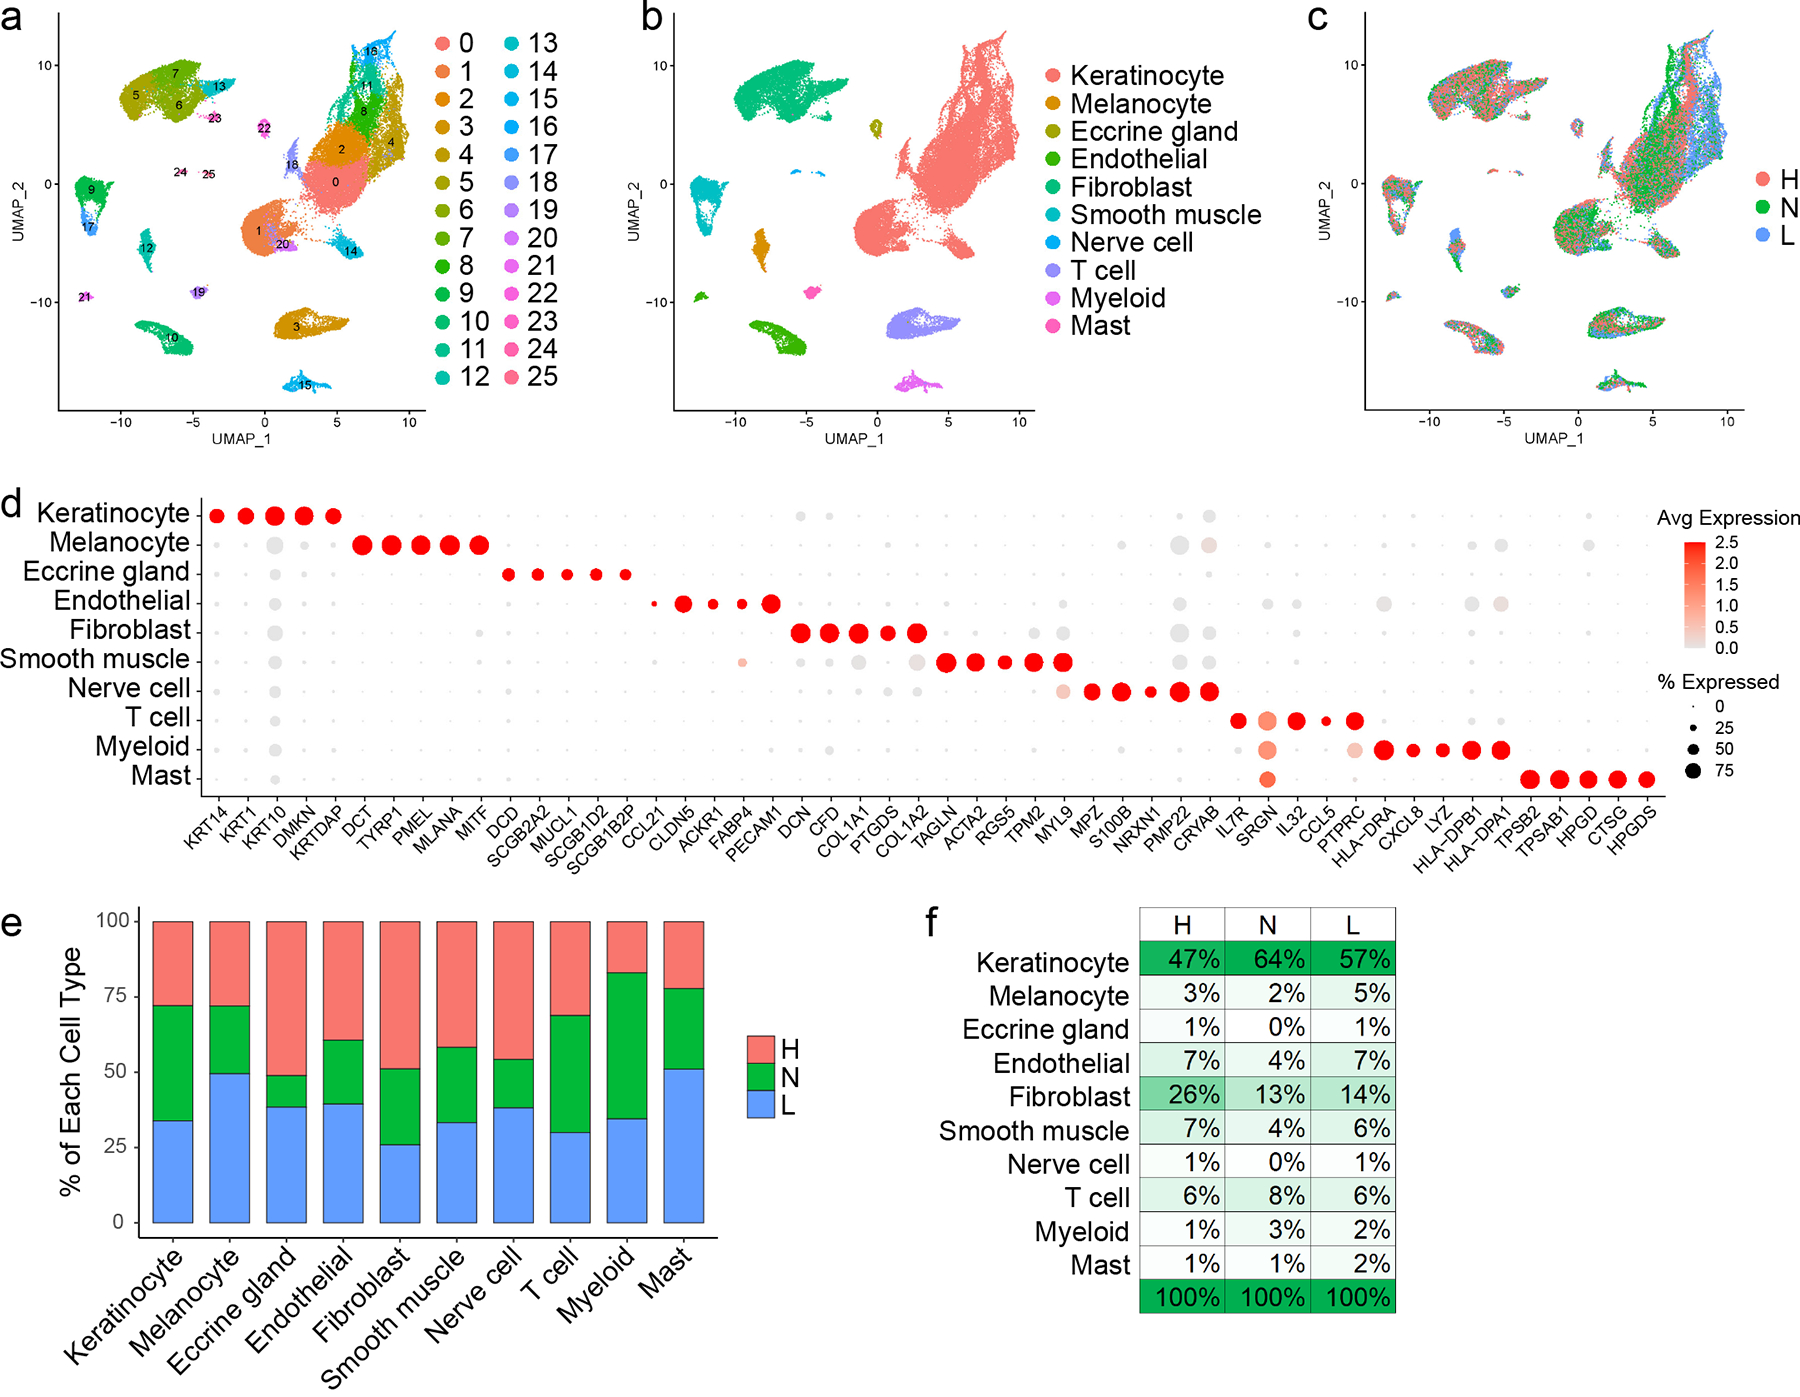
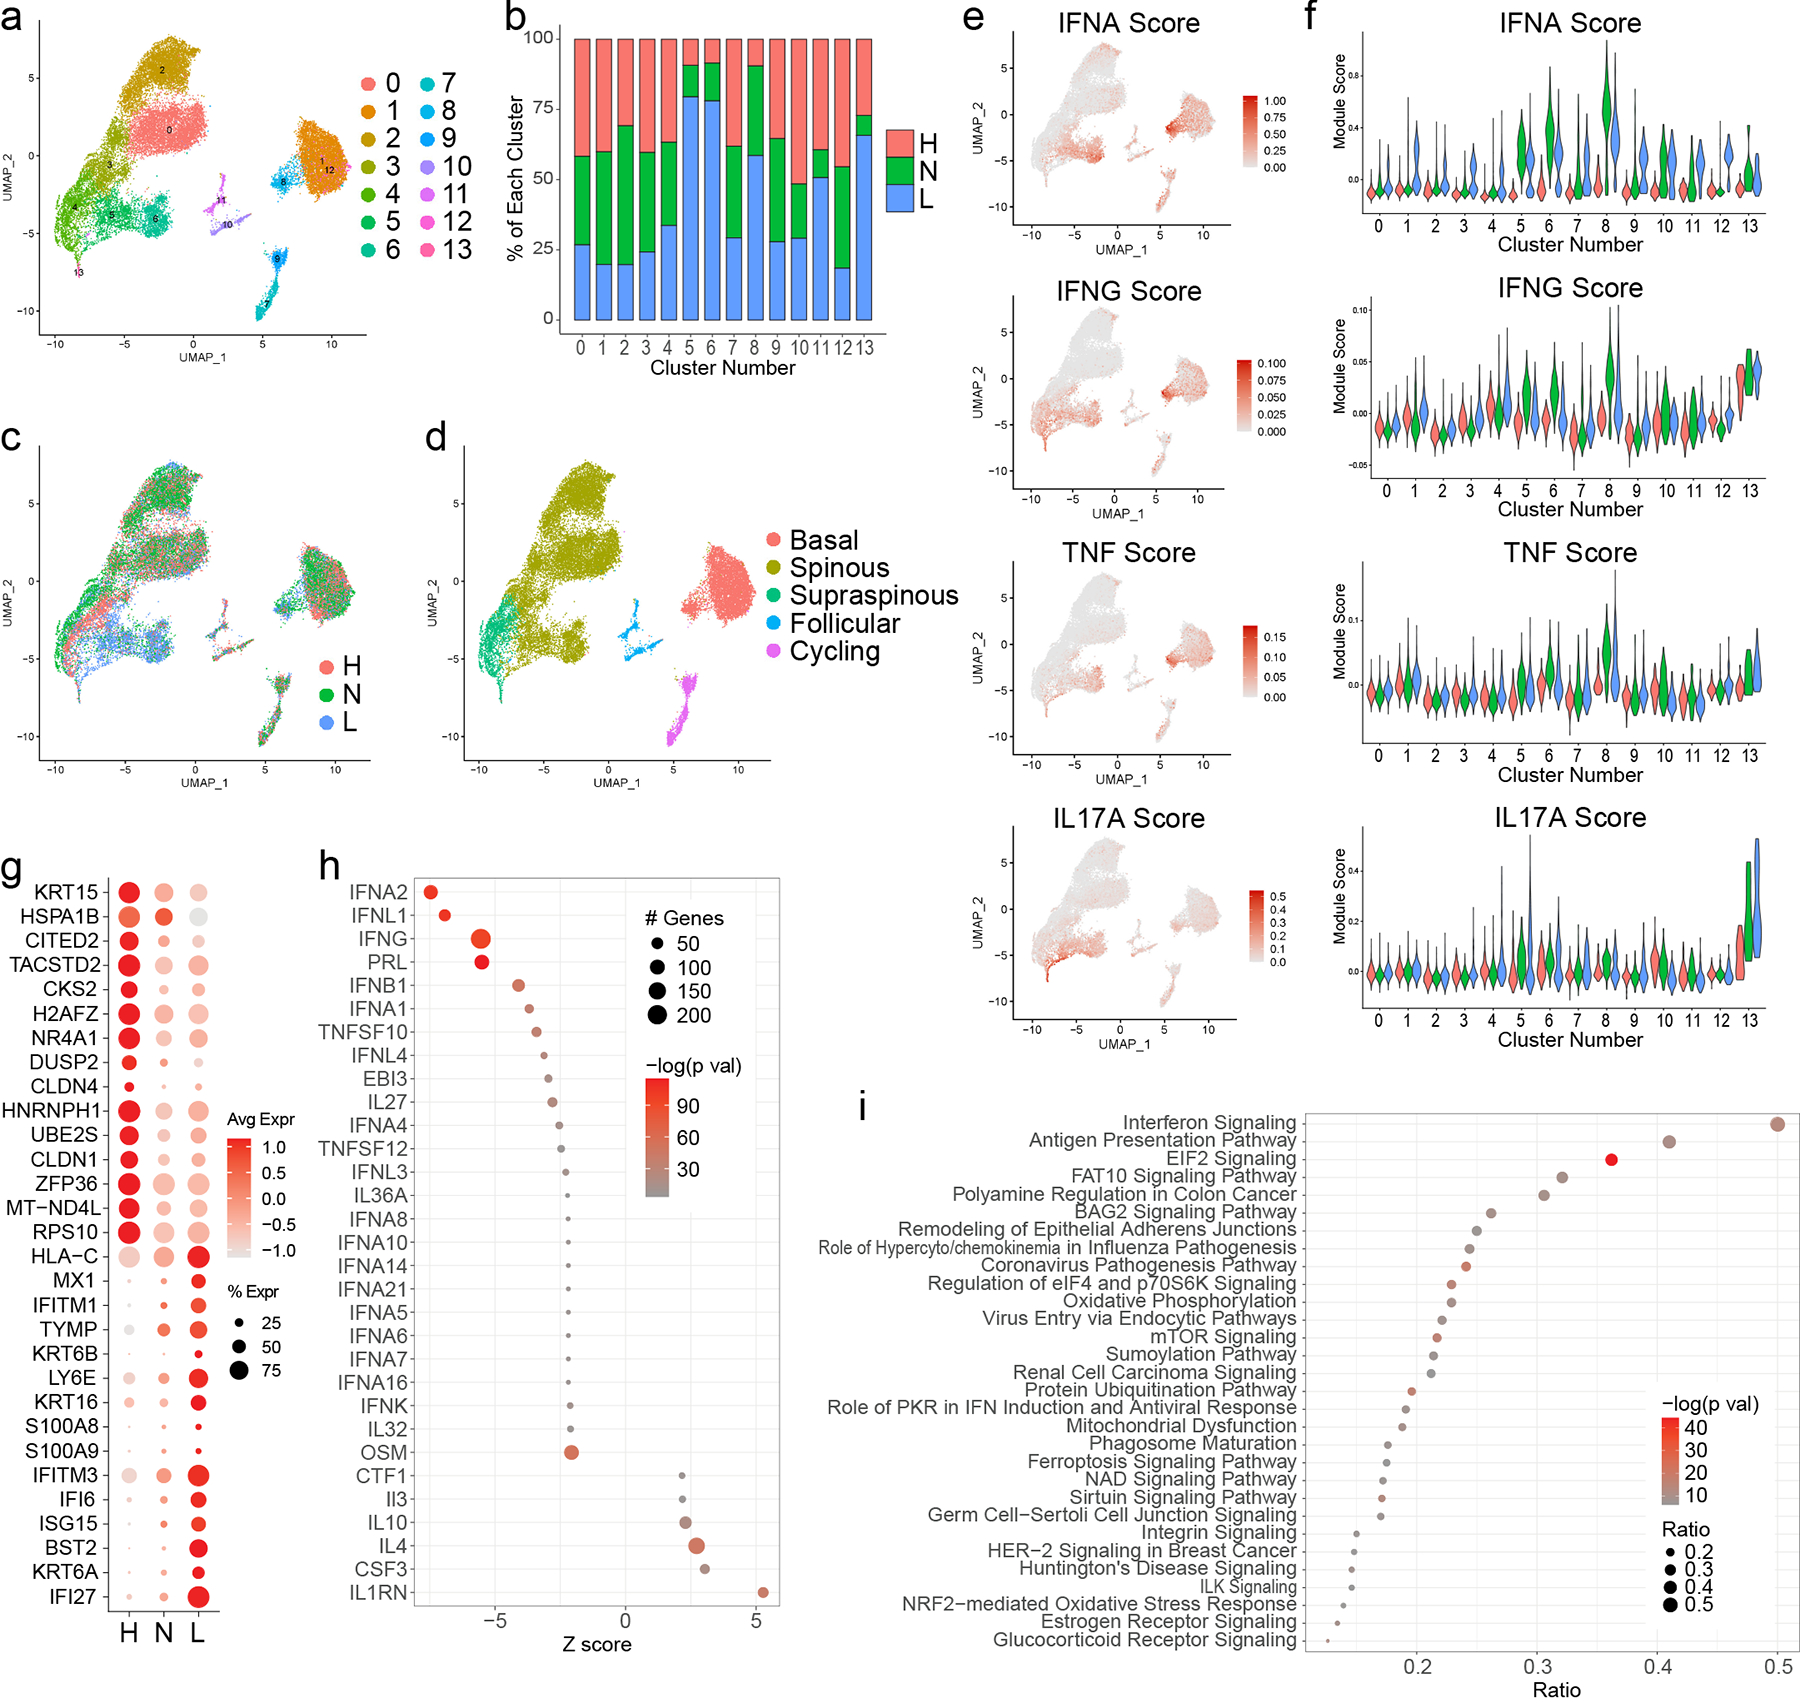
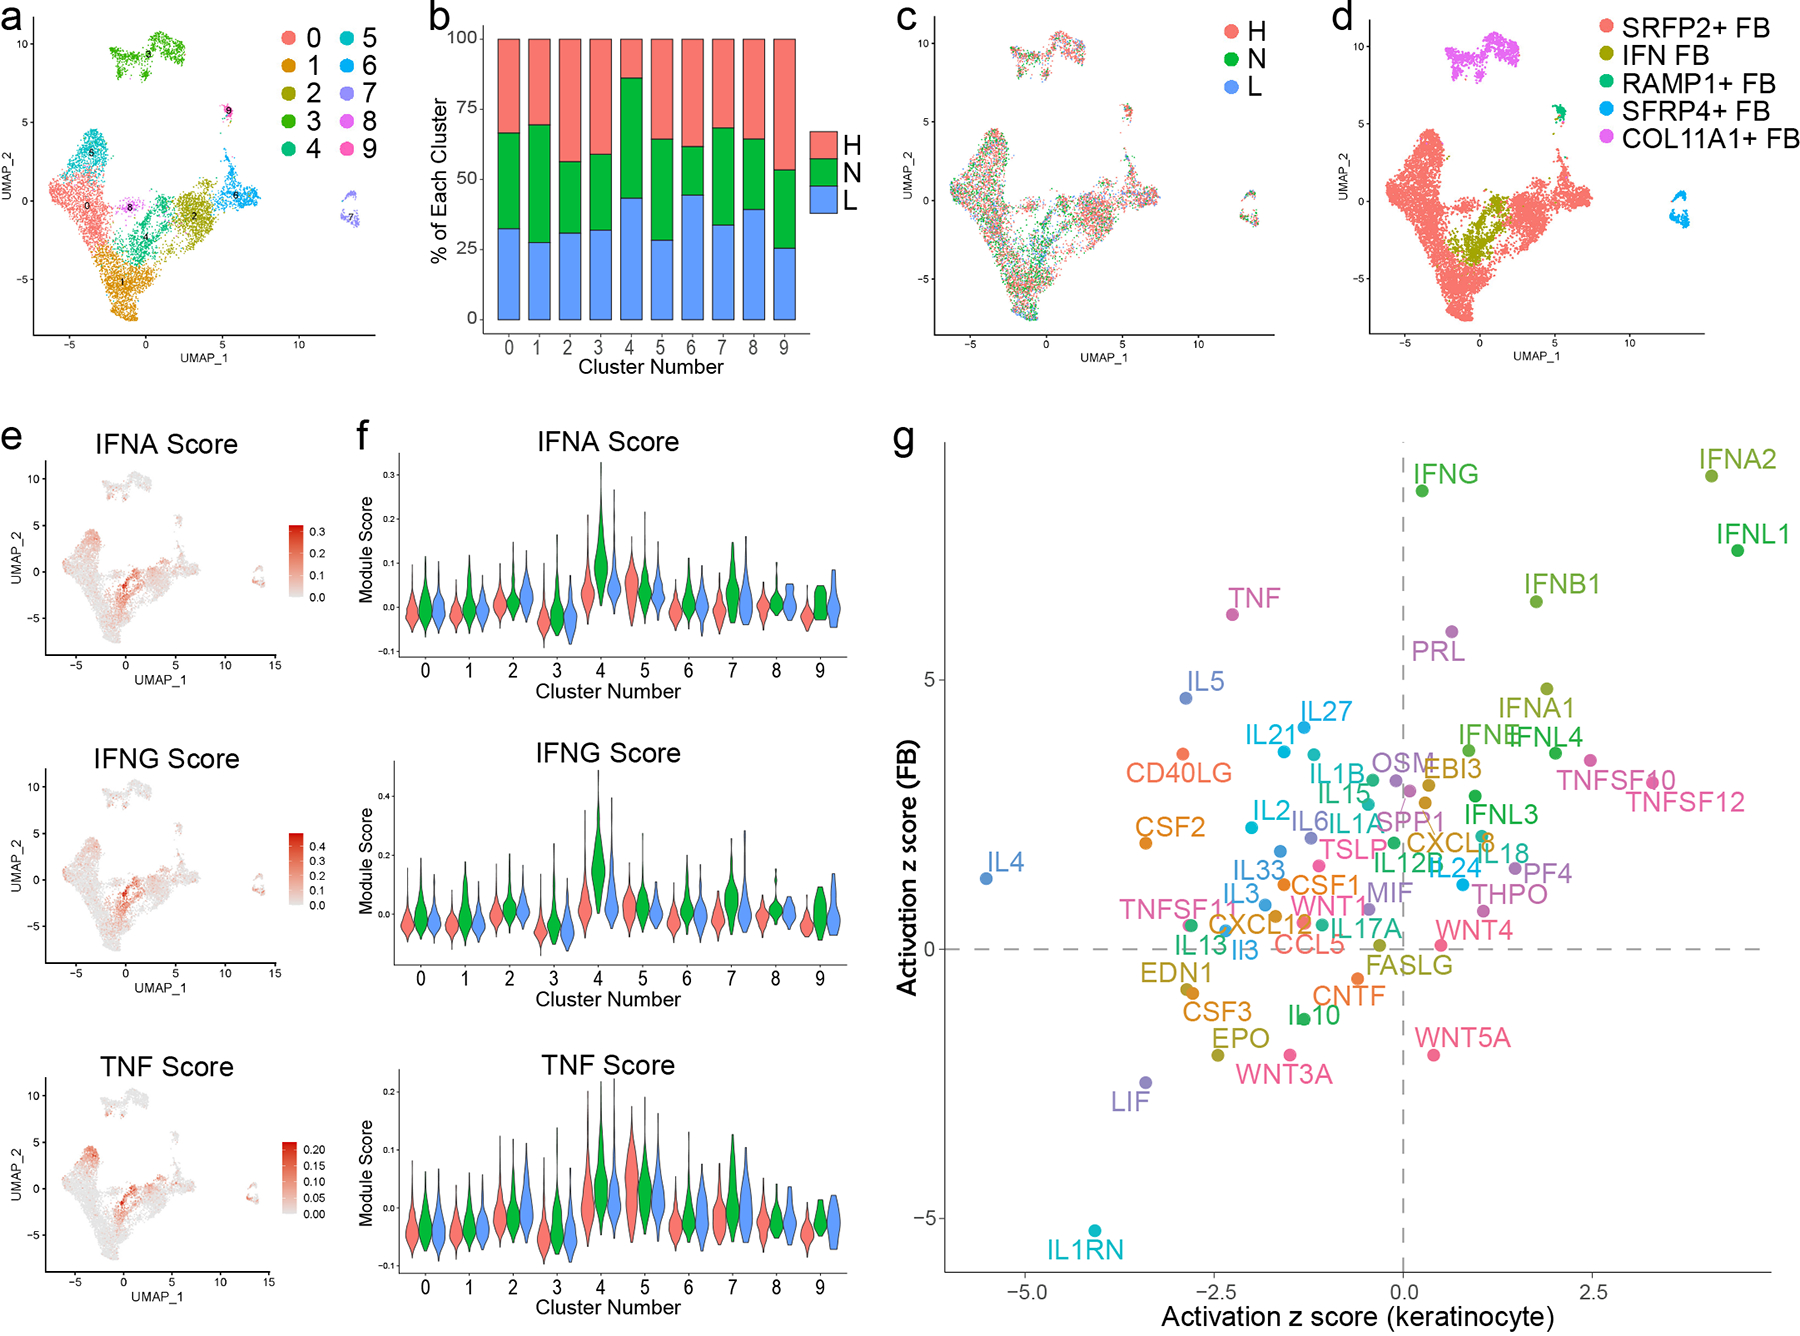
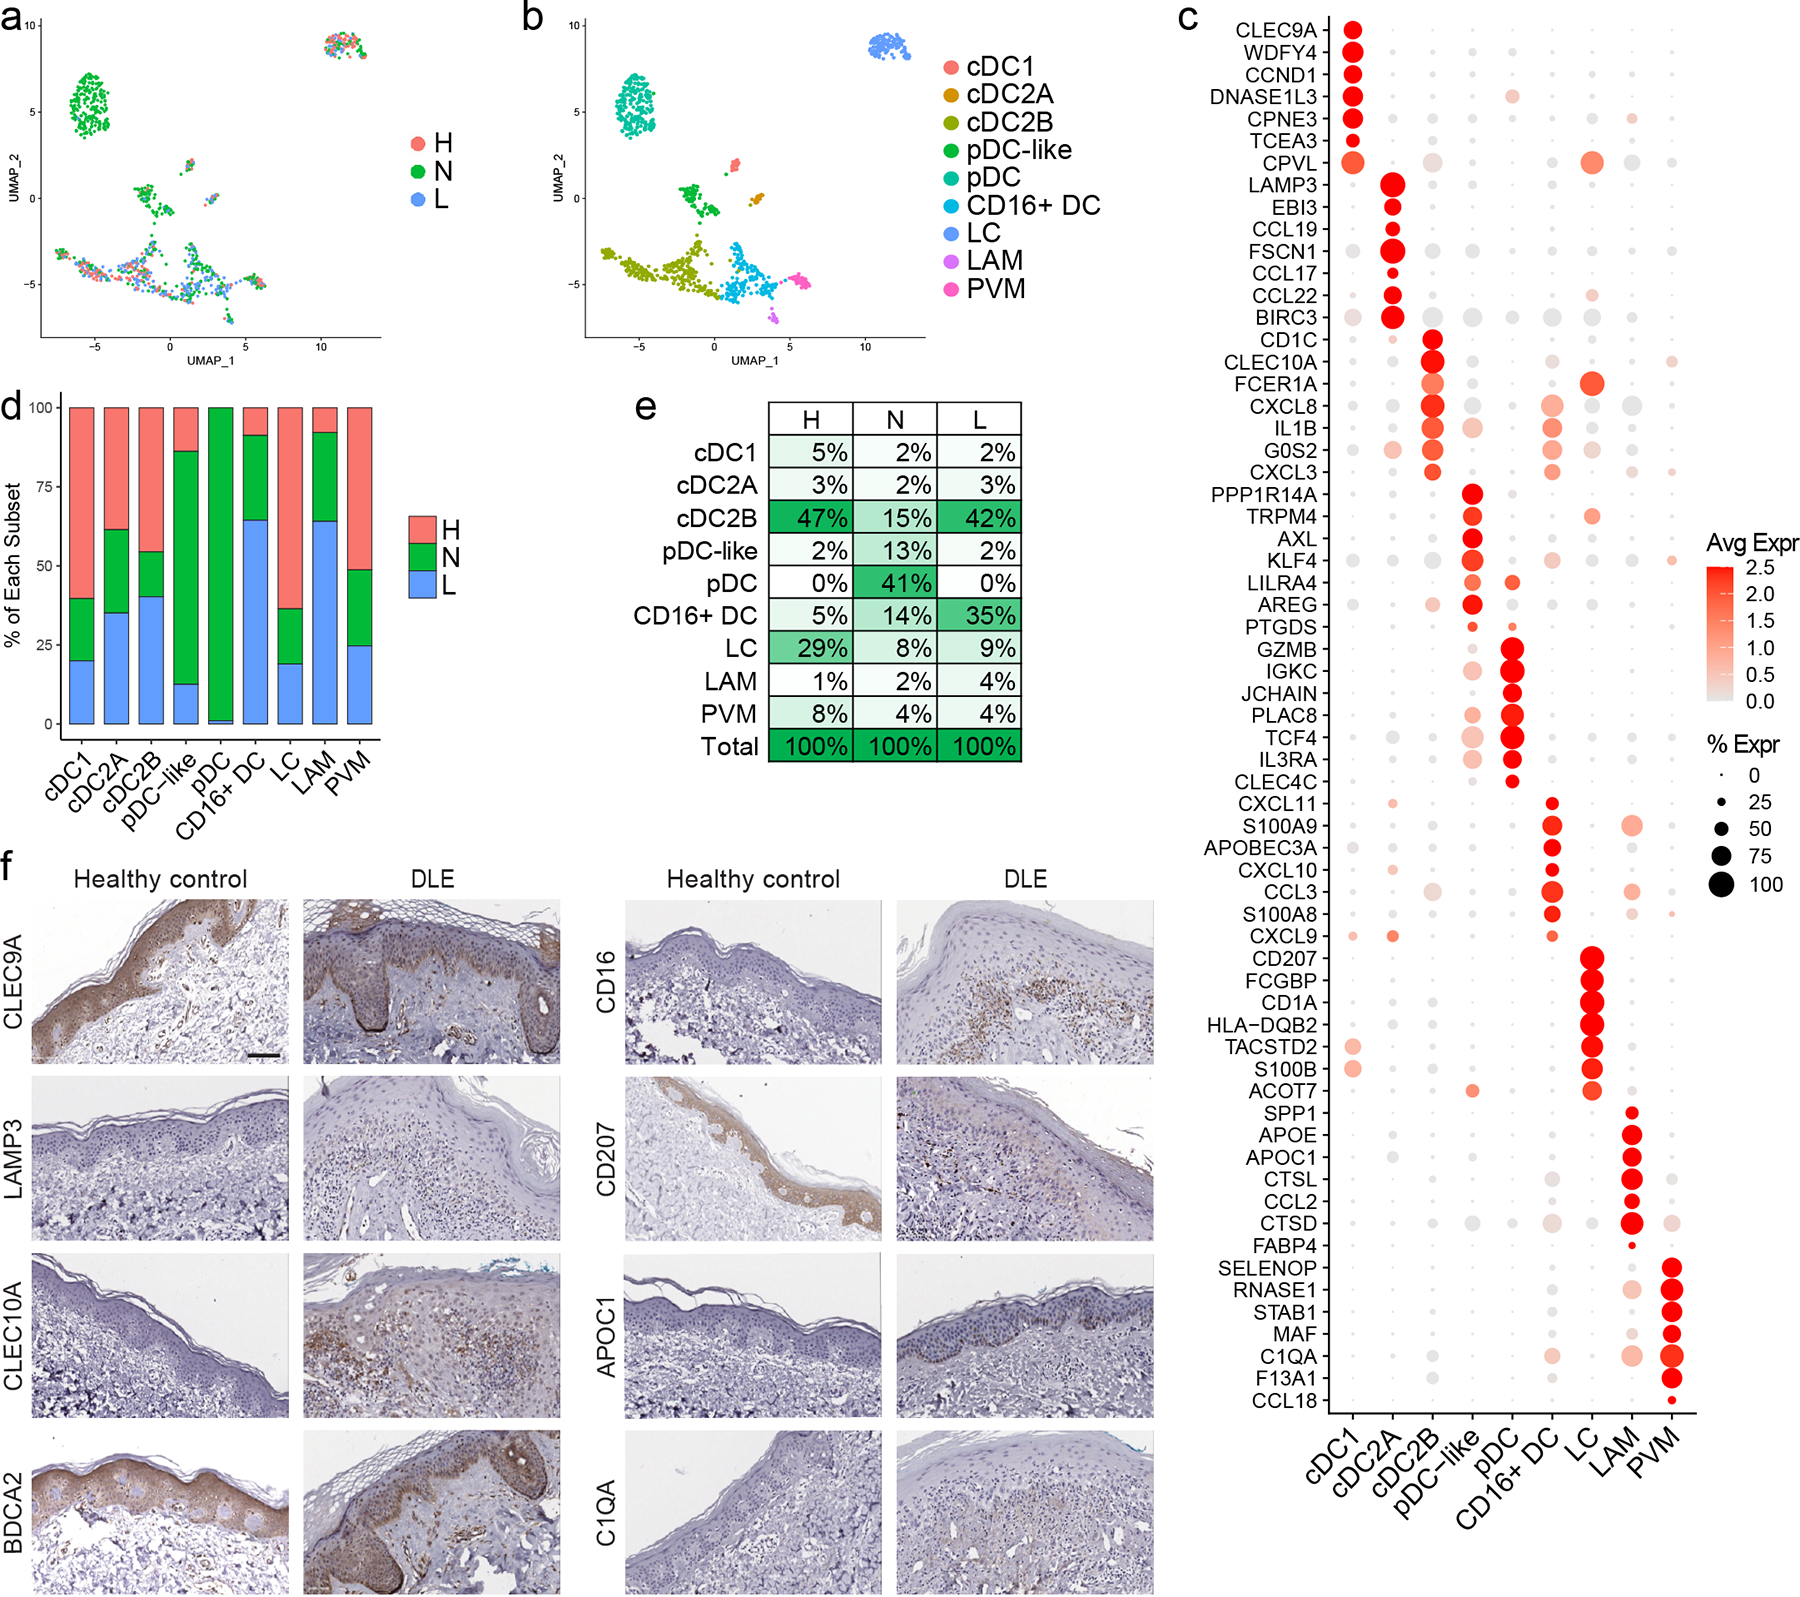
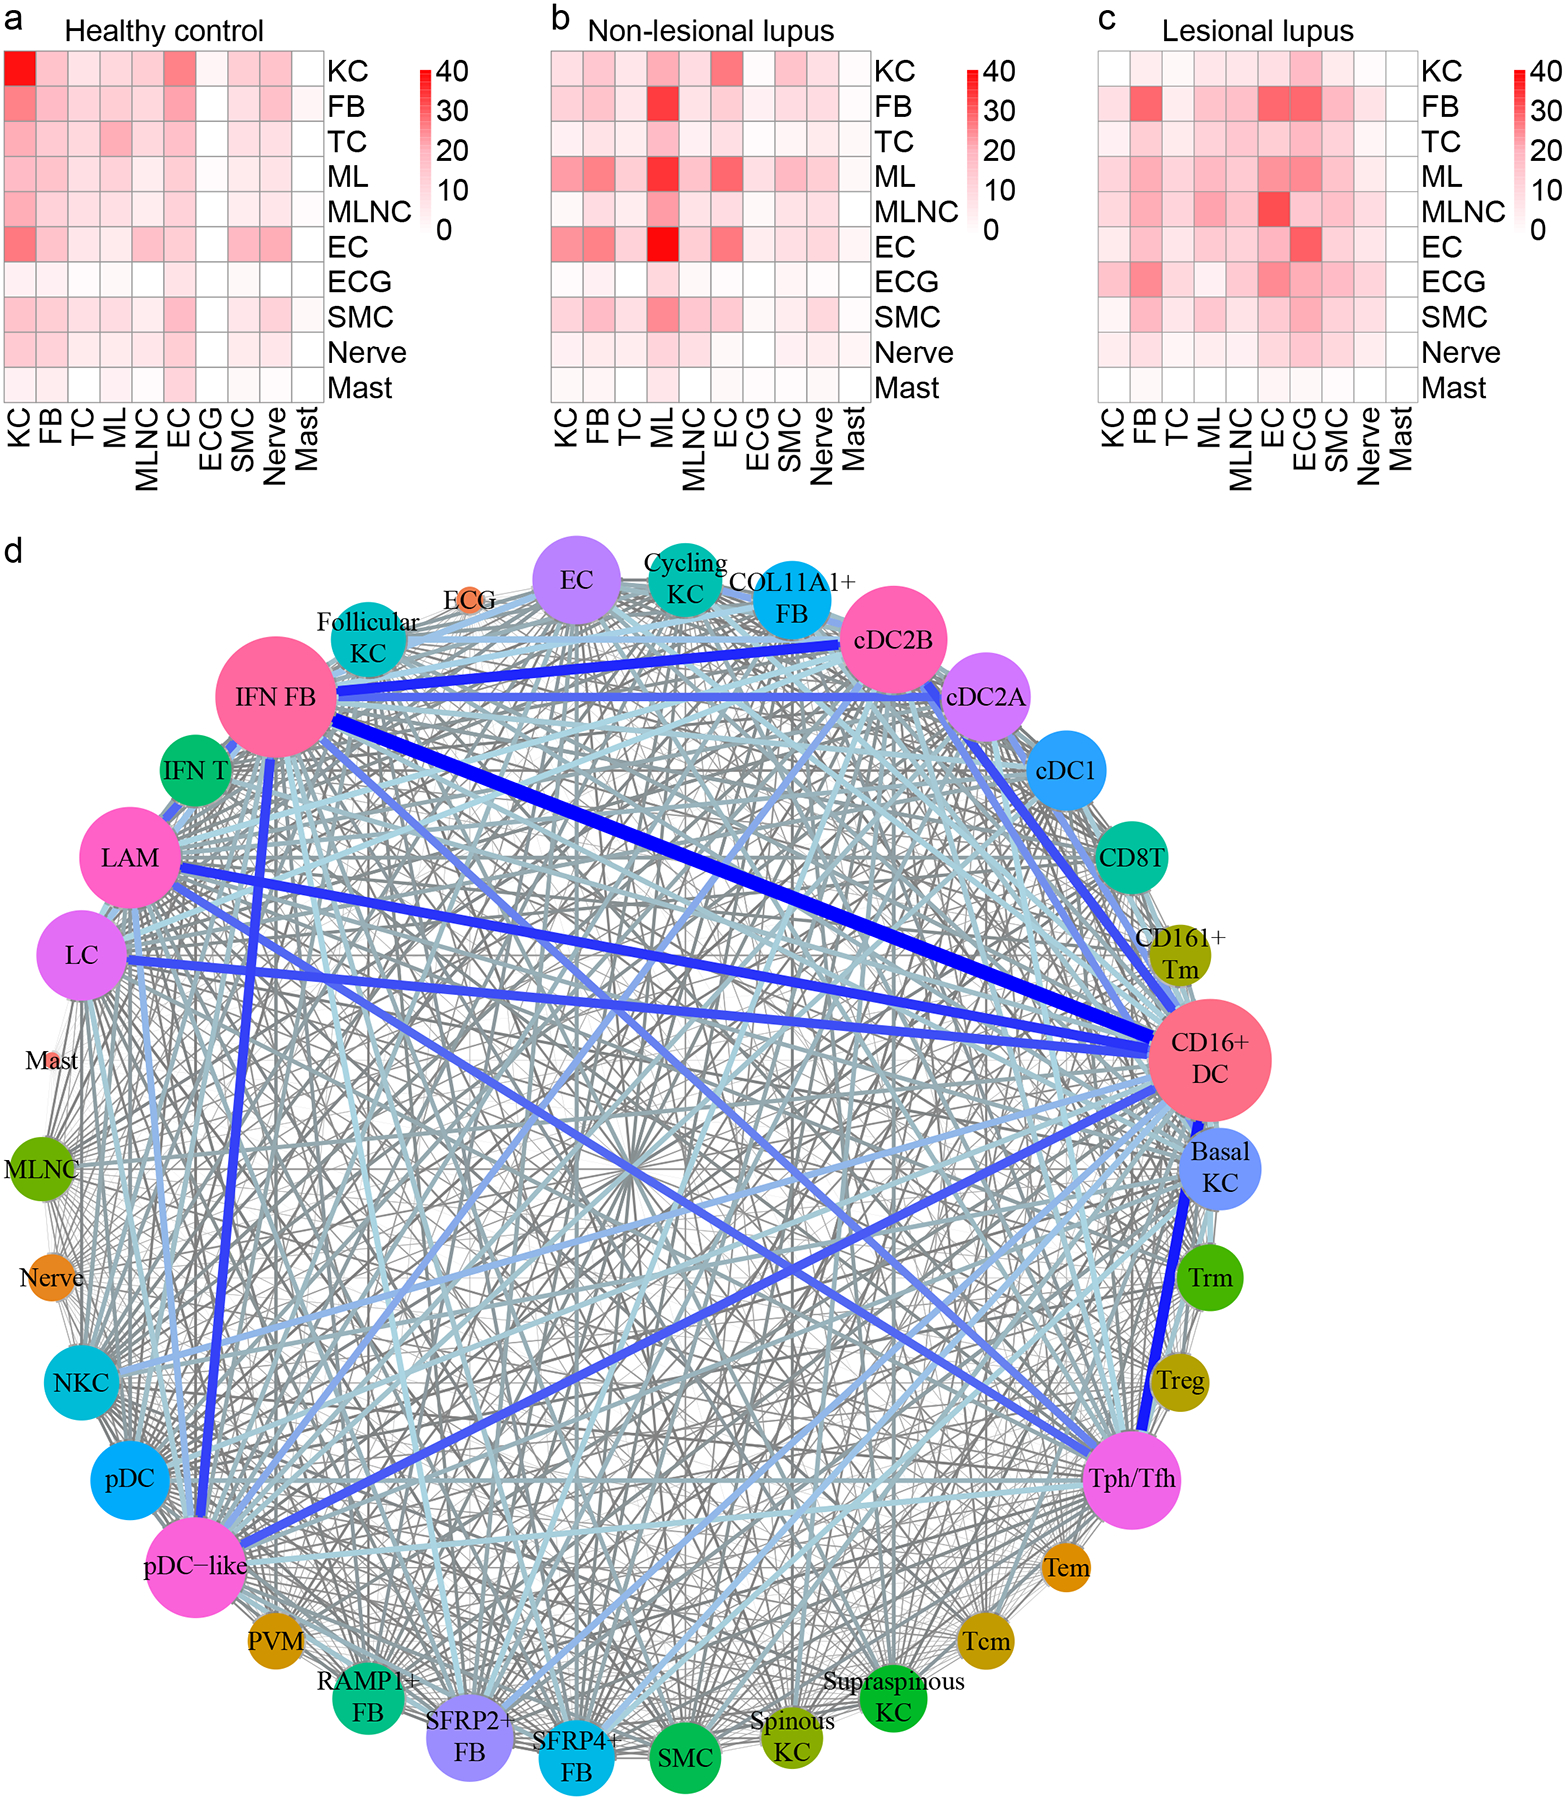
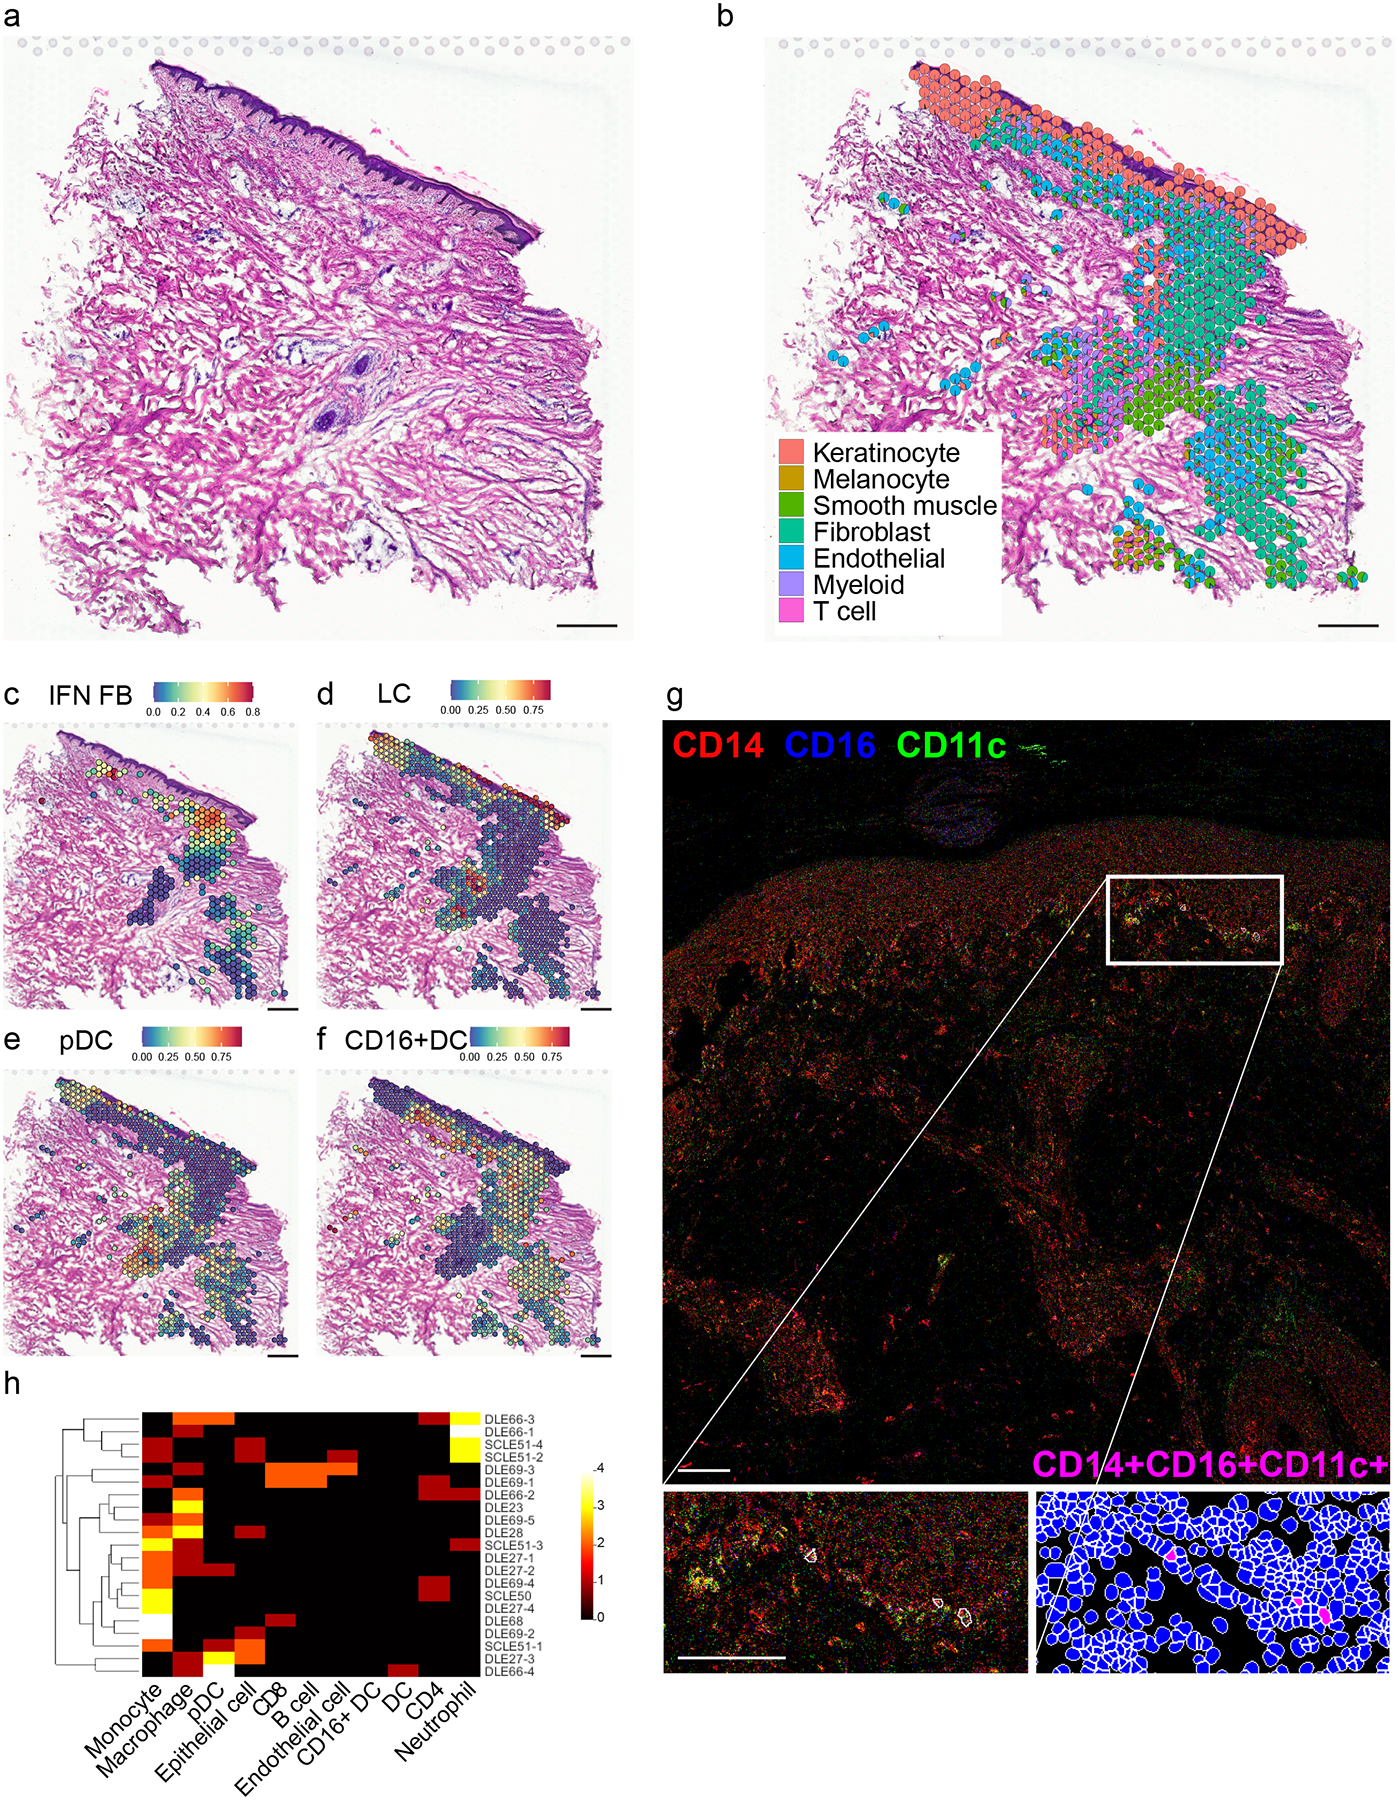
Cutaneous lupus erythematosus (CLE) is a disfiguring and poorly understood condition frequently associated with systemic lupus. Previous studies suggest that nonlesional keratinocytes play a role in disease predisposition, but this has not been investigated in a comprehensive manner or in the context of other cell populations. To investigate CLE immunopathogenesis, normal-appearing skin, lesional skin, and circulating immune cells from lupus patients were analyzed via integrated single-cell RNA sequencing and spatial RNA sequencing. We demonstrate that normal-appearing skin of patients with lupus represents a type I interferon-rich, prelesional environment that skews gene transcription in all major skin cell types and markedly distorts predicted cell-cell communication networks. We also show that lupus-enriched CD16+ dendritic cells undergo robust interferon education in the skin, thereby gaining proinflammatory phenotypes. Together, our data provide a comprehensive characterization of lesional and nonlesional skin in lupus and suggest a role for skin education of CD16+ dendritic cells in CLE pathogenesis.


Figures

Figure 1.
Figure 1.. Single-cell RNA-sequencing (scRNA-seq) captures the cellular diversity within lesional and non-lesional skin of patients with cutaneous lupus erythematosus (CLE).
a. UMAP plot of 46,540 cells colored by cluster. b. UMAP plot of cells colored by cell type. c. UMAP plot of cells colored by disease state (H, healthy control skin; N, non-lesional lupus skin; L, lesional lupus skin). d. Dot plot of representative marker genes for each cell type. Color scale, average marker gene expression. Dot size, percentage of cells expressing marker gene. e. Bar plot showing the relative contribution of the three disease states to the total number of each cell type. Values are normalized to the total number of cells for each disease state. f. Composition of cells recovered for each disease state by cell type.
Figure 2.
Figure 2.. Interferon (IFN) responses shape the transcriptomic landscape of both lesional and non-lesional keratinocytes in patients with CLE.
a. UMAP plot of 25,675 keratinocytes (KCs) colored by sub-cluster. b. Bar plot of each KC sub-cluster showing the relative contribution of the three disease states. Values are normalized to the total number of KCs for each disease state. c. UMAP plot of KCs colored by disease state. d. UMAP plot of KCs colored by subtype. e. Feature plots of module scores for the indicated KC cytokine modules. f. Violin plots of KC scores for the indicated cytokine modules split by disease state. g. Dot plot of the top 15 differentially expressed genes (DEGs) downregulated and upregulated in L vs. H basal KCs. Color scale, average marker gene expression. Dot size, percentage of cells expressing marker gene. h. Dot plot of the top 30 upstream regulators enriched among DEGs in L vs. H basal KCs. Color scale, −log10(p value) from the enrichment analysis. Dot size, number of DEGs corresponding to each upstream regulator. Negative Z score, enriched in L; positive, enriched in H. i. Dot plot of the top 30 canonical pathways enriched among DEGs in L vs. H basal KCs. Color scale, −log10(p value) from the enrichment analysis. Dot size, ratio of [number of pathway genes among the DEGs]/[total number of pathway genes].
Figure 3.
Figure 3.. Analysis of fibroblast (FB) heterogeneity in CLE patient skin identifies an IFN-responsive FB subtype present in both non-lesional and lesional skin.
a. UMAP plot of 8,622 FBs colored by sub-cluster. b. Bar plot of each FB sub-cluster showing the relative contribution of the three disease states. Values are normalized to the total number of FBs for each disease state. c. UMAP plot of FBs colored by disease state. d. UMAP plot of FBs colored by subtype. e. Feature plots of scores for the indicated FB cytokine module scores. f. Violin plots of FB module scores for the indicated cytokine modules split by disease state. g. Scatter plot showing activation z scores for cytokine upstream regulators common to basal KCs (N vs. H) and IFN FBs (N) vs. SFRP2+ FBs (H).
Figure 4.
Figure 4.. Skin of CLE patients exhibits an abnormal T cell infiltrate at both lesional and non-lesional sites.
a. UMAP plot of 3,030 T cells colored by disease state. b. UMAP plot of T cells colored by subset. Tcm, central memory T cells; Tem, effector memory T cells; Trm, tissue-resident memory T cells; CD161+ Tm, CD161+ memory T cells; Treg, probable regulatory T cells; Tph/Tfh, T peripheral helper and/or T follicular helper cells; IFN T, interferon T cells; CD8T, CD8+ T cells; NKC, natural killer cells. c. Dot plot of representative marker genes for each T cell subset. Color scale, average marker gene expression. Dot size, percentage of cells expressing marker gene. d. Bar plot of each T cell subset showing the relative contribution of the three disease states. Values are normalized to the total number of T cells for each disease state. e. Dot plot of the top 15 differentially expressed genes (DEGs) downregulated and upregulated in N vs. H Tregs.
Figure 5.
Figure 5.. Non-lesional skin of CLE patients shows major myeloid cell subset shifts including infiltration of plasmacytoid and CD16+ dendritic cells.
a. UMAP plot of 973 myeloid cells colored by disease state. b. UMAP plot of myeloid cells colored by subset. cDC1, classical type 1 dendritic cells (DCs); cDC2A, classical type 2 DC subset A; cDC2B, classical type 2 DC subset B; pDC, plasmacytoid DC; DC, dendritic cell; LC, Langerhans cell; LAM, lipid-associated macrophage; PVM, perivascular macrophage. c. Dot plot of representative marker genes for each myeloid cell subset. Color scale, average marker gene expression. Dot size, percentage of cells expressing marker gene. d. Bar plot of each myeloid cell subset showing the relative contribution of the three disease states. Values are normalized to the total number of myeloid cells for each disease state. e. Percentage of cells in each myeloid cell subset divided by disease state. f. Immunostaining for the indicated marker genes for each myeloid cell subset in healthy control and discoid lupus erythematosus (DLE) lesional skin. CLEC9A, cDC1; LAMP3, cDC2A; CLEC10A, cDC2B; BDCA2, pDC; CD16, CD16+ DC; CD207, LC; APOC1, LAM; and C1QA, PVM. Scale bar, 50 μm. Images are representative of 2 healthy control and 3 DLE sections.
Figure 6.
Figure 6.. Ligand-receptor (L-R) analysis indicates major shifts in cell-cell communication in CLE and identifies CD16+ DCs as the top candidate cellular interactors in non-lesional skin.
a. Heatmap depicting the number of L-R pairs with interaction scores highest in H samples divided by cell type. Row, cell type expressing the ligand; column, cell type expressing the receptor. Color scale, number of L-R pairs. TC, T cell; ML, myeloid cell; MLNC, melanocyte; EC, endothelial cell; ECG; eccrine gland cell; SMC, smooth muscle cell. b. Heatmap depicting the number of L-R pairs with interaction scores highest in N samples. c. Heatmap depicting the number of L-R pairs with interaction scores highest in L samples. d. Connectome web analysis of interacting cell types in N samples. Vertex (colored cell node) size is proportional to the number of interactions to and from that cell type, whereas the thickness of the connecting lines is proportional to the number of interactions between two nodes.
Figure 7.
Figure 7.. Spatial sequencing reinforces the effects of IFN-producing interfollicular KCs on CD16+ DCs and FBs in the superficial dermis.
N=4 biological replicates; data are shown for the most complex sample as defined by the highest number of spots after quality control steps. a. Hematoxylin and eosin staining of DLE tissue section corresponding to spatial sequencing data below. Scale bar, 200 μm. b. Spatial scatter pie plot showing cell type composition based on detection of scRNA-seq signatures corresponding to 7 cell types. Each spot is represented as a pie chart showing relative cell type proportions. Spot coordinates correspond to tissue location. c. Spatial heatmap of the IFN FB subset gene signature. Color, scaled expression of each subset gene signature. Only spots meeting a FB prediction score threshold of 0.25 are shown. d. Spatial heatmap of the LC subset gene signature. All spots are shown. e. Spatial heatmap of the pDC subset gene signature. All spots are shown. f. Spatial heatmap of the CD16+ DC subset gene signature. All spots are shown. g. Representative image of a DLE skin section showing the localization of CD16+ DCs (as indicated by the CD14+CD11c+CD16+ immunophenotype) generated by imaging mass cytometry. Scale bar, 100 μm. Insets, subepidermal enrichment of CD16+ DCs. h. Heatmap depicting the number of the indicated cell types (columns) located within 4μm of each of the CD16+ DCs (rows) located across 6 DLE (N=16 CD16+ DCs) and 2 subacute CLE (SCLE; N=5 CD16+ DCs) sections. Color scale, number of neighboring cells.
Figure 8.
Figure 8.. Pseudotime analysis suggests CD16+ DCs arise from non-classical monocytes (ncMos) that migrate into skin of lupus patients and undergo IFN education.
a. UMAP plot of 6,576 myeloid cells from skin and peripheral blood mononuclear cells (PBMCs) colored by origin and disease state. H, healthy skin; N, non-lesional lupus skin; L, lesional lupus skin; HP, healthy PBMCs; LP, lupus PBMCs. b. UMAP plot of myeloid cells colored by subset. Red ellipse, bridge between circulating and skin-derived myeloid cells consisting of non-classical monocyte (ncMo) and CD16+ DC subsets. Mono, monocytes. c. Bar plot of each myeloid cell subset showing the relative contribution of H, N, L, HP, and LP samples. Values are normalized to the total number of myeloid cells for each sample type. d. Dot plot of representative marker genes for each myeloid cell subset. Color scale, average marker gene expression. Dot size, percentage of cells expressing marker gene. e. Pseudotime trajectory of ncMos and CD16+ DCs colored by origin and disease state (top), by subset (mid), and by pseudotime (bottom). X-axis, component 1; Y-axis, component 2. f. Pseudotime heatmap depicting expression of significant marker genes corresponding to 5 expression patterns that span the transition from ncMo to CD16+ DC. Color scale, scaled marker gene expression across pseudotime. g. Pseudotime heatmap depicting expression of the top 80 marker genes across the transition from ncMo to CD16+ DC. Color scale, scaled marker gene expression across pseudotime. h. Scatter plots depicting scores for the indicated upstream regulators for each cell across pseudotime. X-axis, pseudotime; Y-axis, module score. i. Dot plot of CD16+ DC gene scores for lesional skin biopsies from healthy controls (N=13) and CLE patients (N=90) analyzed by microarray. j. Dot plot presenting the same data as in i split by CLE subtype and presence vs. absence of SLE. N=28, 19, 20, and 23 for DLE −SLE, DLE +SLE, SCLE −SLE, and SCLE +SLE, respectively.

Comment in

Similar articles

Cited by

References

    1. Chasset F, Arnaud L, Costedoat-Chalumeau N, Zahr N, Bessis D, Frances C, The effect of increasing the dose of hydroxychloroquine (HCQ) in patients with refractory cutaneous lupus erythematosus (CLE): An open-label prospective pilot study. Journal of the American Academy of Dermatology, (2016). - PubMed
    1. Sarkar MK, Hile GA, Tsoi LC, Xing X, Liu J, Liang Y, Berthier CC, Swindell WR, Patrick MT, Shao S, Tsou PS, Uppala R, Beamer MA, Srivastava A, Bielas SL, Harms PW, Getsios S, Elder JT, Voorhees JJ, Gudjonsson JE, Kahlenberg JM, Photosensitivity and type I IFN responses in cutaneous lupus are driven by epidermal-derived interferon kappa. Ann Rheum Dis 77, 1653–1664 (2018). - PMC - PubMed
    1. Stannard JN, Reed TJ, Myers E, Lowe L, Sarkar MK, Xing X, Gudjonsson JE, Kahlenberg JM, Lupus Skin Is Primed for IL-6 Inflammatory Responses through a Keratinocyte-Mediated Autocrine Type I Interferon Loop. The Journal of investigative dermatology 137, 115–122 (2017). - PMC - PubMed
    1. Psarras A, Alase A, Antanaviciute A, Carr IM, Md Yusof MY, Wittmann M, Emery P, Tsokos GC, Vital EM, Functionally impaired plasmacytoid dendritic cells and non-haematopoietic sources of type I interferon characterize human autoimmunity. Nat Commun 11, 6149 (2020). - PMC - PubMed
    1. Der E, Suryawanshi H, Morozov P, Kustagi M, Goilav B, Ranabothu S, Izmirly P, Clancy R, Belmont HM, Koenigsberg M, Mokrzycki M, Rominieki H, Graham JA, Rocca JP, Bornkamp N, Jordan N, Schulte E, Wu M, Pullman J, Slowikowski K, Raychaudhuri S, Guthridge J, James J, Buyon J, Tuschl T, Putterman C, A. Accelerating Medicines Partnership Rheumatoid, C. Systemic Lupus Erythematosus, Tubular cell and keratinocyte single-cell transcriptomics applied to lupus nephritis reveal type I IFN and fibrosis relevant pathways. Nat Immunol 20, 915–927 (2019). - PMC - PubMed

Publication types

Substances