. 2022 Apr 27;14(642):eabm5527.
doi: 10.1126/scitranslmed.abm5527. Epub 2022 Apr 27.

TAU ablation in excitatory neurons and postnatal TAU knockdown reduce epilepsy, SUDEP, and autism behaviors in a Dravet syndrome model

Affiliations

TAU ablation in excitatory neurons and postnatal TAU knockdown reduce epilepsy, SUDEP, and autism behaviors in a Dravet syndrome model

Eric Shao et al. Sci Transl Med. .

Abstract

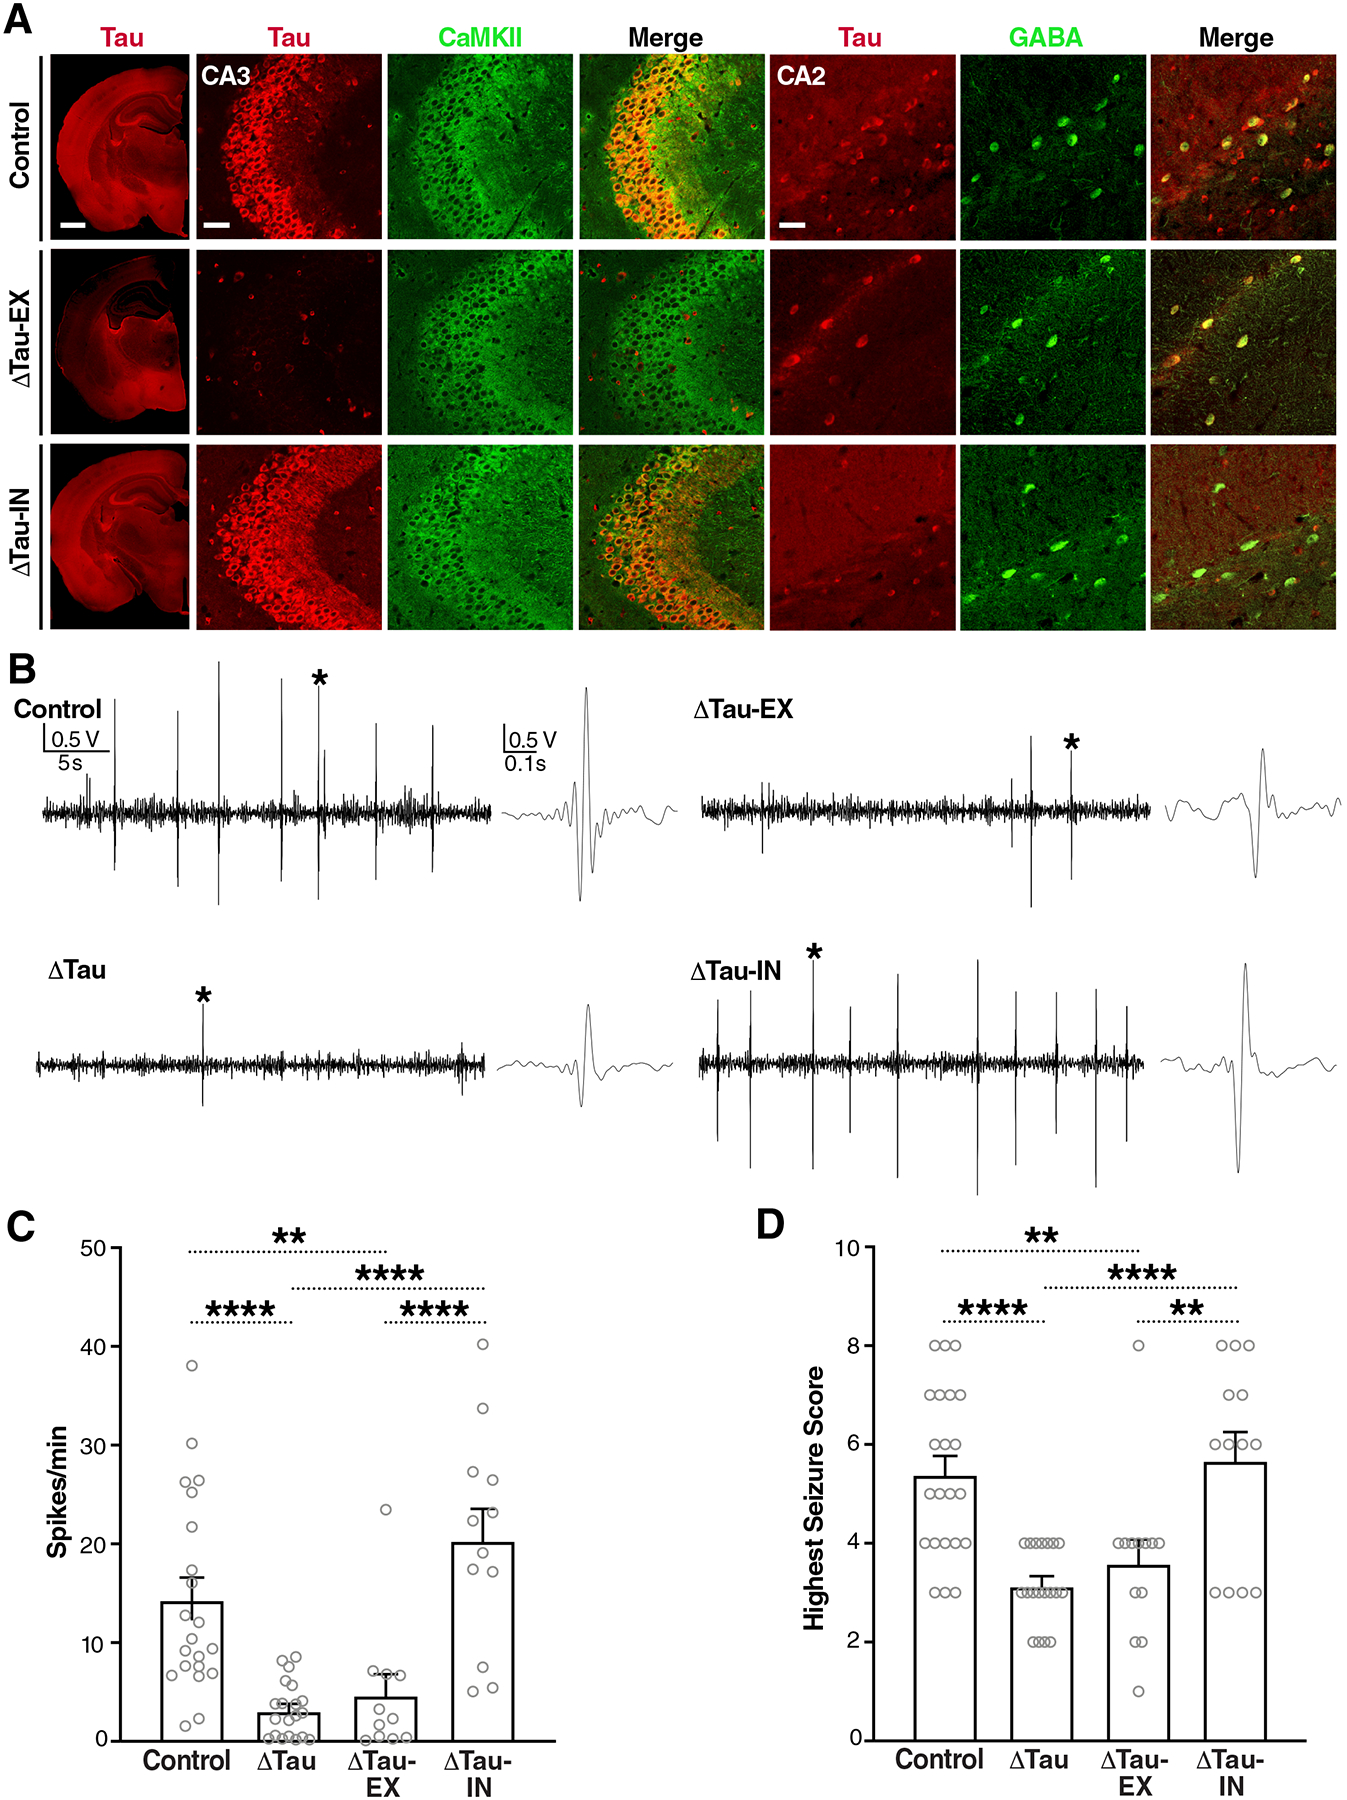
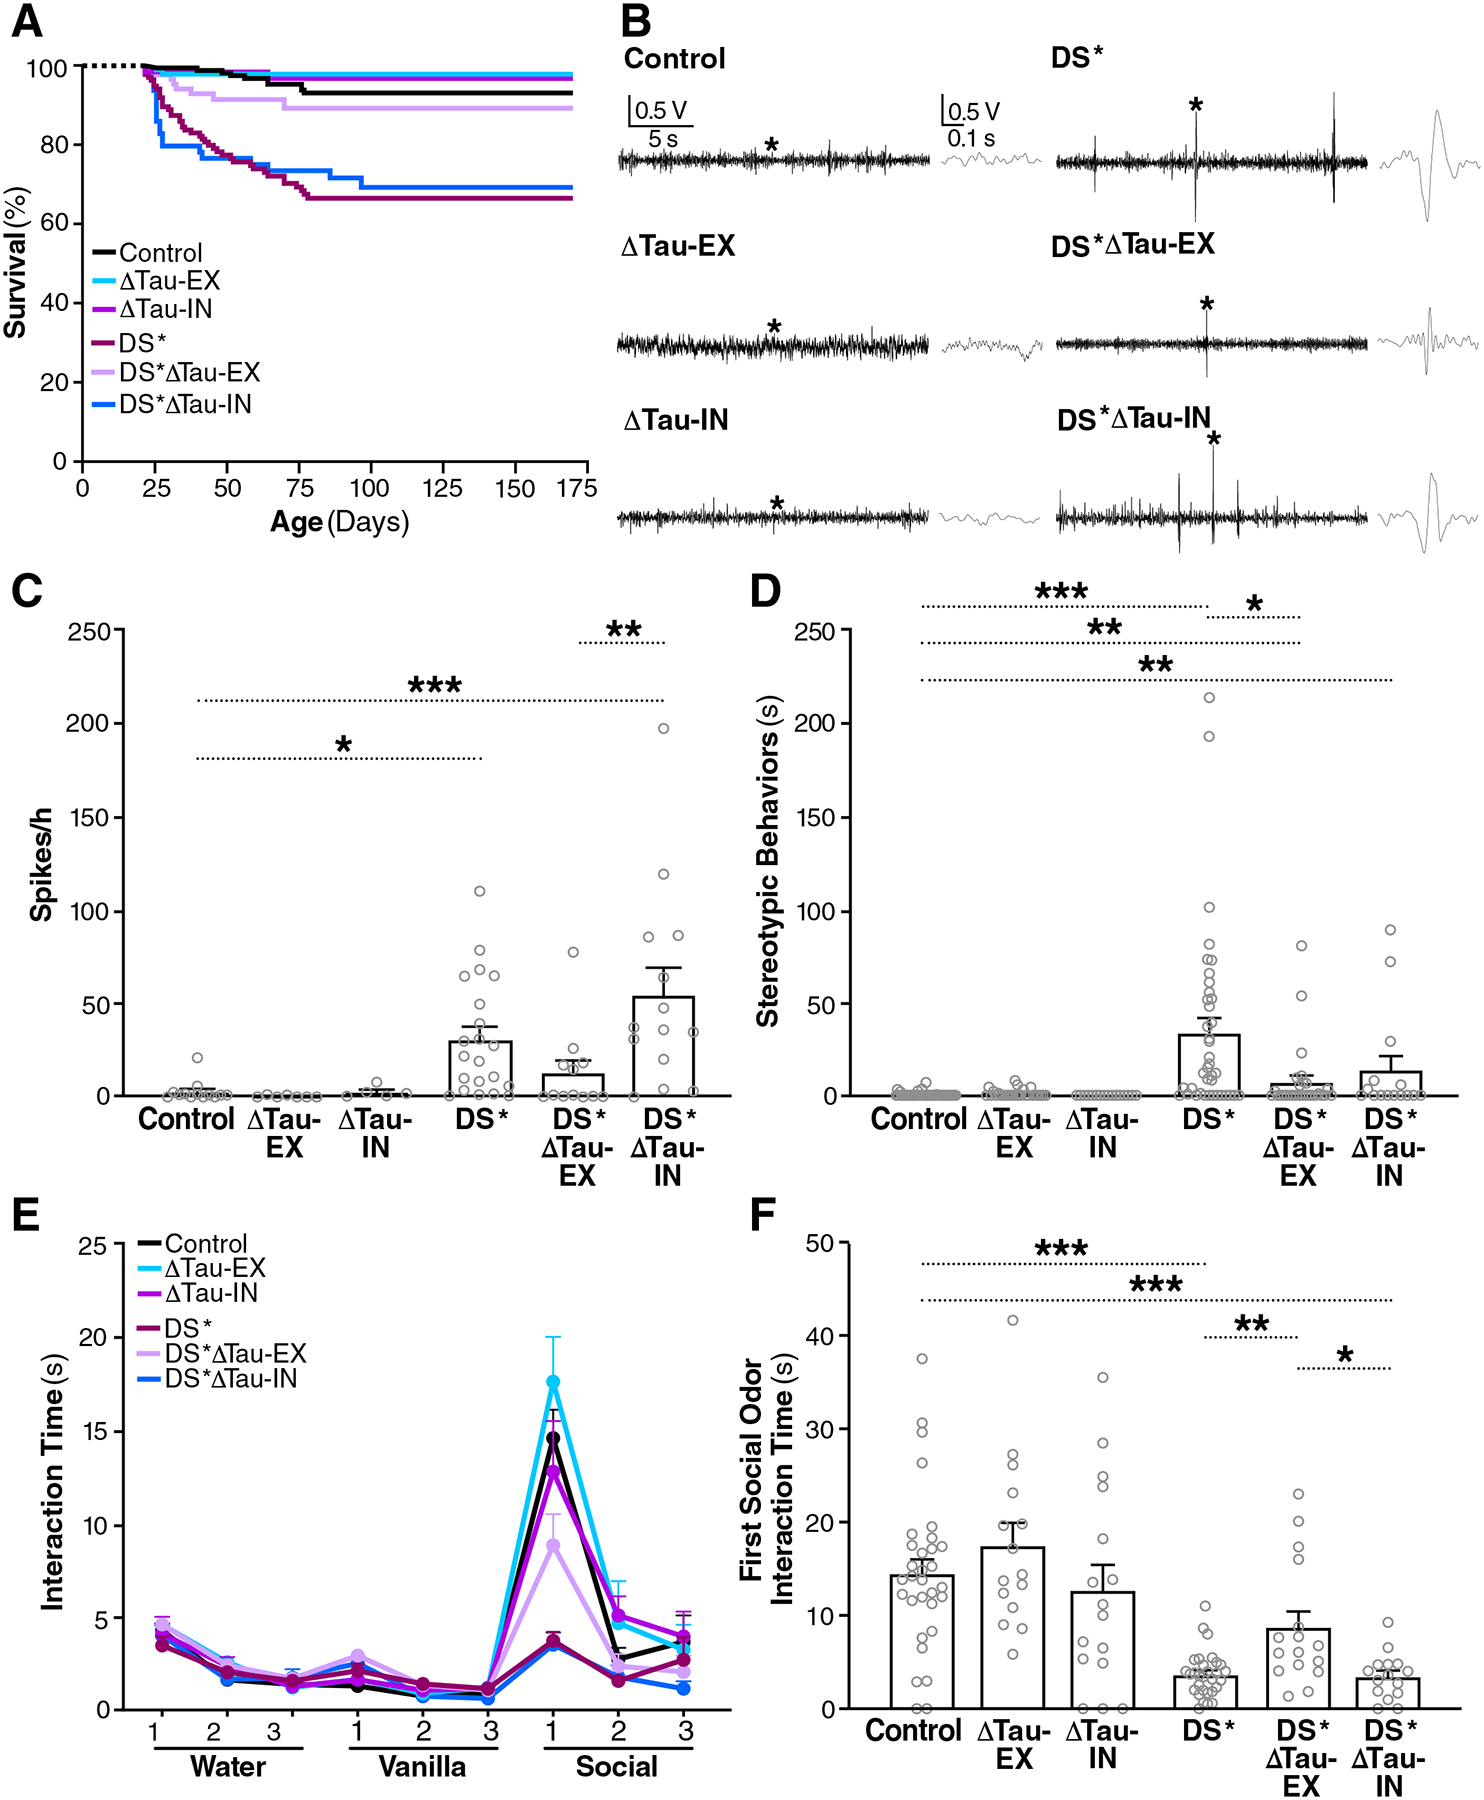
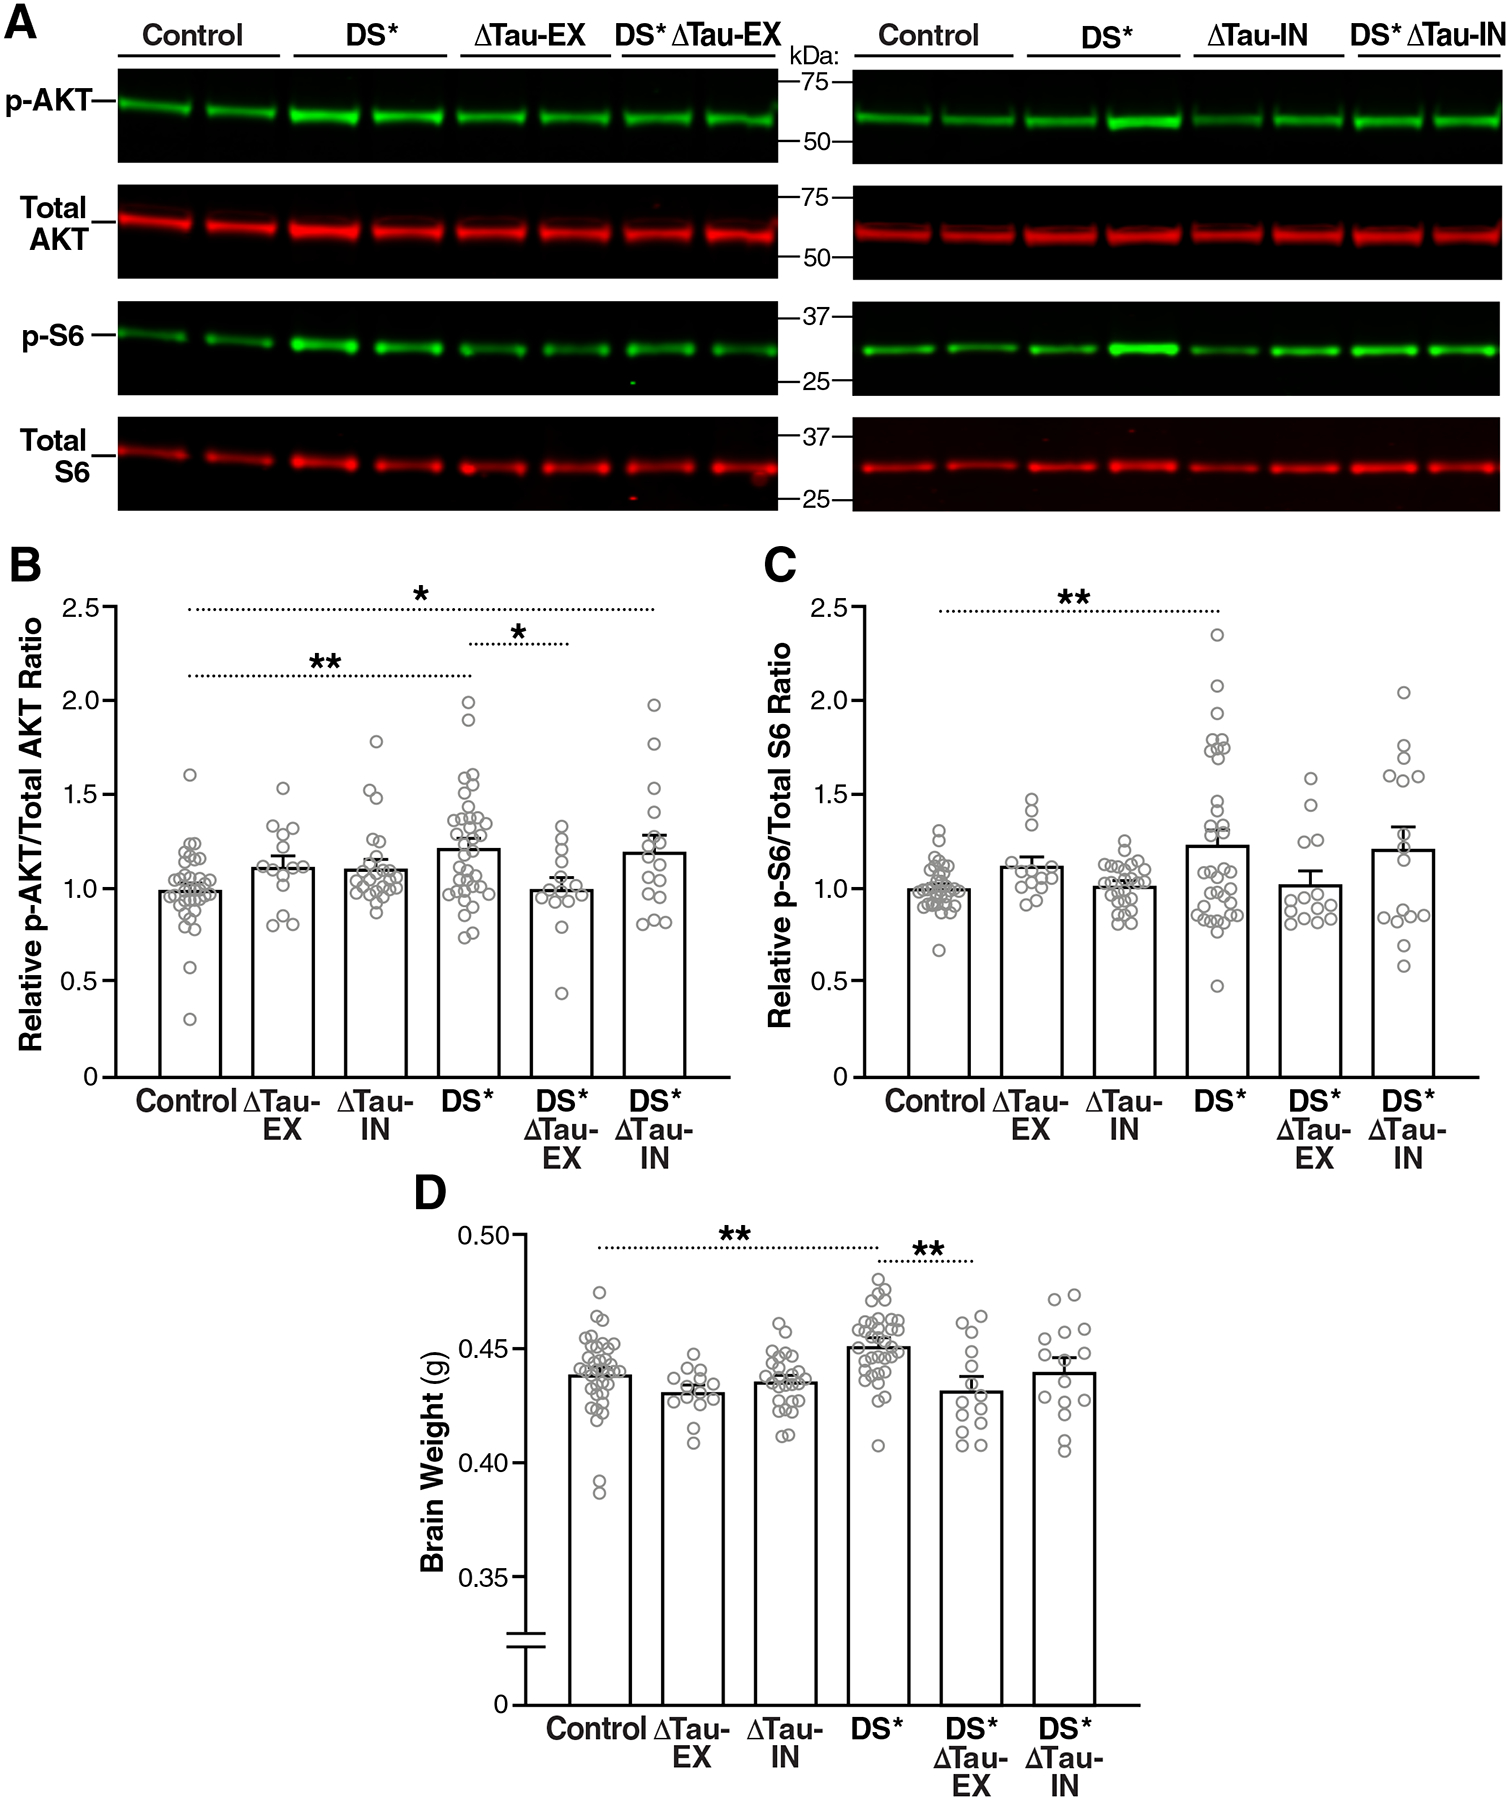
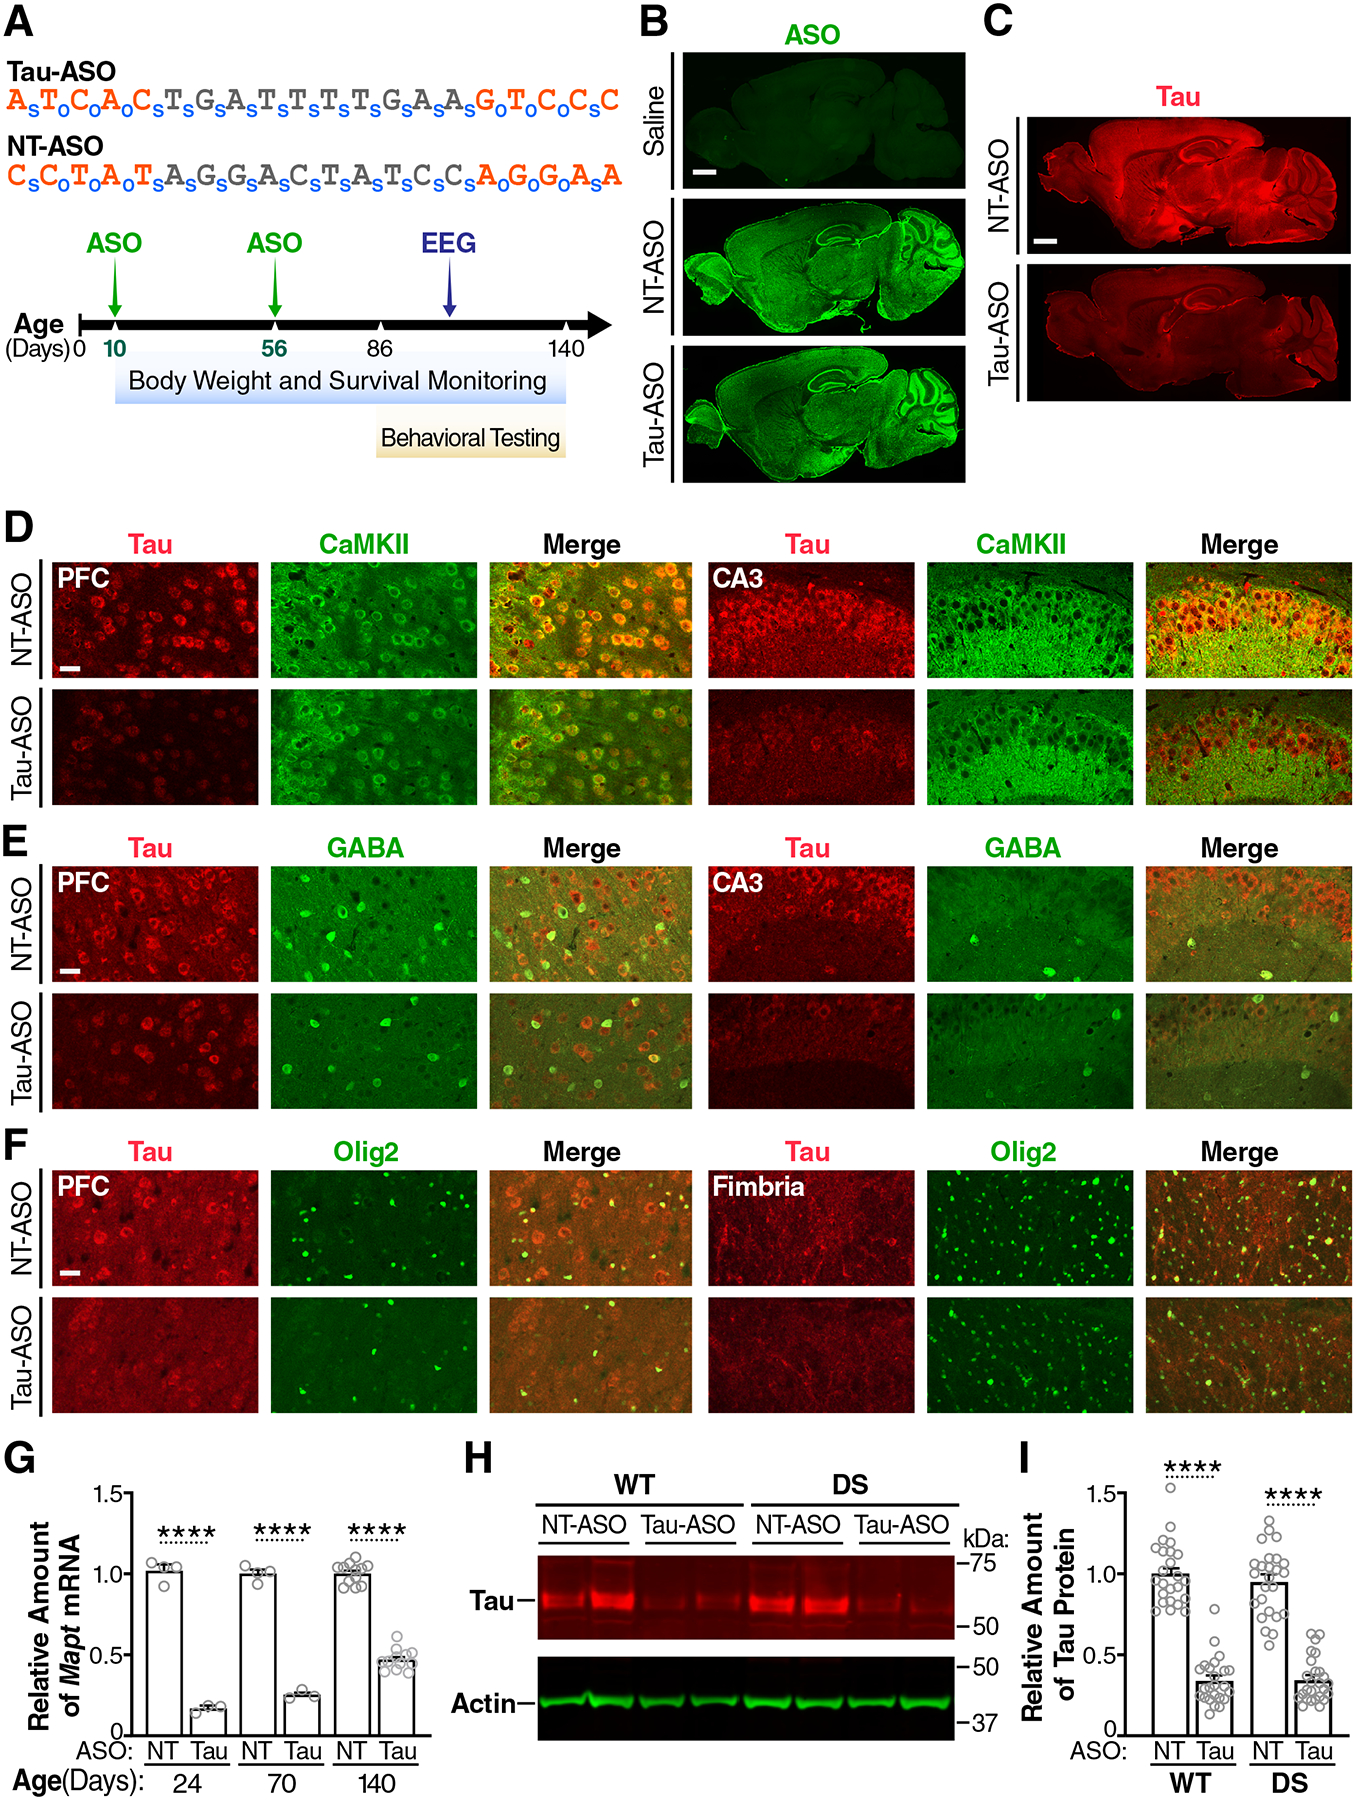
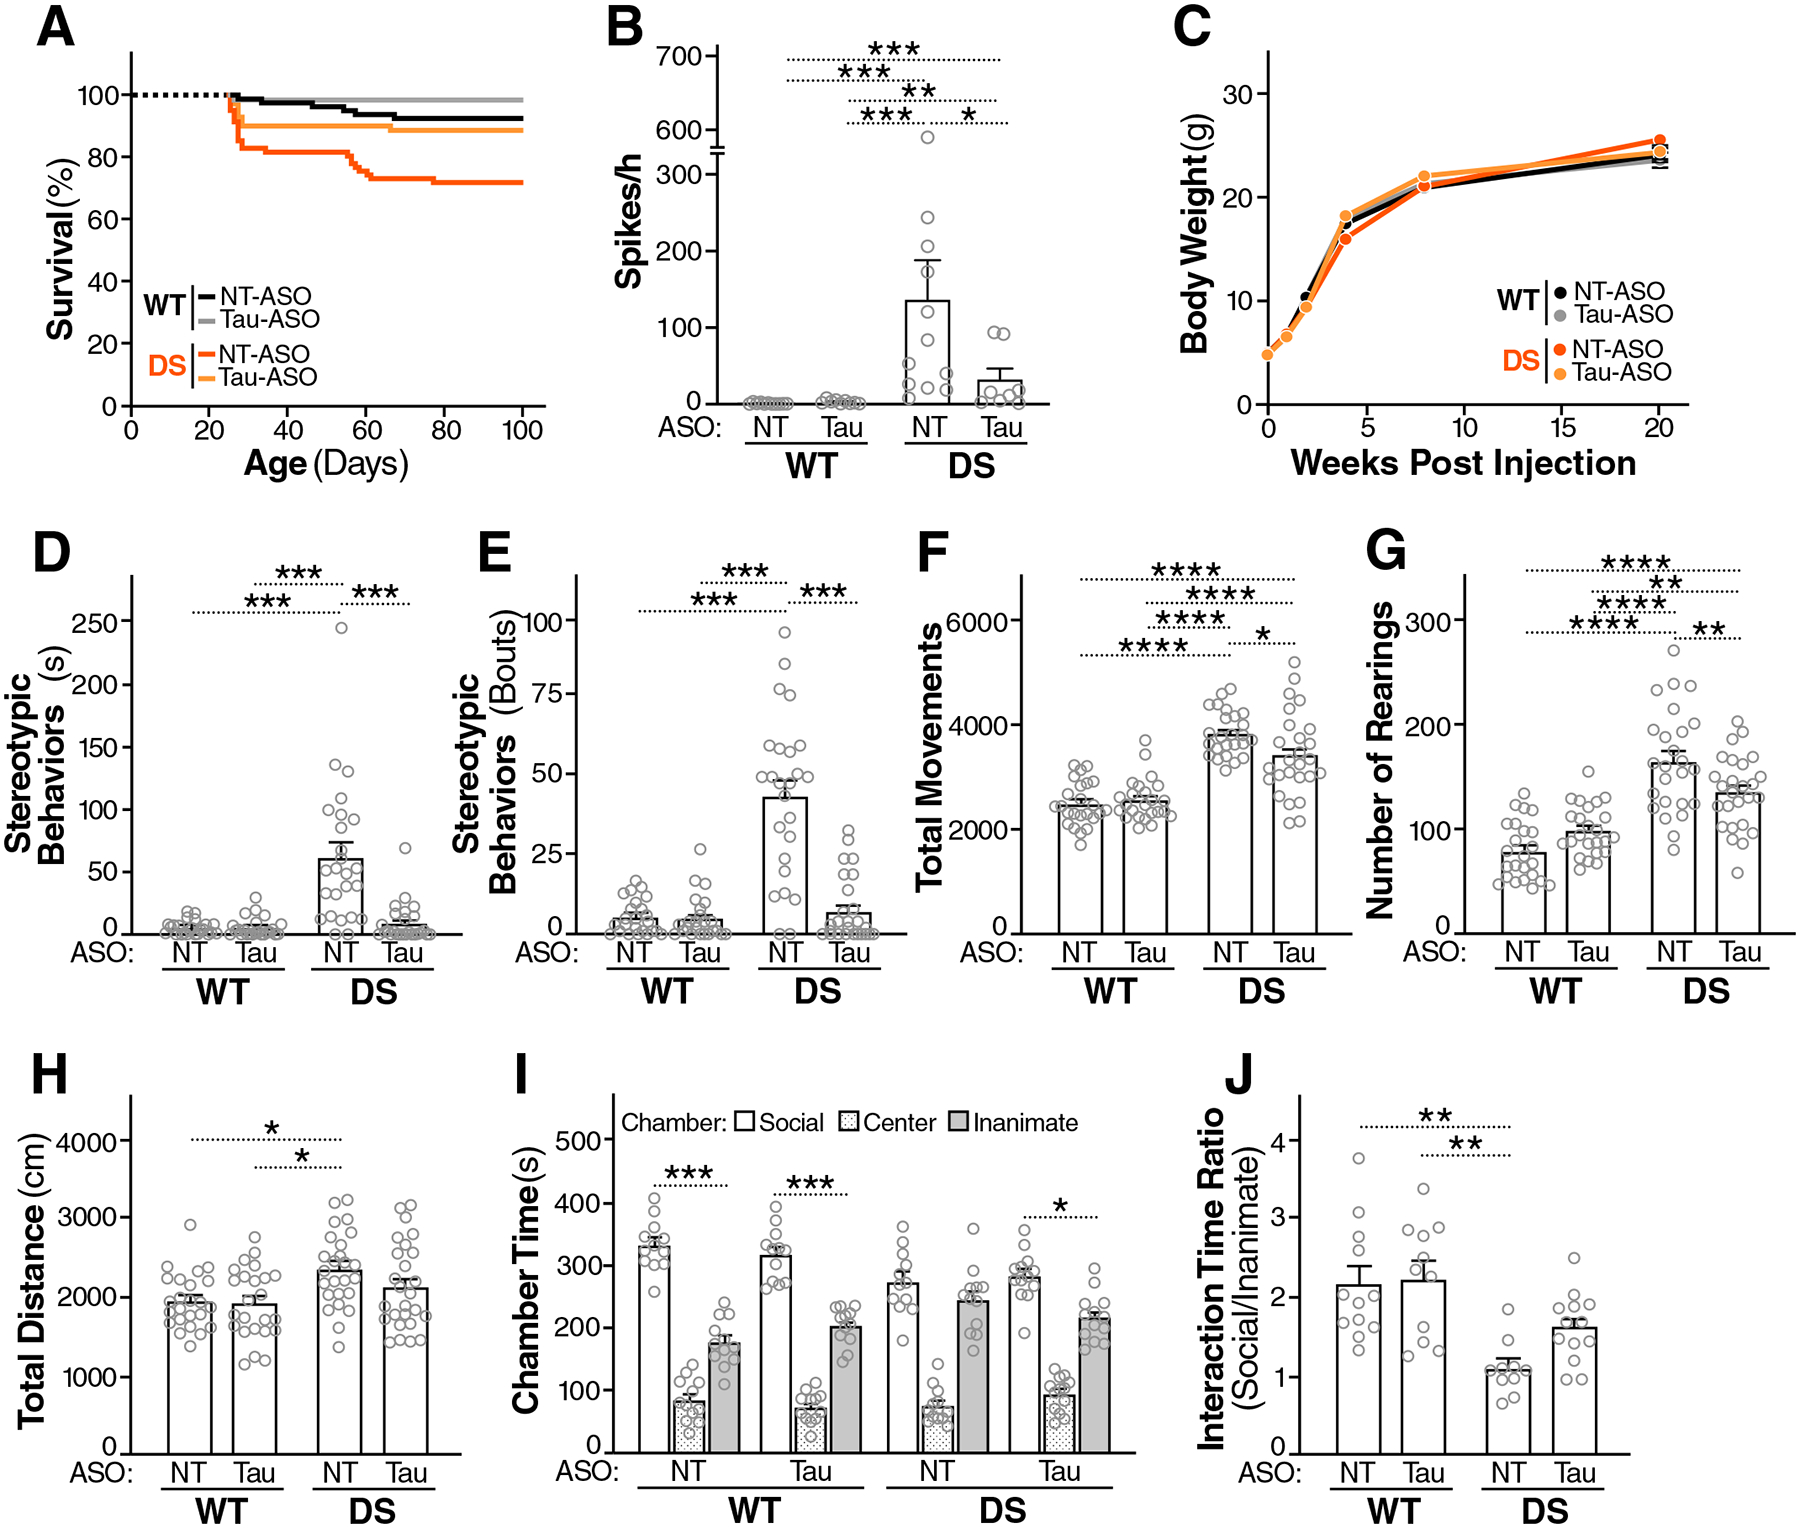
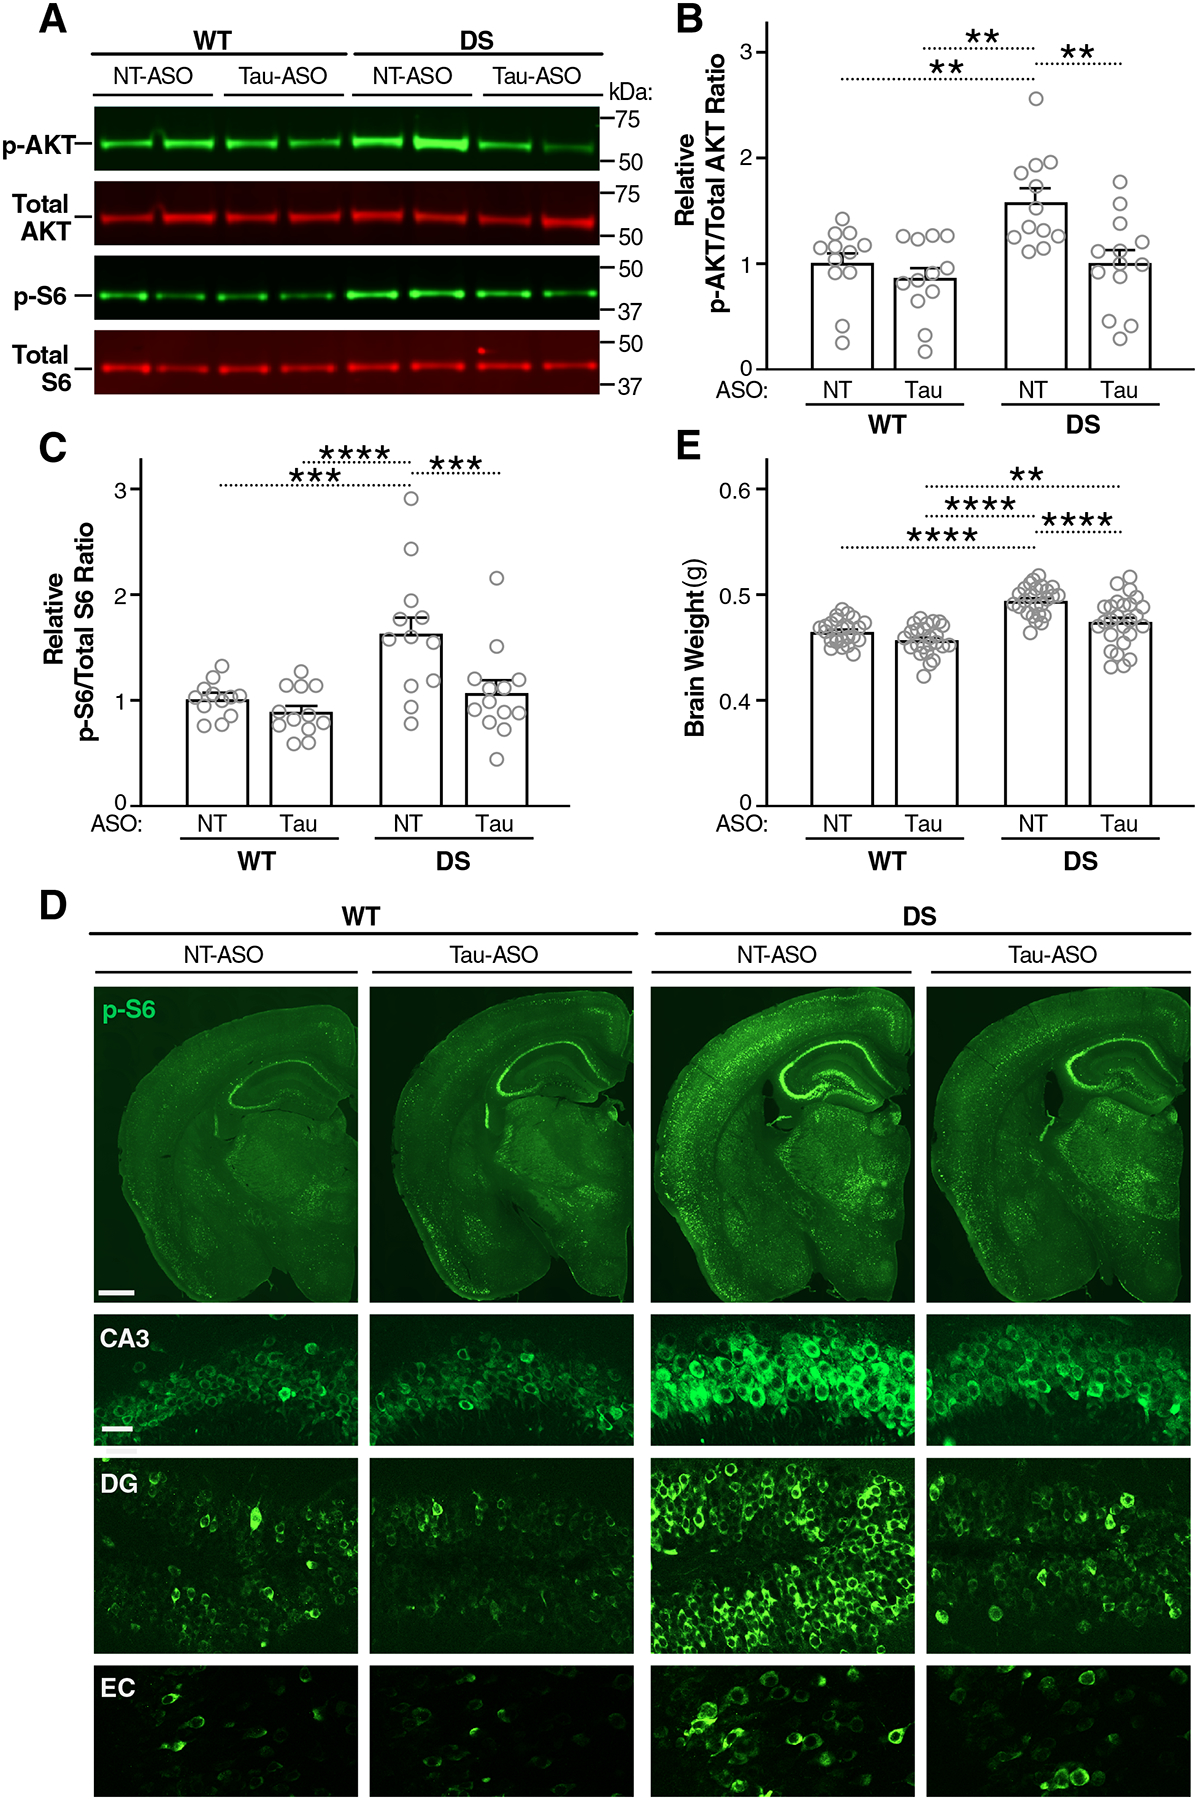
Intracellular accumulation of TAU aggregates is a hallmark of several neurodegenerative diseases. However, global genetic reduction of TAU is beneficial also in models of other brain disorders that lack such TAU pathology, suggesting a pathogenic role of nonaggregated TAU. Here, conditional ablation of TAU in excitatory, but not inhibitory, neurons reduced epilepsy, sudden unexpected death in epilepsy, overactivation of the phosphoinositide 3-kinase-AKT-mammalian target of rapamycin pathway, brain overgrowth (megalencephaly), and autism-like behaviors in a mouse model of Dravet syndrome, a severe epileptic encephalopathy of early childhood. Furthermore, treatment with a TAU-lowering antisense oligonucleotide, initiated on postnatal day 10, had similar therapeutic effects in this mouse model. Our findings suggest that excitatory neurons are the critical cell type in which TAU has to be reduced to counteract brain dysfunctions associated with Dravet syndrome and that overall cerebral TAU reduction could have similar benefits, even when initiated postnatally.


Figures

Fig. 1.
Fig. 1.. Selective tau ablation in excitatory neurons reduces PTZ-induced epileptic activity in conditional knockout mice.
(A) Coronal brain sections from Maptflox/flox (Control), Emx1IRES-cre/+/Maptflox/flox (ΔTau-EX), and VgatIRES-cre/+/Maptflox/flox (ΔTau-IN) mice coimmunostained for tau (red) and markers (green) of excitatory (CaMKII) or inhibitory (GABA) neurons. The leftmost column shows hemibrains (scale bar, 900 μm) and the images on the right show details of the hippocampal CA3 and CA2 subfields (scale bars, 60 μm). CA3 illustrates tau ablation in excitatory neurons (middle row). Because CA2 contains fewer pyramidal cells, it is more suitable for illustrating tau ablation in inhibitory neurons (bottom row). Genotypes are indicated on the very left. (B to D) Video-EEG recordings were used to assess epileptiform spike activity (B and C) and behavioral seizure activity (D) in 3.5-month-old male Control, Mapt–/– (ΔTau), ΔTau-EX, and ΔTau-IN mice after intraperitoneal injection of PTZ (50 mg/kg). (B) Representative EEG traces recorded ~5 min after PTZ injection. Sections of traces marked with an asterisk are shown on the right at higher time resolution. (C) Epileptiform spikes per minute averaged from a 20-min EEG recording after the PTZ injection, or from shorter periods for mice that died during the recording. n = 11–21 mice per group. (D) Highest seizure score reached within 20 min after the PTZ injection. n = 13–22 mice per group. **P < 0.01 and ****P < 0.0001 by one-way ANOVA and Holm-Sidak test. Gray circles represent data from individual mice. Values in (C) and (D) are means ± SEM.
Fig. 2.
Fig. 2.. Selective tau ablation in excitatory neurons reduces premature mortality, epileptiform activity, and autism-like behaviors in DS mice.
(A) Survival curves of Control, ΔTau-EX, ΔTau-IN, Scn1aRX/+/Maptflox/flox (DS*), Scn1aRX/+/Emx1IRES-cre/+/Maptflox/flox (DS*ΔTau-EX) and Scn1aRX/+/VgatIRES-cre/+/Maptflox/flox (DS*ΔTau-IN) mice. n = 61–168 mice per group at P20, when monitoring began. (B) Representative EEG traces recorded from 2.5-month-old mice of the indicated genotypes. Sections of traces marked with an asterisk are shown on the right at higher time resolution. (C) Frequency of epileptiform spikes quantified at 2.5 months of age. n = 5–21 mice per group. (D) Time mice were engaged in stereotypic (digging-like) behaviors at 6 months of age. n = 15–43 mice per group. (E and F) Olfactory habituation/dishabituation in 8-month-old mice. n = 15–31 mice. (E) Three different olfactory stimuli were presented for 6 min each in the indicated order and the amount of time mice interacted with each stimulus was recorded in three 2-min bins. Mouse bedding was used as the social odor. (F) Stimulus interaction time during the first 2 min of social odor presentation. *P < 0.05, **P < 0.01, and ***P < 0.001 by one-way ANOVA and Holm-Sidak test (C) or permutation test with Holm-Sidak correction (D and F). Gray circles represent data from individual mice. Values in (C) to (F) are means ± SEM.
Fig. 3.
Fig. 3.. Selective tau ablation in excitatory neurons prevents overactivation of the PI3K-AKT-mTOR pathway and megalencephaly in DS mice.
(A) Representative Western blot showing amounts of p-AKT, total AKT, p-S6 (Ser 240/244), and total S6 in the hippocampus of 2-month-old mice. MW markers are indicated in the middle. (B and C) p-AKT/total AKT (B) and p-S6/total S6 (C) ratios in the hippocampus of 2-month-old mice determined by Western blot analysis. Mean ratios in Control mice were defined as 1.0. (D) Brain weights of mice at 2 months of age. n = 14–36 mice per group. *P < 0.05 and **P < 0.01 by one-way ANOVA and Holm-Sidak test. Gray circles represent data from individual mice. Bars are means ± SEM.
Fig. 4.
Fig. 4.. Widespread distribution of ASOs and tau knockdown in mouse brains.
(A) Nucleotide sequences of the Tau-ASO and NT-ASO (top) and experimental design (bottom). Nucleotides containing 2′-O-methoxyethyl modifications are shown in orange. o, phosphodiester bond; s, phosphorothioate bond. WT and Scn1aRX/+ (DS) mice were injected ICV with the Tau-ASO or NT-ASO at P10 (200 μg) and P56 (300 μg). Replicate groups of mice were analyzed at P24, P70, or P140 for hippocampal tau expression and for other outcome measures as indicated. (B and C) Sagittal brain sections from 140-day-old WT mice showing representative distributions of ASO (B) and tau (C) immunostaining after the indicated ICV injections. Scale bars, 600 μm. (D to F) Sagittal brain sections from NT-ASO or Tau-ASO–treated 140-day-old WT mice coimmunolabeled for tau (red) and markers (green) of excitatory neurons (CaMKII) (D), inhibitory neurons (GABA) (E), or oligodendrocytes (Olig2) (F). PFC, prefrontal cortex; CA3, hippocampal subregion. Scale bars, 30 μm. (G) Hippocampal amounts of Mapt mRNA in replicate groups of WT mice treated as indicated and analyzed by RT-qPCR at P24 (n = 3–4 mice per group), P70 (n = 3–4 mice per group), or P140 (n = 12–13 mice per group). Mapt/Gapdh mRNA ratios in age-matched NT-ASO–treated mice were defined as 1.0. (H) Representative Western blot showing hippocampal amounts of tau and β-actin (loading control) in the indicated groups of mice at P140. Each lane contains a sample from a different mouse. (I) Hippocampal amounts of tau protein in the indicated mice (n = 24–26 per group) were quantified by Western blotting at P140. Mean tau/β-actin ratios in NT-ASO–treated WT mice were defined as 1.0. Gray circles represent data from individual mice. ****P < 0.0001 by two-way ANOVA and Holm-Sidak test. Values in (G) and (I) are means ± SEM.
Fig. 5.
Fig. 5.. Postnatal Tau-ASO treatment reduces SUDEP, epileptiform spike frequency, and autism-like behaviors in DS mice.
(A) Survival curves of WT and DS mice treated with NT-ASO or Tau-ASO as in Fig. 4. n = 68–82 mice per group at P25, when monitoring began. (B) Frequency of epileptiform spikes in WT and DS mice recorded between P90 and P110 (Fig. 4A). (C) Maturation related increases in body weights across groups. (D to J) Behavioral effects of ASO treatments were assessed in WT and DS mice between P86 and P140 (Fig. 4A). The following autism-related behaviors were assessed: time engaged in stereotypic (digging-like) behaviors (D) and number of bouts of such behaviors (E), total movements (F) and number of rearings (G) in the open field, distance traveled in the elevated plus maze (H), and social preference in the three-chamber test as evidenced by time spent in the social or inanimate chamber (I) and ratio of times mice spent interacting with social or inanimate cups within these chambers (J). n = 8–12 male and female mice (B), 24–26 male and female mice (C to H), 12–13 female mice (I), or 10–13 female mice (J) per group. *P < 0.05, **P < 0.01, ***P < 0.001, and ****P < 0.0001 by Mann-Whitney U test with Holm-Sidak correction (B), permutation test with Holm-Sidak correction (D and E), two-way ANOVA and Holm-Sidak test (F to H and J), or Student’s t test with Holm-Sidak correction (I). Gray circles represent data from individual mice. Values in (B) to (J) are means ± SEM.
Fig. 6.
Fig. 6.. Tau-ASO treatment reduces the overactivation of the PI3K-AKT-mTOR pathway and megalencephaly in DS mice.
(A to E) After treatment with ASOs as in Fig. 4, WT and DS mice were assessed at P140 for hippocampal activation of the PI3K-AKT-mTOR pathway and brain weight. (A) Representative Western blot showing hippocampal amounts of p-AKT, total AKT, p-S6 (Ser 240/244), and total S6. MW markers are indicated on the right. (B and C) p-AKT/total AKT (B) and p-S6/total S6 (C) ratios in the hippocampus determined by Western blot analysis. Mean ratios in NT-ASO–treated WT mice were defined as 1.0. n = 12–13 animals. (D) Representative images of coronal brain sections immunostained for p-S6 (Ser 240/244). Hemibrains (scale bar, 600 μm) are shown in the top row and details (scale bar, 30 μm) of the hippocampal subfield CA3, the dentate gyrus (DG), and the entorhinal cortex (EC) are shown below. (E) Brain weights. n = 24–26 mice per group. **P < 0.01, ***P < 0.001, and ****P < 0.0001 by two-way ANOVA and Holm-Sidak test. Gray circles represent data from individual mice. Bars are means ± SEM.

Comment in

References

    1. Lord C, Brugha TS, Charman T, Cusack J, Dumas G, Frazier T, Jones EJH, Jones RM, Pickles A, State MW, Taylor JL, Veenstra-VanderWeele J, Autism spectrum disorder. Nat. Rev. Dis. Primers 6, 1–23 (2020). - PMC - PubMed
    1. Fombonne E, MacFarlane H, Salem AC, Epidemiological surveys of ASD: advances and remaining challenges. J. Autism Dev. Disord, Online ahead of print (2021). - PubMed
    1. Won H, Mah W, Kim E, Autism spectrum disorder causes, mechanisms, and treatments: focus on neuronal synapses. Front. Mol. Neurosci 6, 1–26 (2013). - PMC - PubMed
    1. Satterstrom FK, Kosmicki JA, Wang J, Breen MS, De Rubeis S, An JY, Peng M, Collins R, Grove J, Klei L, Stevens C, Reichert J, Mulhern MS, Artomov M, Gerges S, Sheppard B, Xu X, Bhaduri A, Norman U, Brand H, Schwartz G, Nguyen R, Guerrero EE, Dias C, C. Autism Sequencing, P.-B. C. i, Betancur C, Cook EH, Gallagher L, Gill M, Sutcliffe JS, Thurm A, Zwick ME, Borglum AD, State MW, Cicek AE, Talkowski ME, Cutler DJ, Devlin B, Sanders SJ, Roeder K, Daly MJ, Buxbaum JD, Large-scale exome sequencing study implicates both developmental and functional changes in the neurobiology of autism. Cell 180, 568–584.e23 (2020). - PMC - PubMed
    1. Manoli DS, State MW, Autism spectrum disorder genetics and the search for pathological mechanisms. Am. J. Psychiatry 178, 30–38 (2021). - PMC - PubMed

Publication types

Supplementary concepts