. 2022 May 9;57(9):1119-1131.e5.
doi: 10.1016/j.devcel.2022.04.001. Epub 2022 Apr 26.

ARVCF catenin controls force production during vertebrate convergent extension

Affiliations

ARVCF catenin controls force production during vertebrate convergent extension

Robert J Huebner et al. Dev Cell. .

Abstract

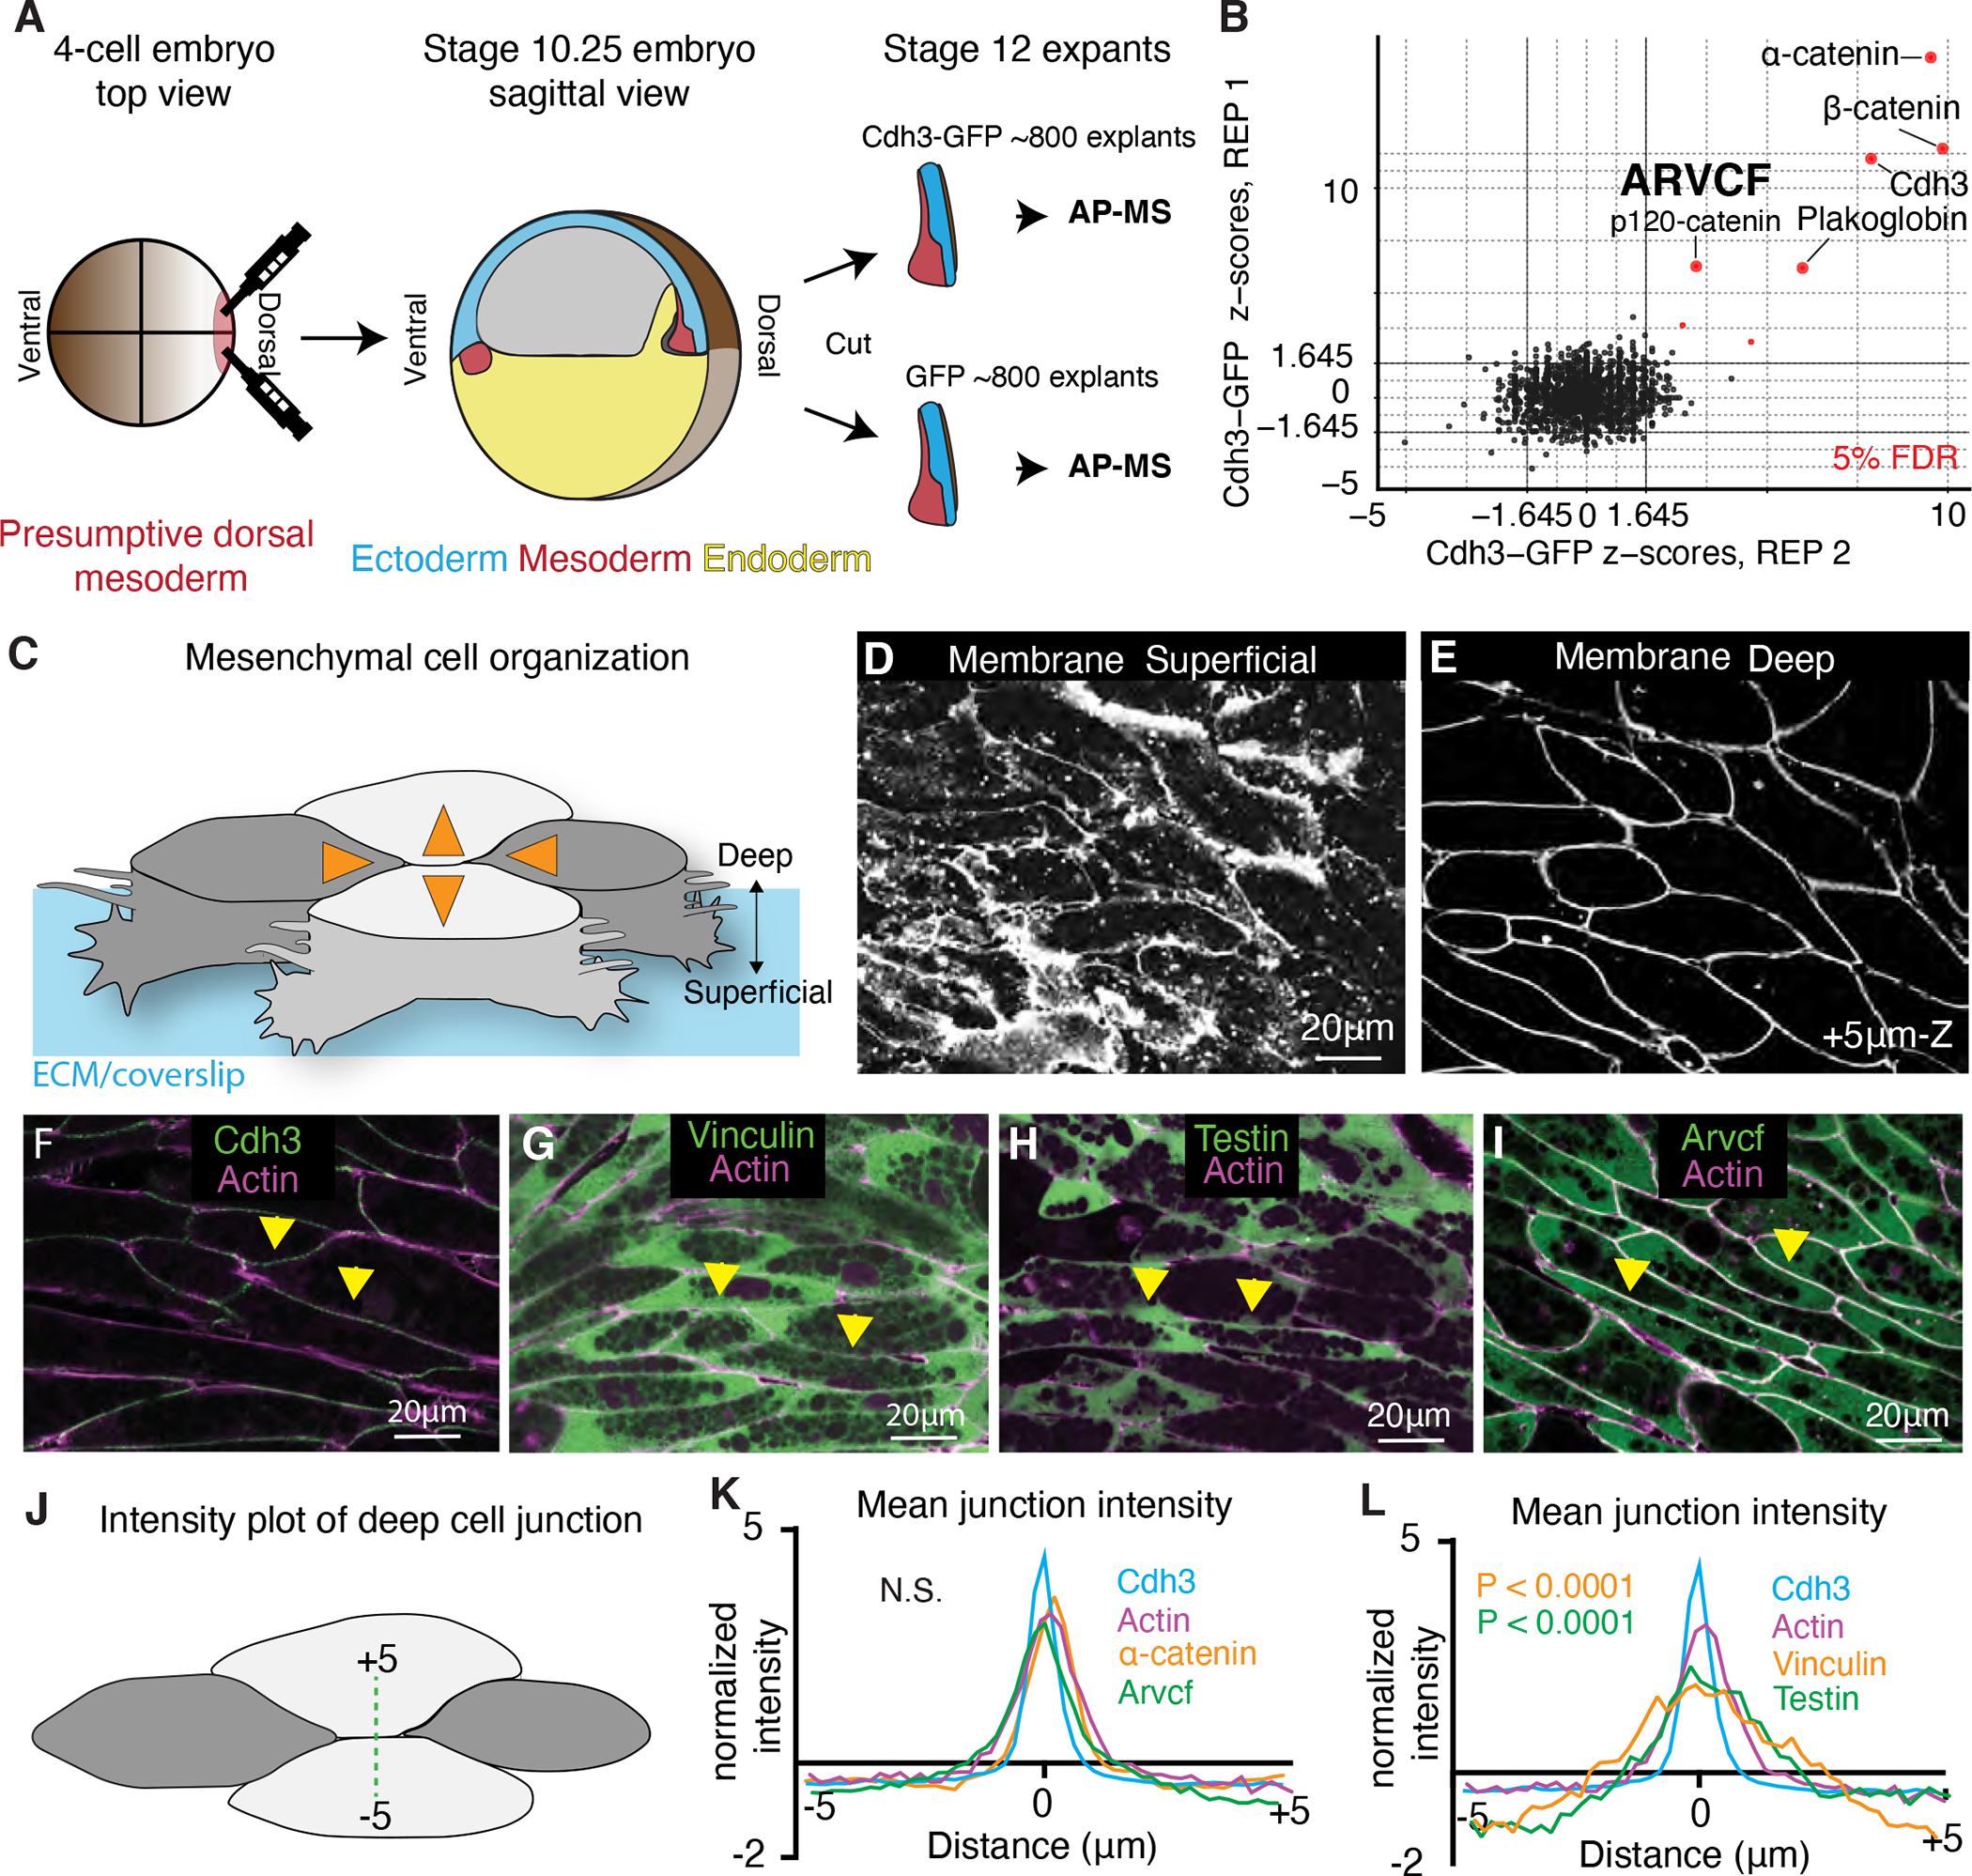
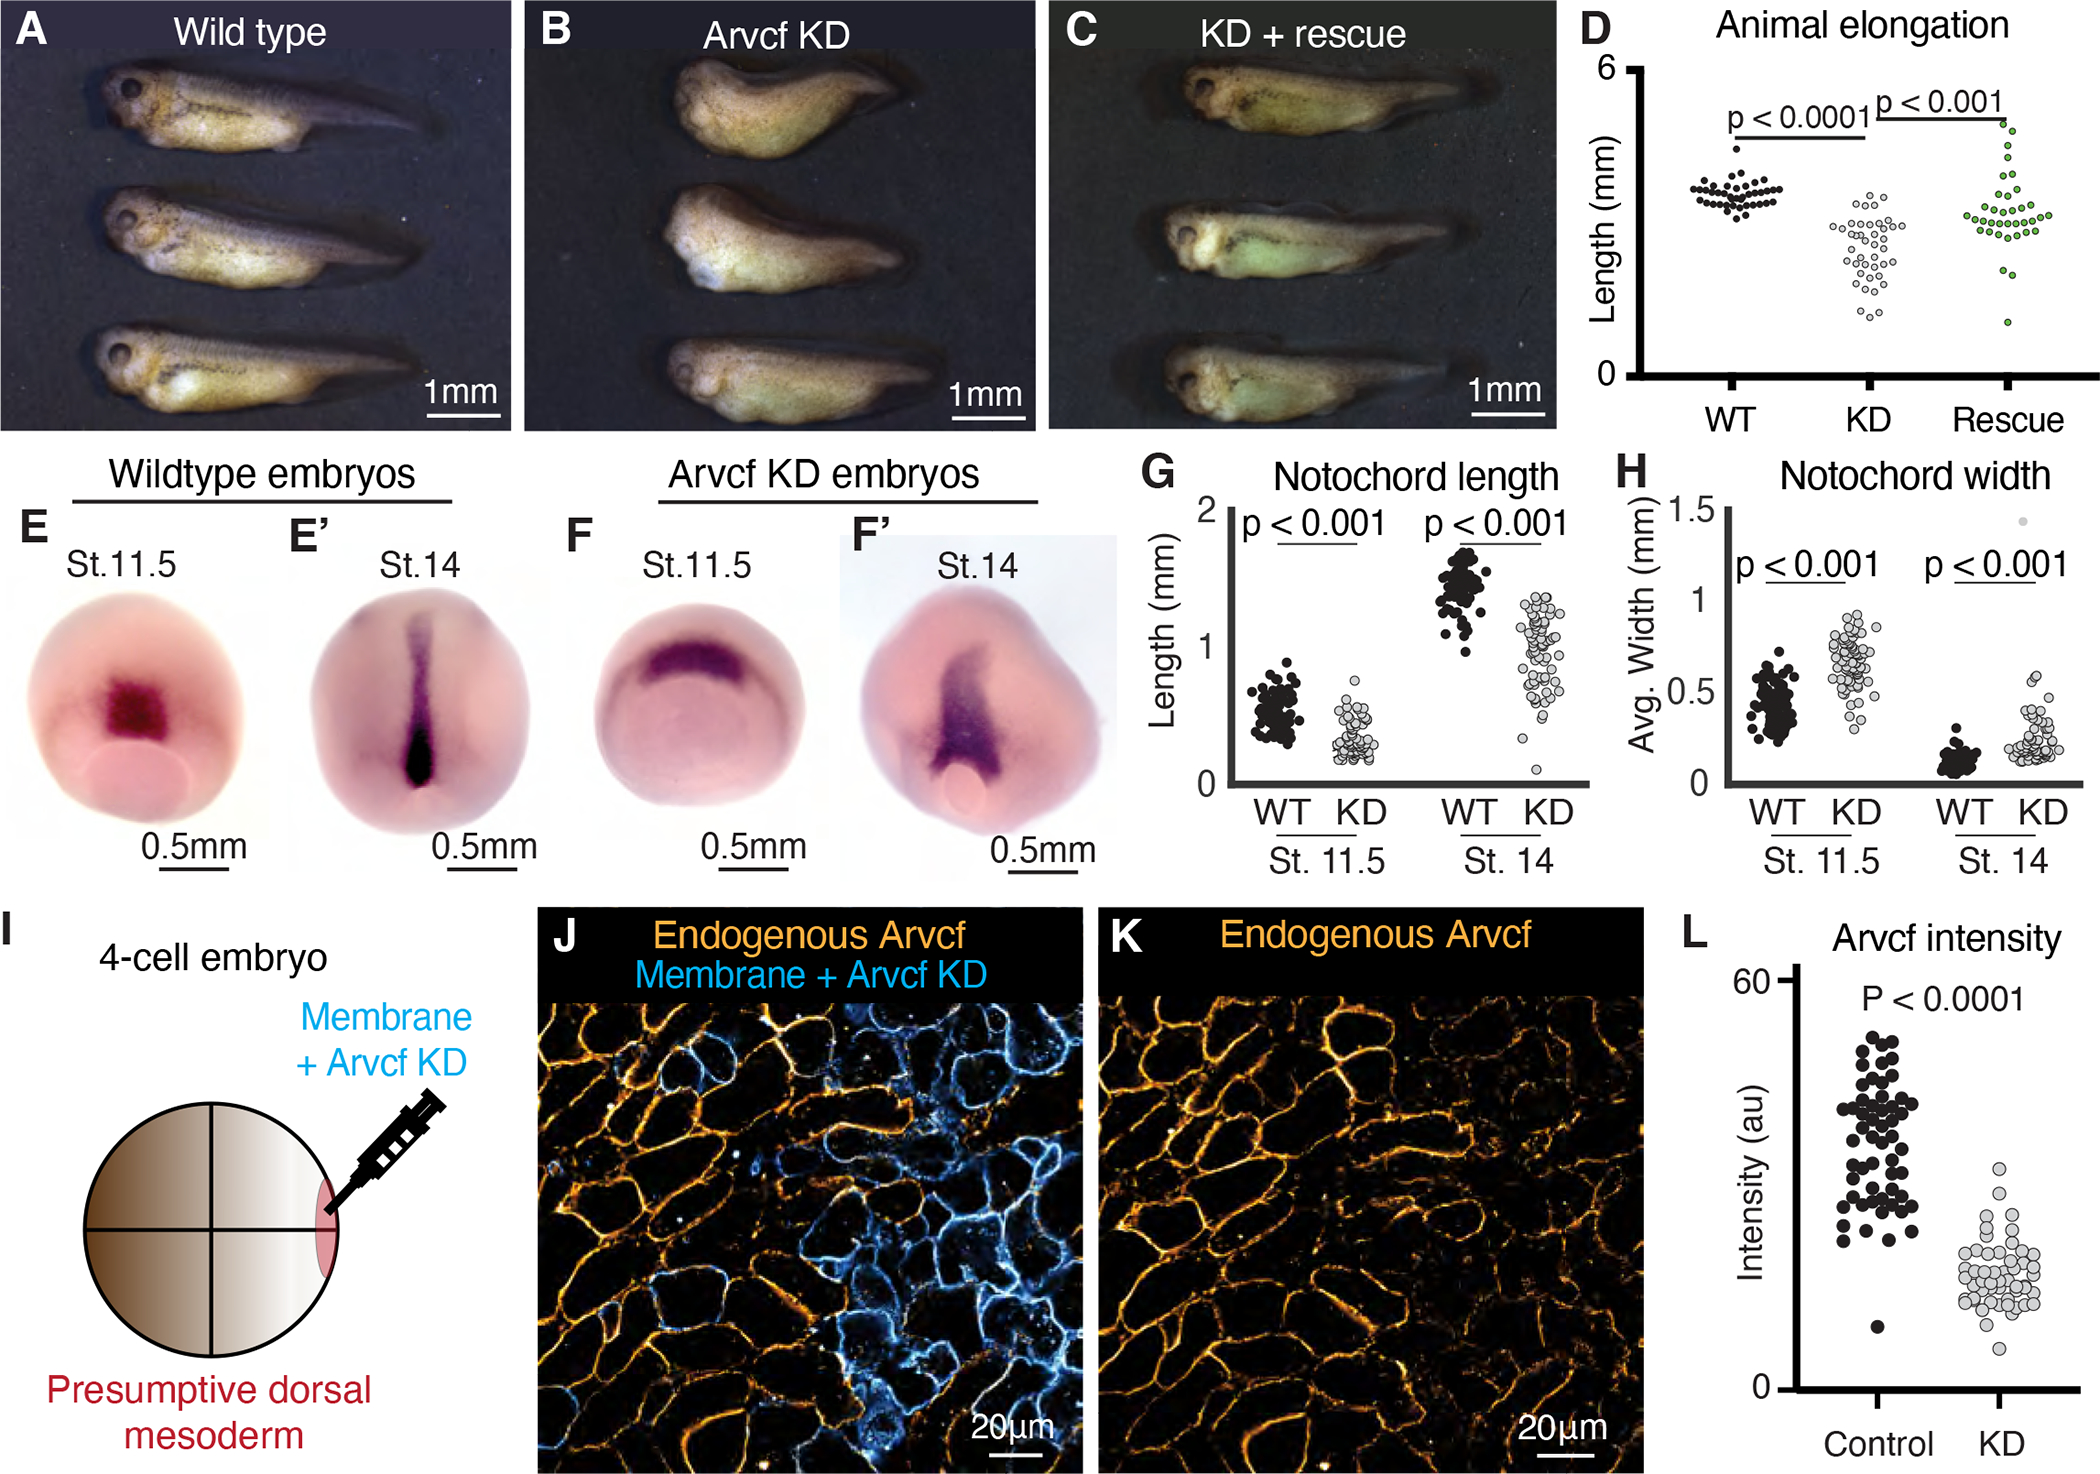
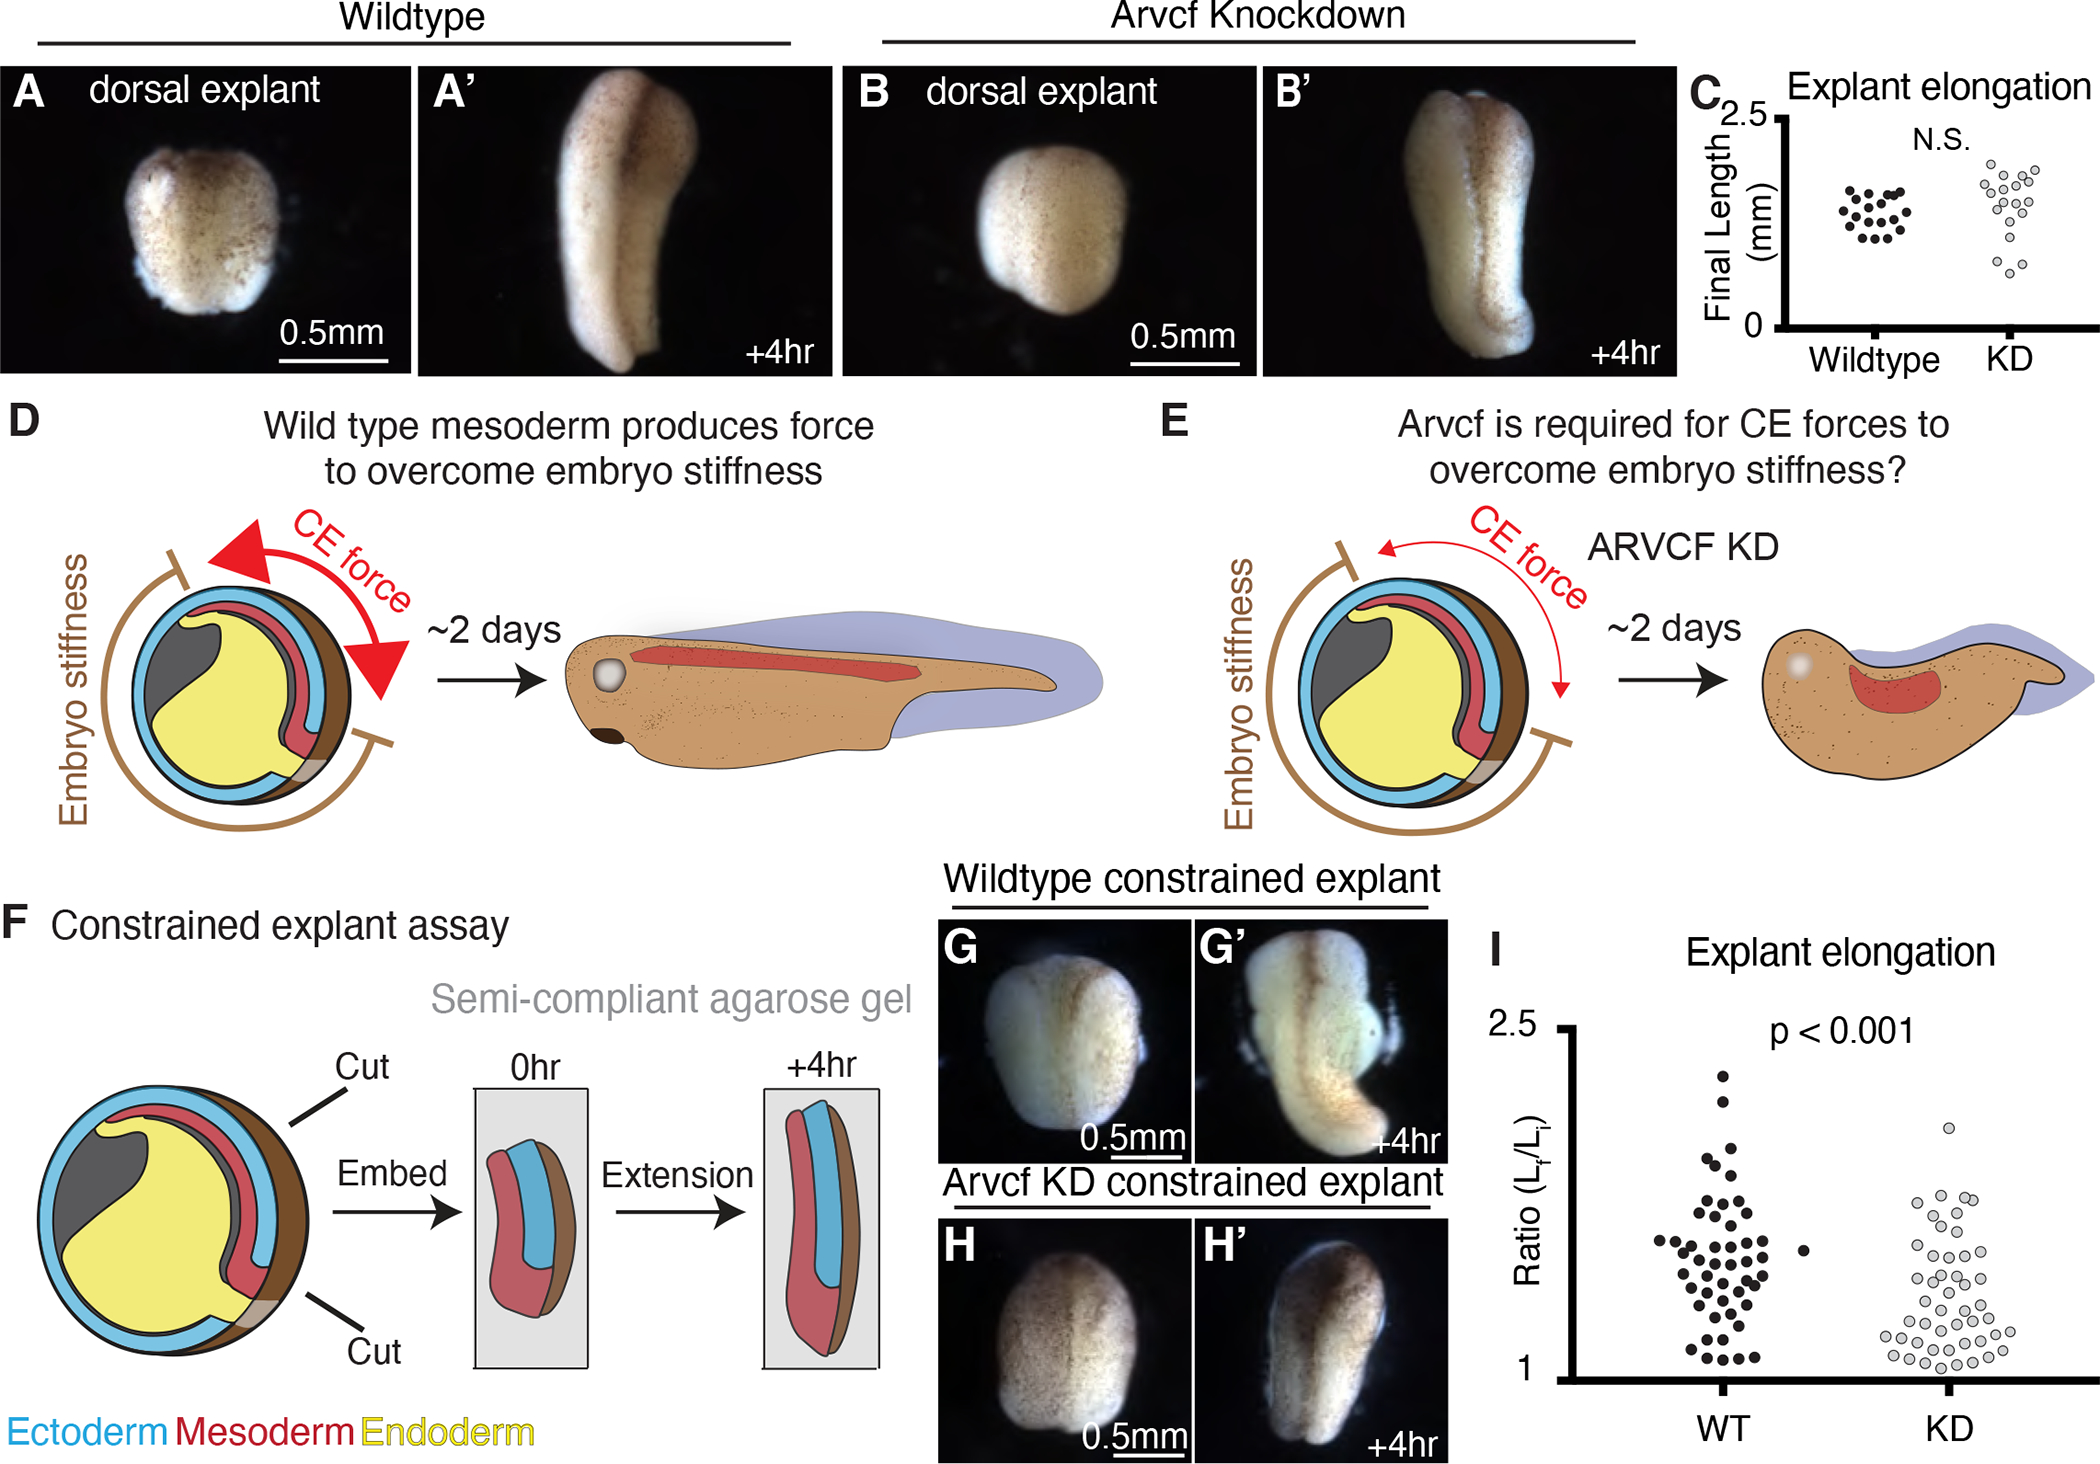
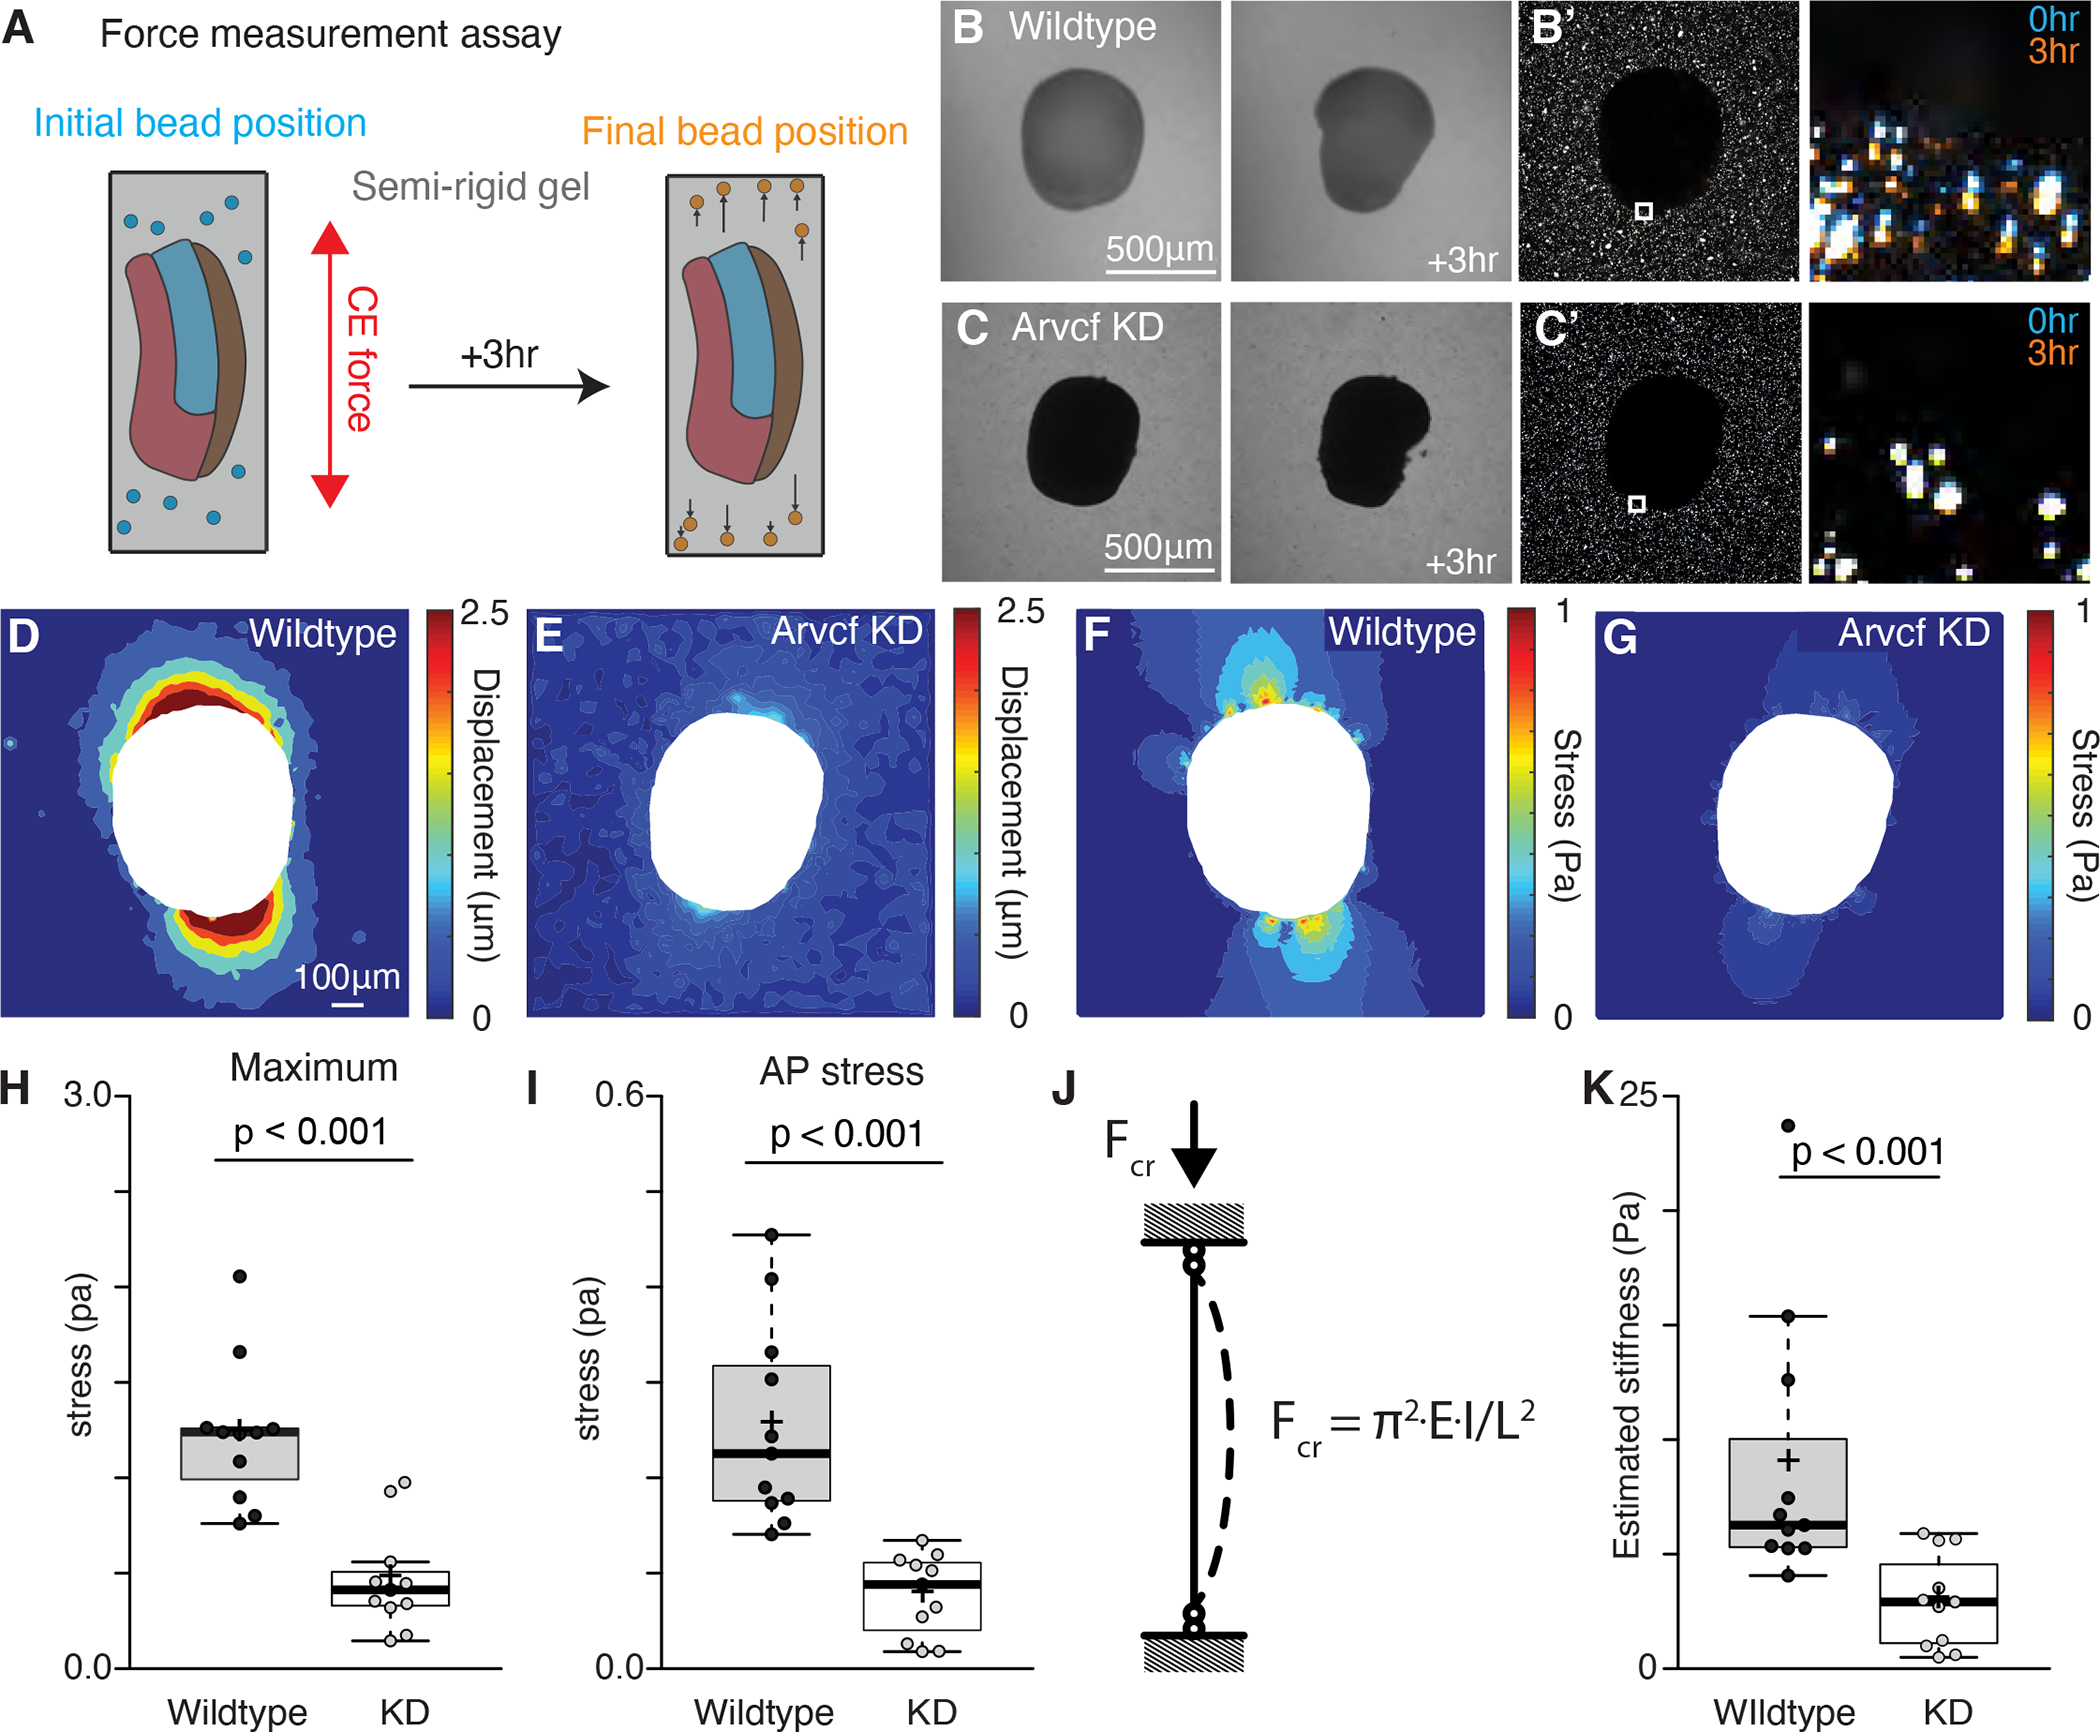
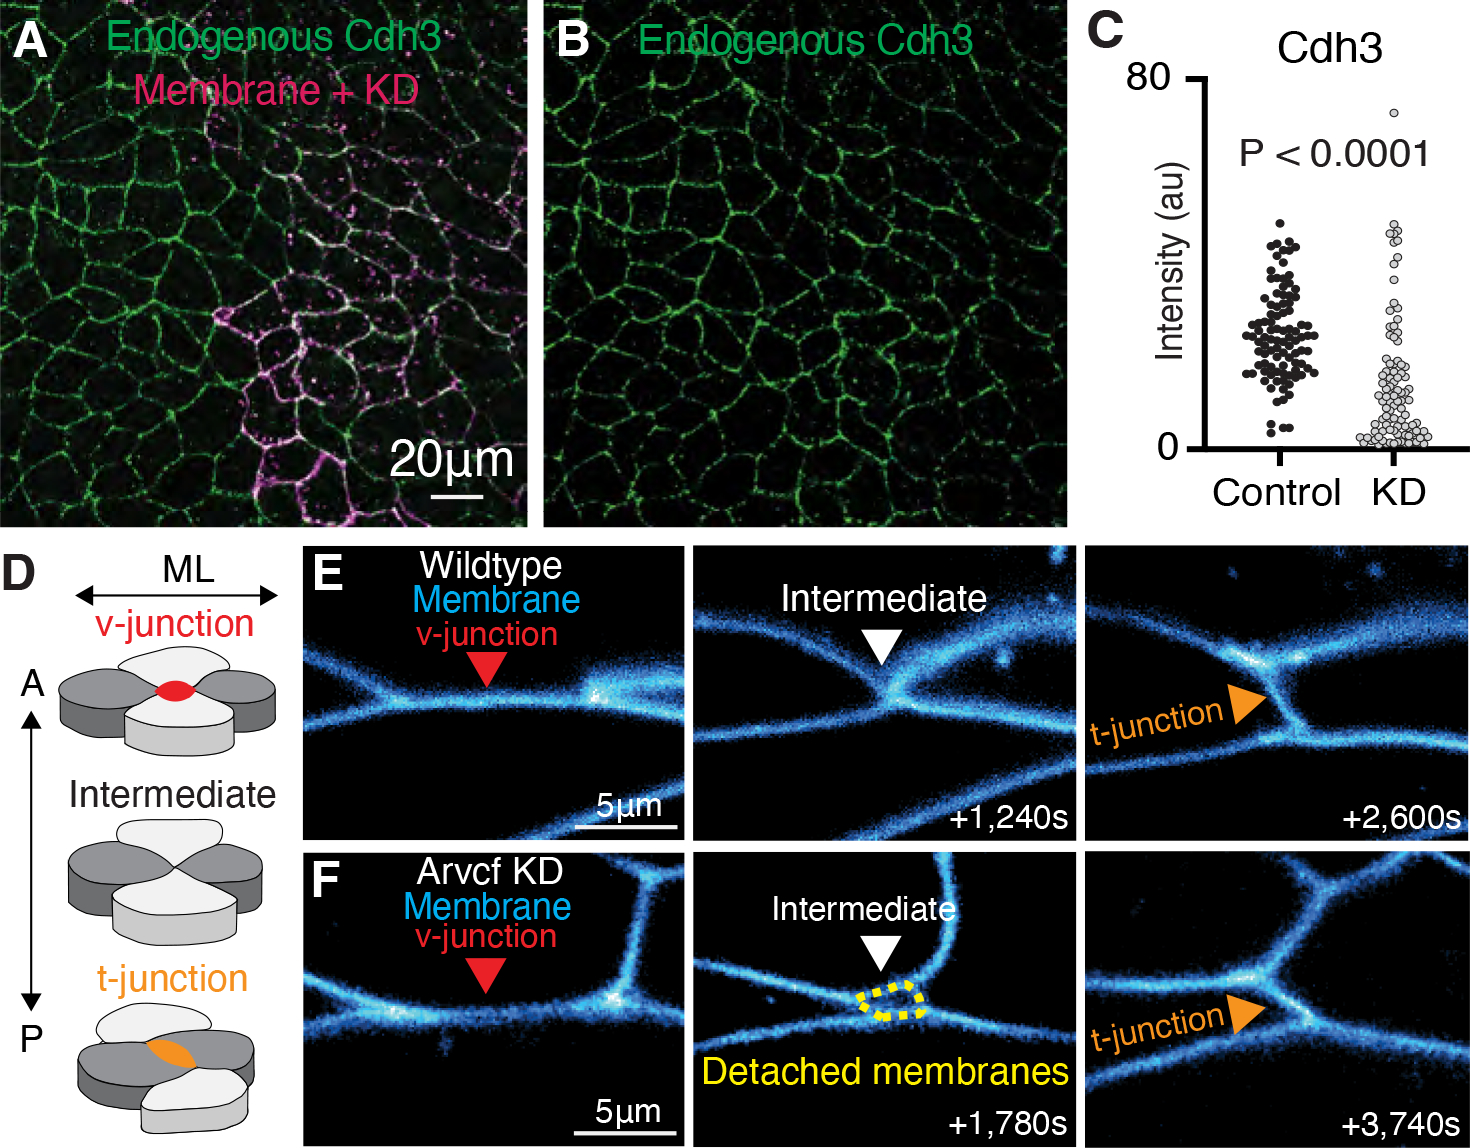
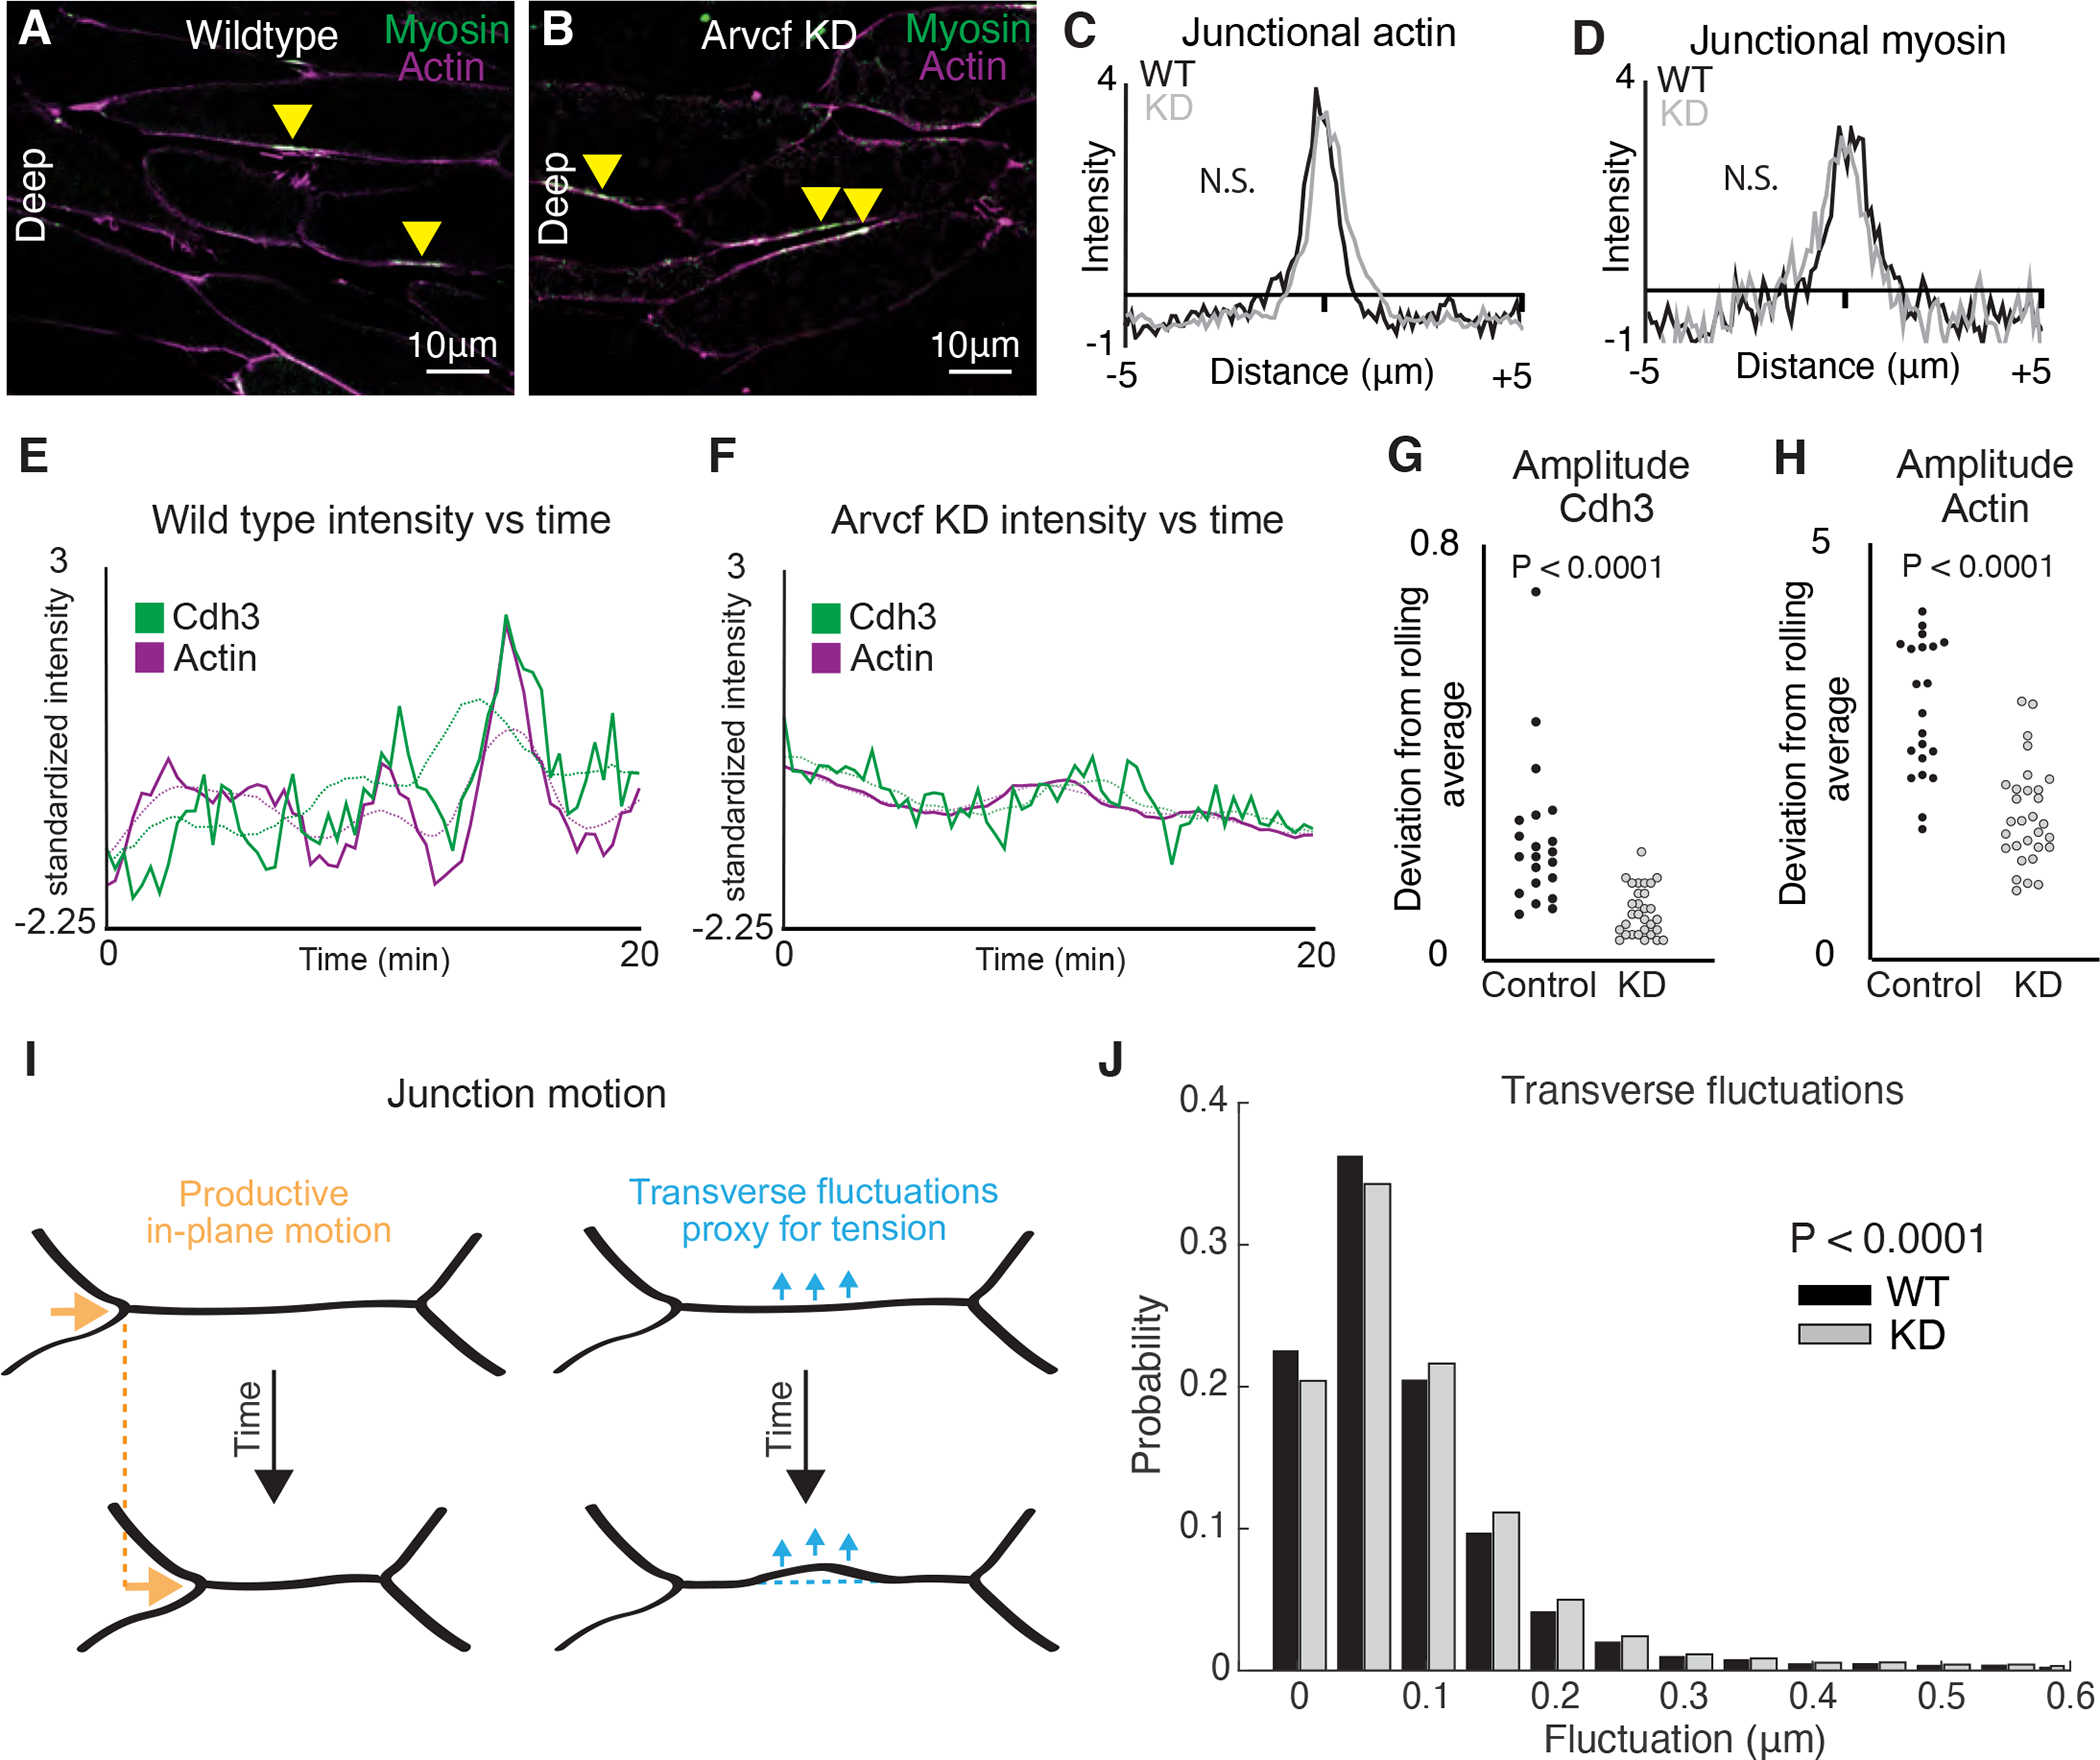
The design of an animal's body plan is encoded in the genome, and the execution of this program is a mechanical progression involving coordinated movement of proteins, cells, and whole tissues. Thus, a challenge to understanding morphogenesis is connecting events that occur across various length scales. Here, we describe how a poorly characterized adhesion effector, Arvcf catenin, controls Xenopus head-to-tail axis extension. We find that Arvcf is required for axis extension within the intact organism but not within isolated tissues. We show that the organism-scale phenotype results from a defect in tissue-scale force production. Finally, we determine that the force defect results from the dampening of the pulsatile recruitment of cell adhesion and cytoskeletal proteins to membranes. These results provide a comprehensive understanding of Arvcf function during axis extension and produce an insight into how a cellular-scale defect in adhesion results in an organism-scale failure of development.

Keywords: Arvcf; biomechanics; cadherin; catenin; cell adhesion; convergent extension; morphogenesis.


Conflict of interest statement

Declaration of interests J.B.W. is a member of the Developmental Cell advisory board.

Figures

Figure 1:
Figure 1:. Tissue and stage-specific Cdh3 affinity purification mass spectrometry results in a highly specific Cdh3 protein interaction dataset.
A. Schematic depicting the method used for tissue and stage-specific affinity purification mass spectrometry (APMS) of Cdh3. B. Graph showing the relative protein orthogroup enrichment (see methods) from two replicates of the Cdh3 AP-MS experiment. Here we plot the z-scores from replicate 1 on the y-axis and the z-scores from replicate 2 on the x-axis. Each dot represents a protein identified in the Cdh3 AP-MS dataset and red dots represent proteins that fall below a 5% FDR threshold. C. Cartoon depicting Xenopus mesenchymal cells during convergent extension. Here the mediolateral cells, dark gray, move to each other resulting in displacement of the anterior-posterior cells, light gray. Orange arrows show the cell movements. Mesenchymal cells display apparent structural differences along the superficial (cell-ECM interface) to deep (cell-cell interface) axis. Here polarized lamellar-like structures are observed at the superficial surface. Movement deeper into the cell reveals cell-cell interfaces and actin-based protrusions which extend between neighboring cells. D. Image of the superficial surface of converging and extending Xenopus mesenchymal cells. Cells are labeled with a membrane marker which primarily shows lamellar-like protrusions at the cell-ECM interface. E. Image of the deep surface of the same cells shown in Fig. 1D. Here the membrane marker largely highlights the cell-cell junctions. F. Image of Cdh3 (green) and actin (magenta) at deep cell-cell contacts. Protein localization was visualized by expressing tagged fusion proteins. Yellow arrowheads point to cell junctions. G. Image of vinculin (green) and actin (magenta) at deep cell structures. Protein localization was visualized by expressing tagged fusion proteins. Yellow arrowheads point to cell junctions. H. Image of testin (green) and actin (magenta) at deep cell-cell junctions. Protein localization was visualized by expressing tagged fusion proteins. Yellow arrowheads point to cell junctions. I. Image of the Arvcf (green) and actin (magenta) at deep cell-cell junctions. Protein localization was visualized by expressing tagged fusion proteins. Yellow arrowheads point to cell junctions. J. Schematic displaying the method used to measure fluorescent intensities at cell-cell interfaces. K. Intensity plots of Cdh3 (blue), actin (magenta) α-catenin (orange), and Arvcf (green). Here zero is set at the center of the cell-cell junction and each protein shows a clear peak at the cell junction. Each line is the average over dozens of line plots from a minimum of three replicates. Distributions were statistically compared using a KS test. L. Intensity plots of Cdh3 (blue), actin (magenta), vinculin (orange), and testin (green) at cell-cell junctions. Vinculin and testin lack peaks at the cell-cell junction and the distributions of vinculin and testin were statistically different from Cdh3 and actin as compared by a KS test. Each line represents the average of dozens of line plots over a minimum of three replicates. See also figure S1 and figure S2.
Figure 2:
Figure 2:. Arvcf is required for embryonic axis extension.
A. Wild type tadpoles (~st.40). B. Sibling embryos to those shown in Fig. 2A in which Arvcf was knocked down in the dorsal mesodermal cells. The Arvcf depleted embryos have a shortened head-to-tail axis and display a characteristic dorsal bend suggesting a CE defect. C. Sibling embryos in which Arvcf was knocked down and then rescued with exogenous expression of Arvcf-GFP. D. Plot showing tadpole (~st.40) head-to-tail length for the wildtype, ARVDF knockdown, and Arvcf rescue conditions. Embryo lengths were statistically compared using an ANOVA test. Each dot represents a single embryo and data was collected from a minimum of three experiments. E. Stage 11.5 wildtype embryos stained by in situ hybridization for the notochord probe Xnot. E’. Stage 14 wildtype embryos stained by in situ hybridization for the notochord probe Xnot. F. Stage 11.5 Arvcf knockdown embryos stained by in situ hybridization for the notochord probe Xnot. F’. Stage 14 Arvcf knockdown embryos stained by in situ hybridization for the notochord prob Xnot. G. Comparison of the total notochord length in wildtype or Arvcf knockdown embryos at stage 11.5 and stage 14. Conditions were statistically compared using a Mann-Whitney test. H. Comparison of the notochord width for wildtype or Arvcf knockdown embryos at stage 11.5 and stage 14. Conditions were statically compared using a Mann-Whitney test. I. Cartoon depicting the microinjection method used to generate mosaic animals. J. Immuno-staining for Arvcf (orange) in an embryo in which Arvcf has been mosaically knocked down (blue cells). K. The same image shown in Fig. 2J except the membrane marker has been removed to better visualize the Arvcf immunostaining. L. Quantification of endogenous Arvcf protein levels from the immunostaining performed on embryos with mosaic Arvcf knockdown. Each dot represents the average ARVCF intensity at the membrane of a single cell and data was collected from a minimum of three replicates. Conditions were statistically compared using a Mann-Whitney test.
Figure 3:
Figure 3:. External constraint of Arvcf deficient explants recapitulates the embryonic axis extension defect.
A. Image of a wildtype dorsal isolate. A’. Image of a wildtype dorsal isolate after a four-hour period of extension. B. Image of a dorsal isolate in which Arvcf has been knocked down in the mesodermal cells. B’. Image of an Arvcf depleted dorsal isolate after a four-hour period of extension. C. Graph showing the final dorsal isolate length, after a four-hour elongation, for wildtype and Arvcf depleted embryos. Each dot represents the length of a single explant and conditions were statistically compared using a Mann-Whitney test. D. Cartoon depicting the forces involved in Xenopus axis extension. Here the dorsal mesoderm (red) and the overlaying neural ectoderm (blue, above red) converge and extend generating force to push against the stiff embryo. In the case of wildtype embryos, the CE generated force is sufficiently large (red arrows) to overcome the embryo stiffness and the resulting animals have elongated head-to-tail axis. E. We hypothesize that Arvcf is required for CE generated force and that depletion of Arvcf reduces the tissue level force produced by CE. In this case the reduced CE force is insufficient to push the stiff surrounding embryo and axis extension fails. F. Schematic depicting the constrained explant assay used to mimic the mechanical environment experienced within the embryo. G. Image of a dorsal isolate after embedding in gel. G’. Image of the same dorsal isolate shown in Fig. 3G after 4 hours of elongation. H. Image of an Arvcf deficient dorsal isolate after embedding. H’. Image of the same dorsal isolate in Fig. 3H after a 4-hour interval of extension. I. Graph showing the extent of dorsal isolate elongation during the constrained explant assay for wildtype and Arvcf knockdown dorsal isolates. The y-axis shows the ratio of the final explant length over the final explant length. Each dot represents a single dorsal isolate and conditions were statistically compared using a Mann-Whitney test. See also figure S3.
Figure 4:
Figure 4:. Arvcf controls force production during vertebrate convergent extension.
A. Schematic depicting the assay used to measure the CE force production. Dorsal explants were excised from late gastrula embryos (~st.12) and embedded in semi-rigid 0.6% agarose gels with known mechanical properties. Fluorescent beads were also embedded in gel to allow visualization of the gel deformation. Explants were then incubated for three hours to allow CE. Then with the known mechanical properties of the gel and the displacement field of the beads we calculated the stress fields generated by each explant. B. Images of a wildtype explant embedded in a semi-rigid agarose gel and then a second image of the same explant after a three-hour incubation. White arrow points to the direction of the out-of-plane explant buckling. B’. Image of the same explant and gel shown in Fig. 4B but here we are visualizing the beads embedded in the gel and surrounding the explant. The inset focuses on the beads adjacent to the explant and the zoomed in image shows both the initial bead position (blue) and the final bead position (orange). C. Image of an Arvcf depleted explant embedded in a semi-rigid agarose gel and a second image of the same explant after a three-hour incubation. C’. Image of the beads surrounding the explant shown in Fig. 4C. The inset focuses on a subset of beads next to the explant and the zoomed image shows the initial bead position (blue) and the final bead position (orange). D. Displacement field measured by PIV from the beads in Fig. 4B’. E. Displacement field measured by PIV from the beads in Fig. 4C’. F. Von Mises stress field estimated using finite element method in the gel shown in Fig. 4B. G. Von Mises stress field estimated using finite element method in the gel shown in Fig. 4C. H. Graph showing the maximum compressive stress along the explant-gel interface. Conditions were statistically compared using a Mann-Whitney test and Arvcf depleted explants applied a significantly lowered force on the gel. I. Graph showing the average compressive stress along the AP axis. Conditions were statistically compared using a Mann-Whitney test and Arvcf depleted explants applied a significantly lowered extending force along the AP axis. J. Schematic depicting the buckling model to estimate tissue stiffness. Explant was modeled as a column with a rectangular cross-section. When it converged and extended in a semi-rigid gel, the reactive force applied a uniform longitudinal load that caused an out-of-plane tissue buckling, K. Graph showing the estimated tissue stiffness using a simplified buckling model. Conditions were statistically compared using a Mann-Whitney test and Arvcf depleted explants were significantly softer. See also figure S4.
Figure 5:
Figure 5:. Arvcf KD reduces cell adhesion but only has a modest effect on cell intercalation.
A. Immunostaining for endogenous Cdh3 (green) in a field of cells where Arvcf had been mosaically knocked down. A membrane marker (magenta) was used as a tracer for the Arvcf morpholino. B. Image showing the isolated Cdh3 channel from Fig. 5A. C. Graph displaying the measurement of endogenous Cdh3 intensity from wildtype or Arvcf depleted cells. Each dot represents the average cdh3 intensity of a single cell and conditions were statistically compared using a Mann-Whitney test. D. Cartoon depiction of the cell movements that drive CE with emphasis on the cell-cell junctions. Initially there is a cell-cell junction between the anterior-posterior cells (light gray) termed a v-junction (red). The cells then intercalate bringing the mediolateral cells (dark gray) together. The mediolateral cells then form a new cell-cell contact (t-junction; orange) pushing the anterior posterior cells apart. E. Still frames from a time-lapse movie of wildtype cells intercalating. Cell membranes are labeled blue, and the cell intercalation can be visualized as the v-junction is replaced by a t-junction. F. Frames from a time-lapse movie showing one example of Arvcf depleted cells intercalating. Here we initially observe a v-junction which shortens, forms a 4-cell intermediate, which then resolves to form a new t-junction. One feature that was unique to the intercalation of the Arvcf depleted cells was that there were often gaps (yellow dashed lines) between the membranes at the intermediate state. Despite these gaps, cells were able to intercalate after ARVCF-KD.
Figure 6:
Figure 6:. Depletion of Arvcf resulted in a dampening of the oscillatory temporal dynamics of Cdh3 and actin.
A. Image of deep cell-cell interfaces showing actin in magenta and myosin in green. Yellow arrowheads point to myosin accumulations at v-junctions. B. Image of deep cell-cell interfaces after Arvcf knockdown. Yellow arrows point to myosin enrichments at v-junctions. C. Intensity plots showing the mean intensity of actin at v-junctions. Wildtype is shown in black and Arvcf knockdown cells are shown in gray. Conditions were statistically compared using a KS test. D. Intensity plots showing mean intensity of myosin at deep v-junctions. Black shows wildtype and gray shows Arvcf depleted cells. Conditions were statistically compared using a KS test. E. Cdh3 (green) and actin (magenta) intensity plotted over time from a wildtype shortening v-junction. Dashed lines show the rolling average (over 3.33 min) for either Cdh3 or actin. F. Plot showing Cdh3 (green) and actin (magenta) intensity over time from an Arvcf depleted shortening v-junction. Dashed lines show the rolling average. G. We quantified the oscillation amplitude as the deviation of a protein’s intensity plot from that same protein’s rolling average. This graph shows the average Cdh3 amplitude for wildtype and Arvcf knockdown v-junctions. Each dot is the average amplitude from a single shortening v-junction. Conditions were compared using a Mann-Whitney test. H. The same quantification shown in Fig. 6J but looking at actin oscillation amplitude. Again, each dot represents the average amplitude at a single shortening v-junction and conditions were compared using a Mann-Whitney test. I. Schematic showing the transverse fluctuations which we use as a proxy for local junction tension. Orange shows the productive in-plane motion of junction shortening and blue shows the transverse fluctuations that are opposed to in-plane motion. Dashed lines represent the initial junction position. J. Quantification of the probability that a wildtype (black) or Arvcf knockdown (gray) junction will undergo a transverse fluctuation of a given size. The Arvcf knockdown junctions had significantly larger transverse fluctuations. Conditions were compared using a Mann-Whitney test.

References

    1. Aktary Z, Alaee M, Pasdar M, 2017. Beyond cell-cell adhesion: Plakoglobin and the regulation of tumorigenesis and metastasis. Oncotarget 8, 32270–32291. - PMC - PubMed
    1. Arslan FN, Eckert J, Schmidt T, Heisenberg C-P, 2021. Holding it together: when cadherin meets cadherin. Biophysical Journal. - PMC - PubMed
    1. Badel P, Rohan CP, Avril S, 2013. Finite Element simulation of buckling-induced vein tortuosity and influence of the wall constitutive properties. J Mech Behav Biomed Mater 26, 119–126. - PubMed
    1. Barriga EH, Franze K, Charras G, Mayor R, 2018. Tissue stiffening coordinates morphogenesis by triggering collective cell migration in vivo. Nature 554, 523–527. - PMC - PubMed
    1. Cetera M, Leybova L, Joyce B, Devenport D, 2018. Counter-rotational cell flows drive morphological and cell fate asymmetries in mammalian hair follicles. Nature Cell Biology 20, 541–552. - PMC - PubMed

Publication types

LinkOut - more resources