. 2022 Apr 26;39(4):110730.
doi: 10.1016/j.celrep.2022.110730.

In vivo partial cellular reprogramming enhances liver plasticity and regeneration

Affiliations

In vivo partial cellular reprogramming enhances liver plasticity and regeneration

Tomoaki Hishida et al. Cell Rep. .

Abstract

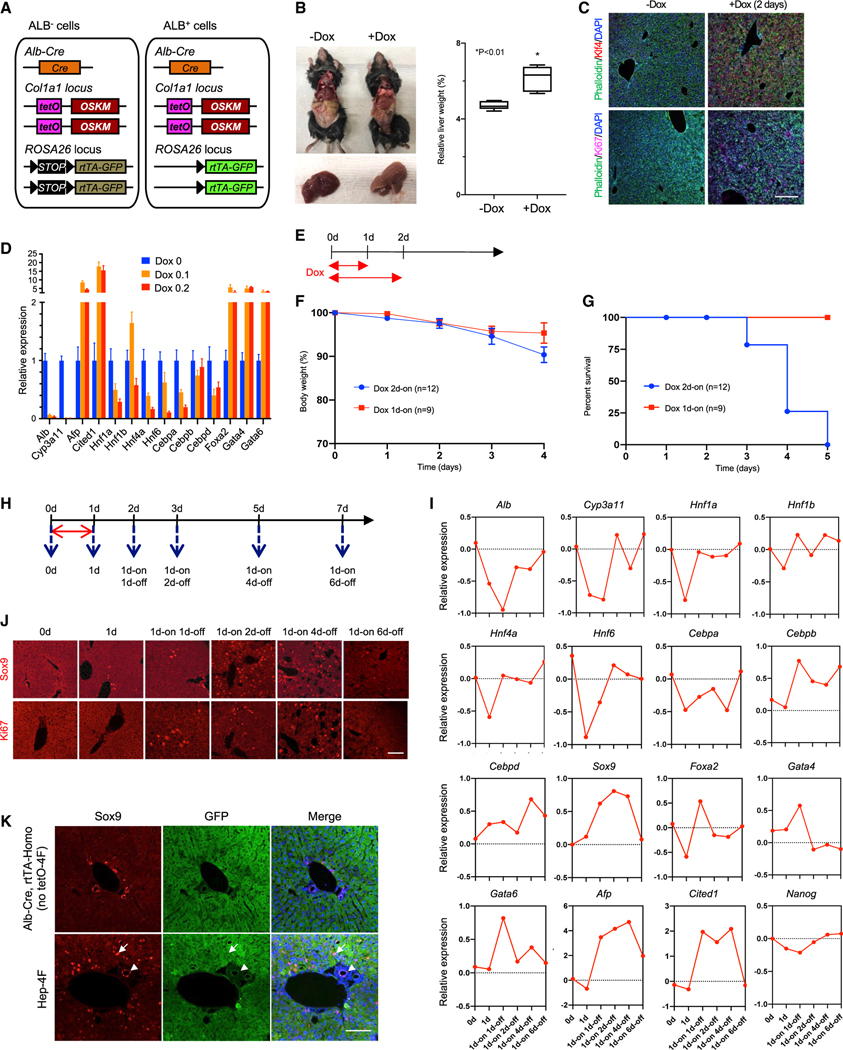
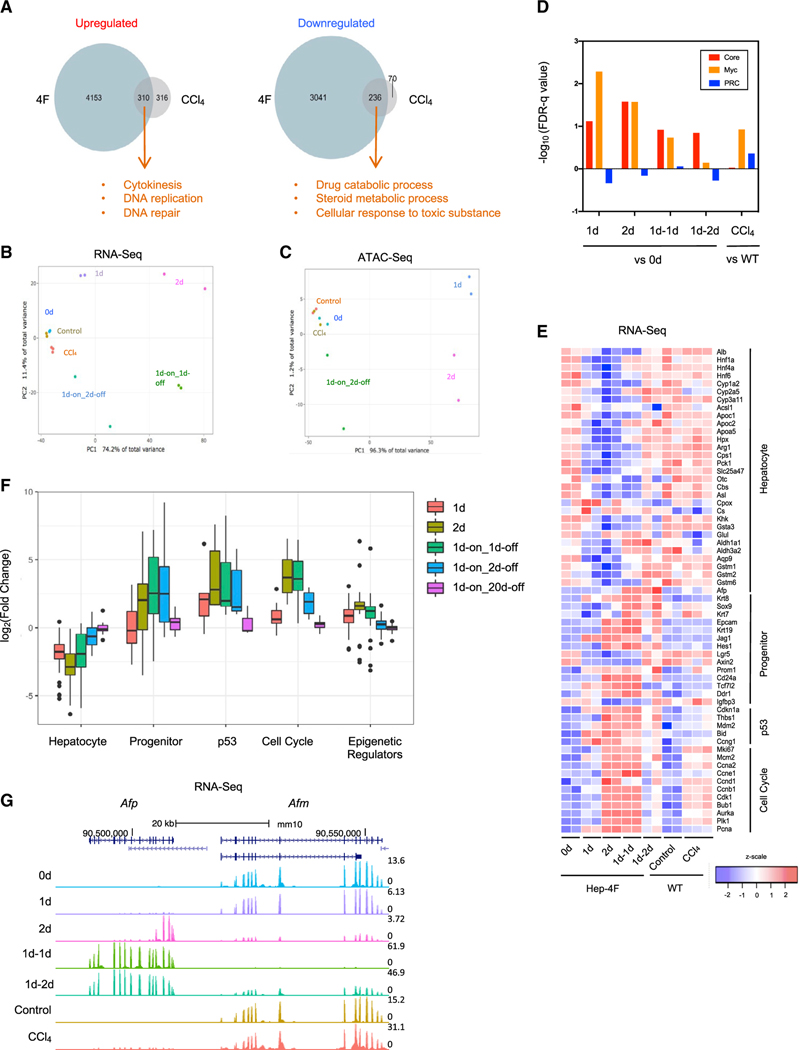
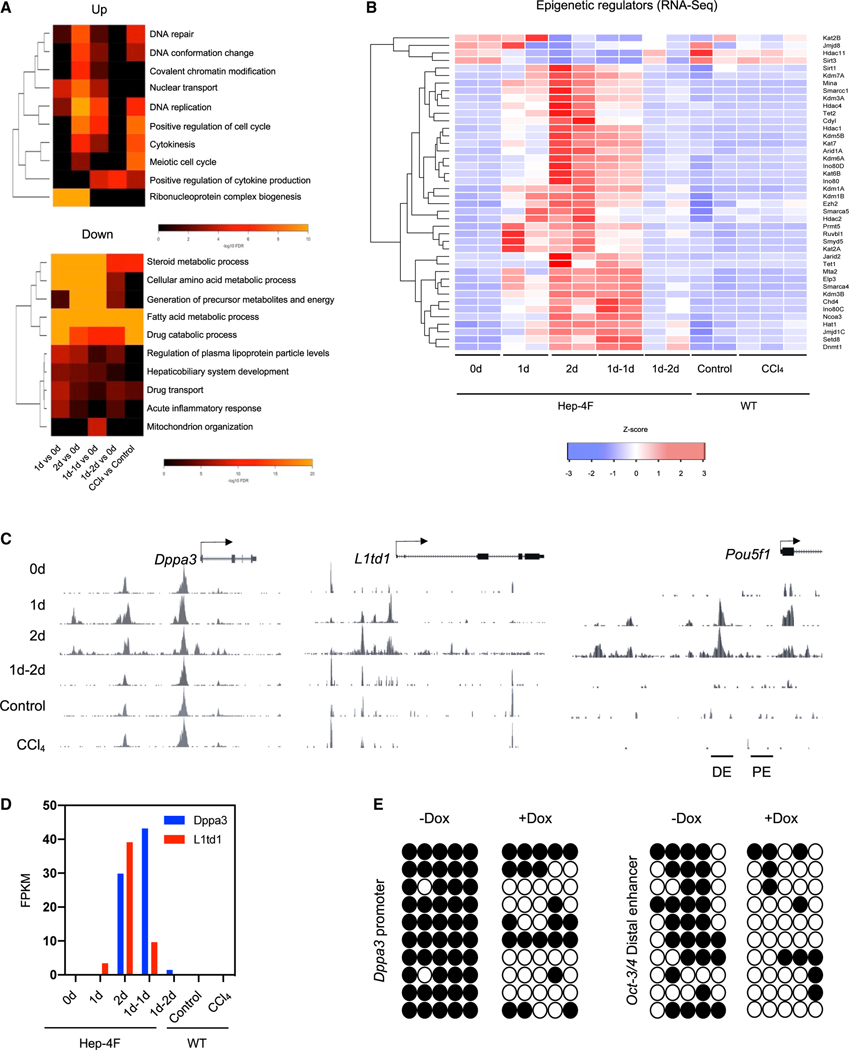
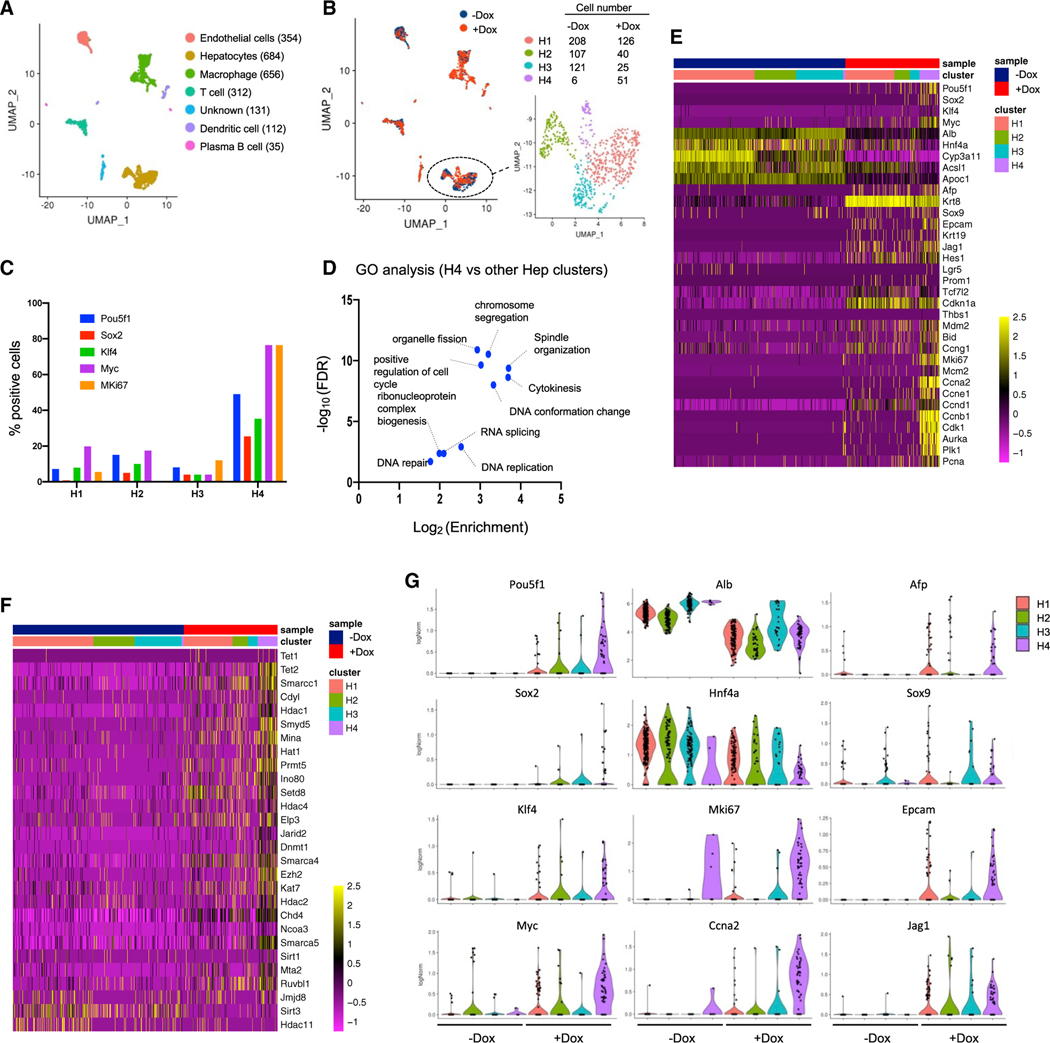
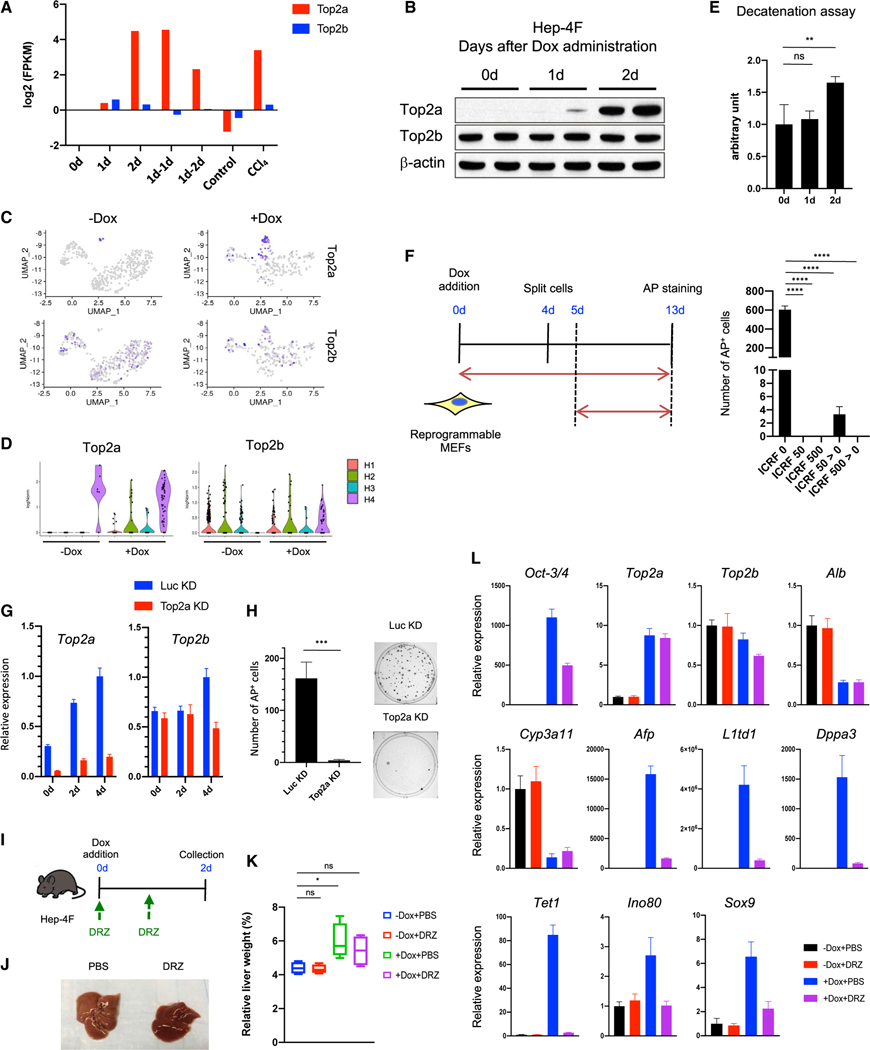
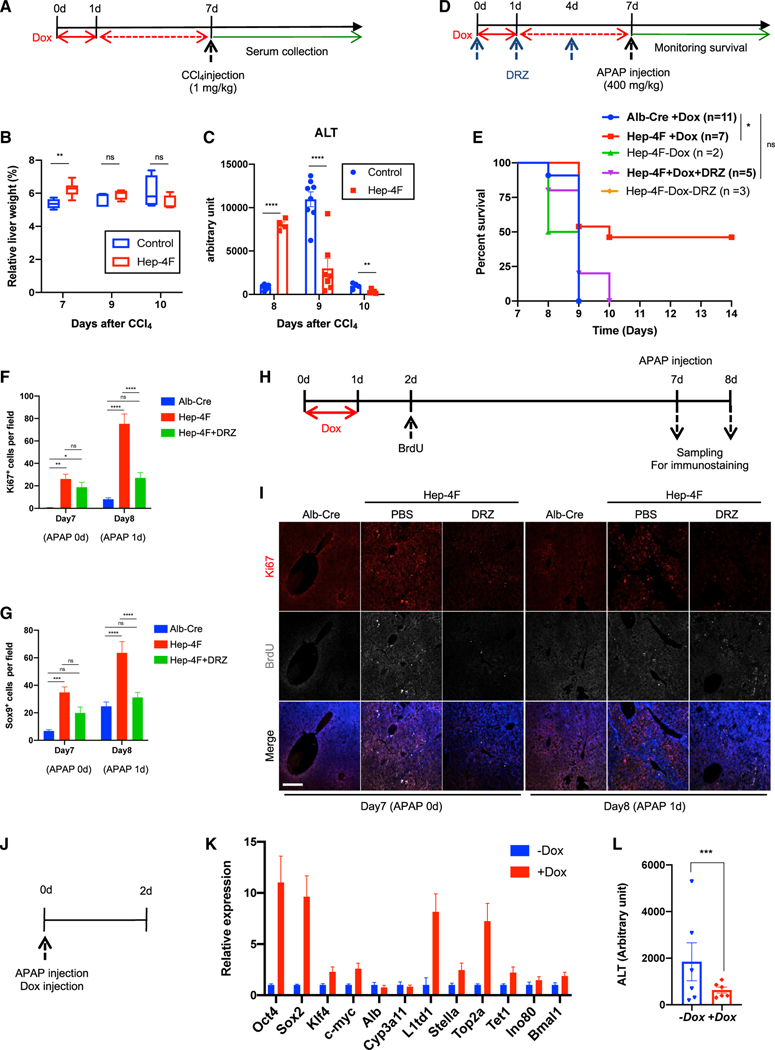
Mammals have limited regenerative capacity, whereas some vertebrates, like fish and salamanders, are able to regenerate their organs efficiently. The regeneration in these species depends on cell dedifferentiation followed by proliferation. We generate a mouse model that enables the inducible expression of the four Yamanaka factors (Oct-3/4, Sox2, Klf4, and c-Myc, or 4F) specifically in hepatocytes. Transient in vivo 4F expression induces partial reprogramming of adult hepatocytes to a progenitor state and concomitantly increases cell proliferation. This is indicated by reduced expression of differentiated hepatic-lineage markers, an increase in markers of proliferation and chromatin modifiers, global changes in DNA accessibility, and an acquisition of liver stem and progenitor cell markers. Functionally, short-term expression of 4F enhances liver regenerative capacity through topoisomerase2-mediated partial reprogramming. Our results reveal that liver-specific 4F expression in vivo induces cellular plasticity and counteracts liver failure, suggesting that partial reprogramming may represent an avenue for enhancing tissue regeneration.

Keywords: CP: Stem cell research; dedifferentiation; liver; regeneration; reprogramming.


Conflict of interest statement

Declaration of interests The authors declare no competing interests.

Figures

Figure 1.
Figure 1.. Induction of transient, partial reprogramming by liver-specific 4F expression
(A) Schematic representation of the genetic makeup for lineage-traceable, liver-specific 4F inducible mouse models. In this model, rtTA can be activated by Alb-Cre, allowing for specific 4F induction in the liver in a Tet-ON manner. (B) Livers collected from Dox-treated and untreated Hep-4F mice 2 days after Dox administration. Left: representative images are shown. Right: relative liver weight (% body weight) is shown. Data represent the mean with SE (n = 5). *p < 0.01 (unpaired t test). (C) Immunostaining for Klf4 and Ki67. Livers were collected 2 days after Dox administration. Scale bar, 200 μm. (D) qPCR analysis for liver-related genes in the liver of Hep-4F mice treated with different concentrations of Dox (0.1 or 0.2 mg/mL) for 2 days. Data represent the mean with SD (n = 3; technical replicates). (E) Schematic representation for Dox treatment protocol. (F and G) Body weight (F) and survival (G) of Hep-4F mice after Dox treatment (0.1 mg/mL; 1d-on, n = 9; 2d-on, n = 12). (H) Schematic representation of time course for Dox treatment protocol. (I and J) Time course experiment of qPCR (I) and IHC for Sox9 and Ki67 (J). Data represent the mean (n = 2; biological replicates). Scale bar, 200 μm. (K) GFP-based lineage-tracing experiments for hepatocytes after 4F induction. Livers were collected 1 day after Dox withdrawal. White arrow and white arrowhead indicate atypical Sox9+ cells and Sox9+ cholangiocytes, respectively. Scale bar, 100 μm.
Figure 2.
Figure 2.. Global analysis of transcriptome and chromatin accessibility of Hep-4F mice
(A) Venn diagrams summarizing overlapping upregulated or downregulated genes responsive to 4F expression (day 2 versus day 0) and CCl4 treatment. GO analyses were performed for overlapping DEGs. (B and C) PCA analysis for RNA-seq (B) and ATAC-seq (C). Livers were collected at the indicated time points: 0d, 1d, 2d, 1d-on_1d-off, and 1d-on_2d-off. To compare reprogramming with regeneration, B6 mice were treated with or without CCl4 for acute injury, and the livers were collected 3 days after the treatment: control and CCl4. Each sample was prepared in duplicates except CCl4 samples, which are in triplicates. (D) Bar chart for false discovery rate (FDR)-q value for ESC modules (core, Myc, and PRC modules) as calculated from RNA-seq. WT, wild type. (E) Heatmap for liver gene-expression signature in Hep-4F mice. (F) Long-term effect of 4F after Dox withdrawal. Boxplots show gene expression of each gene set (related to Figures 2E and 3B), normalized to that of control samples (0 days) based on RNA-seq. (G) Genome browser tracks of RNA-seq for Afp and Afm loci.
Figure 3.
Figure 3.. Epigenetic reprogramming by liver-specific 4F expression
(A) GO analysis for differentiation-expressed genes in RNA-seq. (B) Heatmap for epigenetic modifiers in Hep-4F mice. (C) Genome browser view of the ATAC-seq data at the indicated gene loci. (D) Expression levels of Dppa3 and L1td1 genes in Dox-treated Hep-4F mice. Data were extracted from RNA-seq (Figure 2). Data represent the mean (n = 2; biological replicates). FPKM, fragments per kilobase of exon per million mapped fragments. (E) Bisulfite sequencing of the Dppa3 promoter and distal enhancer of Oct-3/4 with the liver samples collected from the mice treated with or without Dox for 2 days.
Figure 4.
Figure 4.. Single-cell transcriptome analysis of Hep-4F mice
(A) UMAP visualization of liver cell clusters. Hep-4F mice were treated with or without Dox for 1 day and single-cell suspensions were prepared from the liversisolated at 1 day after Dox withdrawal. Each cell type was characterized based on gene expression (Figure S5A). (B) Left: UMAP plot of untreated (−Dox) or Dox-treated (+Dox) liver cell clusters: −Dox (blue dots) and +Dox (red dots). Right: enlarged hepatocyte clusters are shown. (C) Relative cell number for the indicated genes in each hepatocyte cluster. (D) Volcano plots of GO analyses for DEGs between H4 cells and the other hepatocyte cells. (E and F) Heatmap of gene expression of the liver-related and cell-cycle-related genes (E) and of the epigenetic modifiers (F) in the cells of hepatocyte subclusters. (G) Violin plots for gene expression of the reprogramming-related genes in each hepatic cluster.
Figure 5.
Figure 5.. Role of Top2a on reprogramming in vitro and in vivo
(A) Time course for gene expression of Top2a and Top2b in reprogramming livers. Data were extracted from RNA-seq (Figure 2). Data represent the mean (n = 2; biological replicates). (B) Western blotting for Top2a and Top2b in liver samples collected at indicated time points after Dox administration. (C) UMAP visualization for Top2a and Top2b. (D) Violin plots for gene expression of Top2a and Top2b in each hepatic cluster. (E) Decatenation assay for topoisomerase activity in liver samples. Data represent the mean with SD (n = 4). ns, not significant. (F) Effect of ICRF-193 (Top2 inhibitor) on iPSC reprogramming. Left: schematic representation for ICRF-193 (ICRF) treatment protocol is shown. Right: reprogramming efficiency is shown. Data represent the mean with SD (n = 3). (G) qPCR for Top2a and Top2b in the cells expressing short hairpin RNA (shRNA) for Top2a (Top2a knockdown [KD]) or for Luciferase (Luc KD). Data represent the mean with SD (n = 3; technical replicates). (H) Reprogramming efficiency of Top2a or Luc KD cells. Data represent the mean with SD (n = 3). (I) Schematic representation of dexrazoxane (DRZ) treatment protocol. (J) Livers collected from PBS-treated and DRZ-treated Hep-4F mice 1 day after Dox withdrawal. (K) Relative liver weight (% body weight). Data represent the mean with SE (n = 5). (L) qPCR analysis for PBS- or DRZ-treated Hep-4F mice with or without Dox for 2 days. Data represent the mean with SD (n = 3; technical replicates). Statistical analyses were conducted by unpaired t test or one-way ANOVA with Tukey’s post hoc analysis. *p < 0.05; **p < 0.01; ***p < 0.001; ****p < 0.0001.
Figure 6.
Figure 6.. Improvement of liver regeneration capacity induced by 4F-mediated partial reprogramming
(A) Schematic representation for CCl4 treatment protocol. Alb-Cre mice (no 4F cassette) or Hep-4F mice were treated with Dox for 1 day. Six days following Dox withdrawal, the mice were injected with CCl4. (B) Relative liver weight (% body weight). Data represent the mean with SE (n = 5). (C) ALT levels of Alb-Cre or Hep-4F mice. Data represent the mean with SE (control: n = 5 [8 days], n = 8 [9 days], n = 4 [10 days]; Hep-4F, n = 4 [8 days], n = 7 [9 days], n = 5 [10 days]). (D) Schematic representation for APAP treatment protocol. Hep-4F mice were treated with or without Dox for 1 day. Six days following Dox withdrawal, the mice were injected with APAP. (E) Survival curve of Hep-4F mice. (F) Quantification of Ki67+ cells. Data represent the mean with SE (n = 12). (G) Quantification of Sox9+ cells. Data represent the mean with SE (n = 12). (H) Schematic representation for APAP treatment protocol for cell tracking of BrdU-positive cells. (I) IHC for Ki67 and BrdU. Scale bar, 200 μm. (J) Schematic representation for the protocol of simultaneous injection of Dox and APAP. (K) qPCR analysis for Hep-4F mice with or without Dox for 2 days. Data represent the mean with SD (n = 3; technical replicates). (L) ALT levels of Dox-treated or untreated Hep-4F mice 2 days after APAP treatment. Data represent the mean with SE (n = 6). Statistical analyses were conducted by unpaired t test or one-way ANOVA with Tukey’s post hoc analysis.*p < 0.05; **p < 0.01; ***p < 0.001; ****p < 0.0001.

References

    1. Abad M, Mosteiro L, Pantoja C, Canamero M, Rayon T, Ors I, Grana O, Megias D, Dominguez O, Martinez D, et al. (2013). Reprogramming in vivo produces teratomas and iPS cells with totipotency features. Nature 502, 340–345. - PubMed
    1. Athwal VS, Pritchett J, Llewellyn J, Martin K, Camacho E, Raza SM, Phythian-Adams A, Birchall LJ, Mullan AF, Su K, et al. (2017). SOX9 predicts progression toward cirrhosis in patients while its loss protects against liver fibrosis. EMBO Mol. Med. 9, 1696–1710. - PMC - PubMed
    1. Belteki G, Haigh J, Kabacs N, Haigh K, Sison K, Costantini F, Whitsett J, Quaggin SE, and Nagy A. (2005). Conditional and inducible transgene expression in mice through the combinatorial use of Cre-mediated recombination and tetracycline induction. Nucleic Acids Res. 33, e51. - PMC - PubMed
    1. Bezerra JA, Bugge TH, Melin-Aldana H, Sabla G, Kombrinck KW, Witte DP, and Degen JL (1999). Plasminogen deficiency leads to impaired remodeling after a toxic injury to the liver. Proc. Natl. Acad. Sci. U S A 96, 15143–15148. - PMC - PubMed
    1. Bhushan B, and Apte U. (2019). Liver regeneration after acetaminophen hepatotoxicity: mechanisms and therapeutic opportunities. Am. J. Pathol. 189, 719–729. - PMC - PubMed

Publication types