. 2022 Apr 26;39(4):110740.
doi: 10.1016/j.celrep.2022.110740.

circMbl functions in cis and in trans to regulate gene expression and physiology in a tissue-specific fashion

Affiliations

circMbl functions in cis and in trans to regulate gene expression and physiology in a tissue-specific fashion

Nagarjuna Reddy Pamudurti et al. Cell Rep. .

Abstract

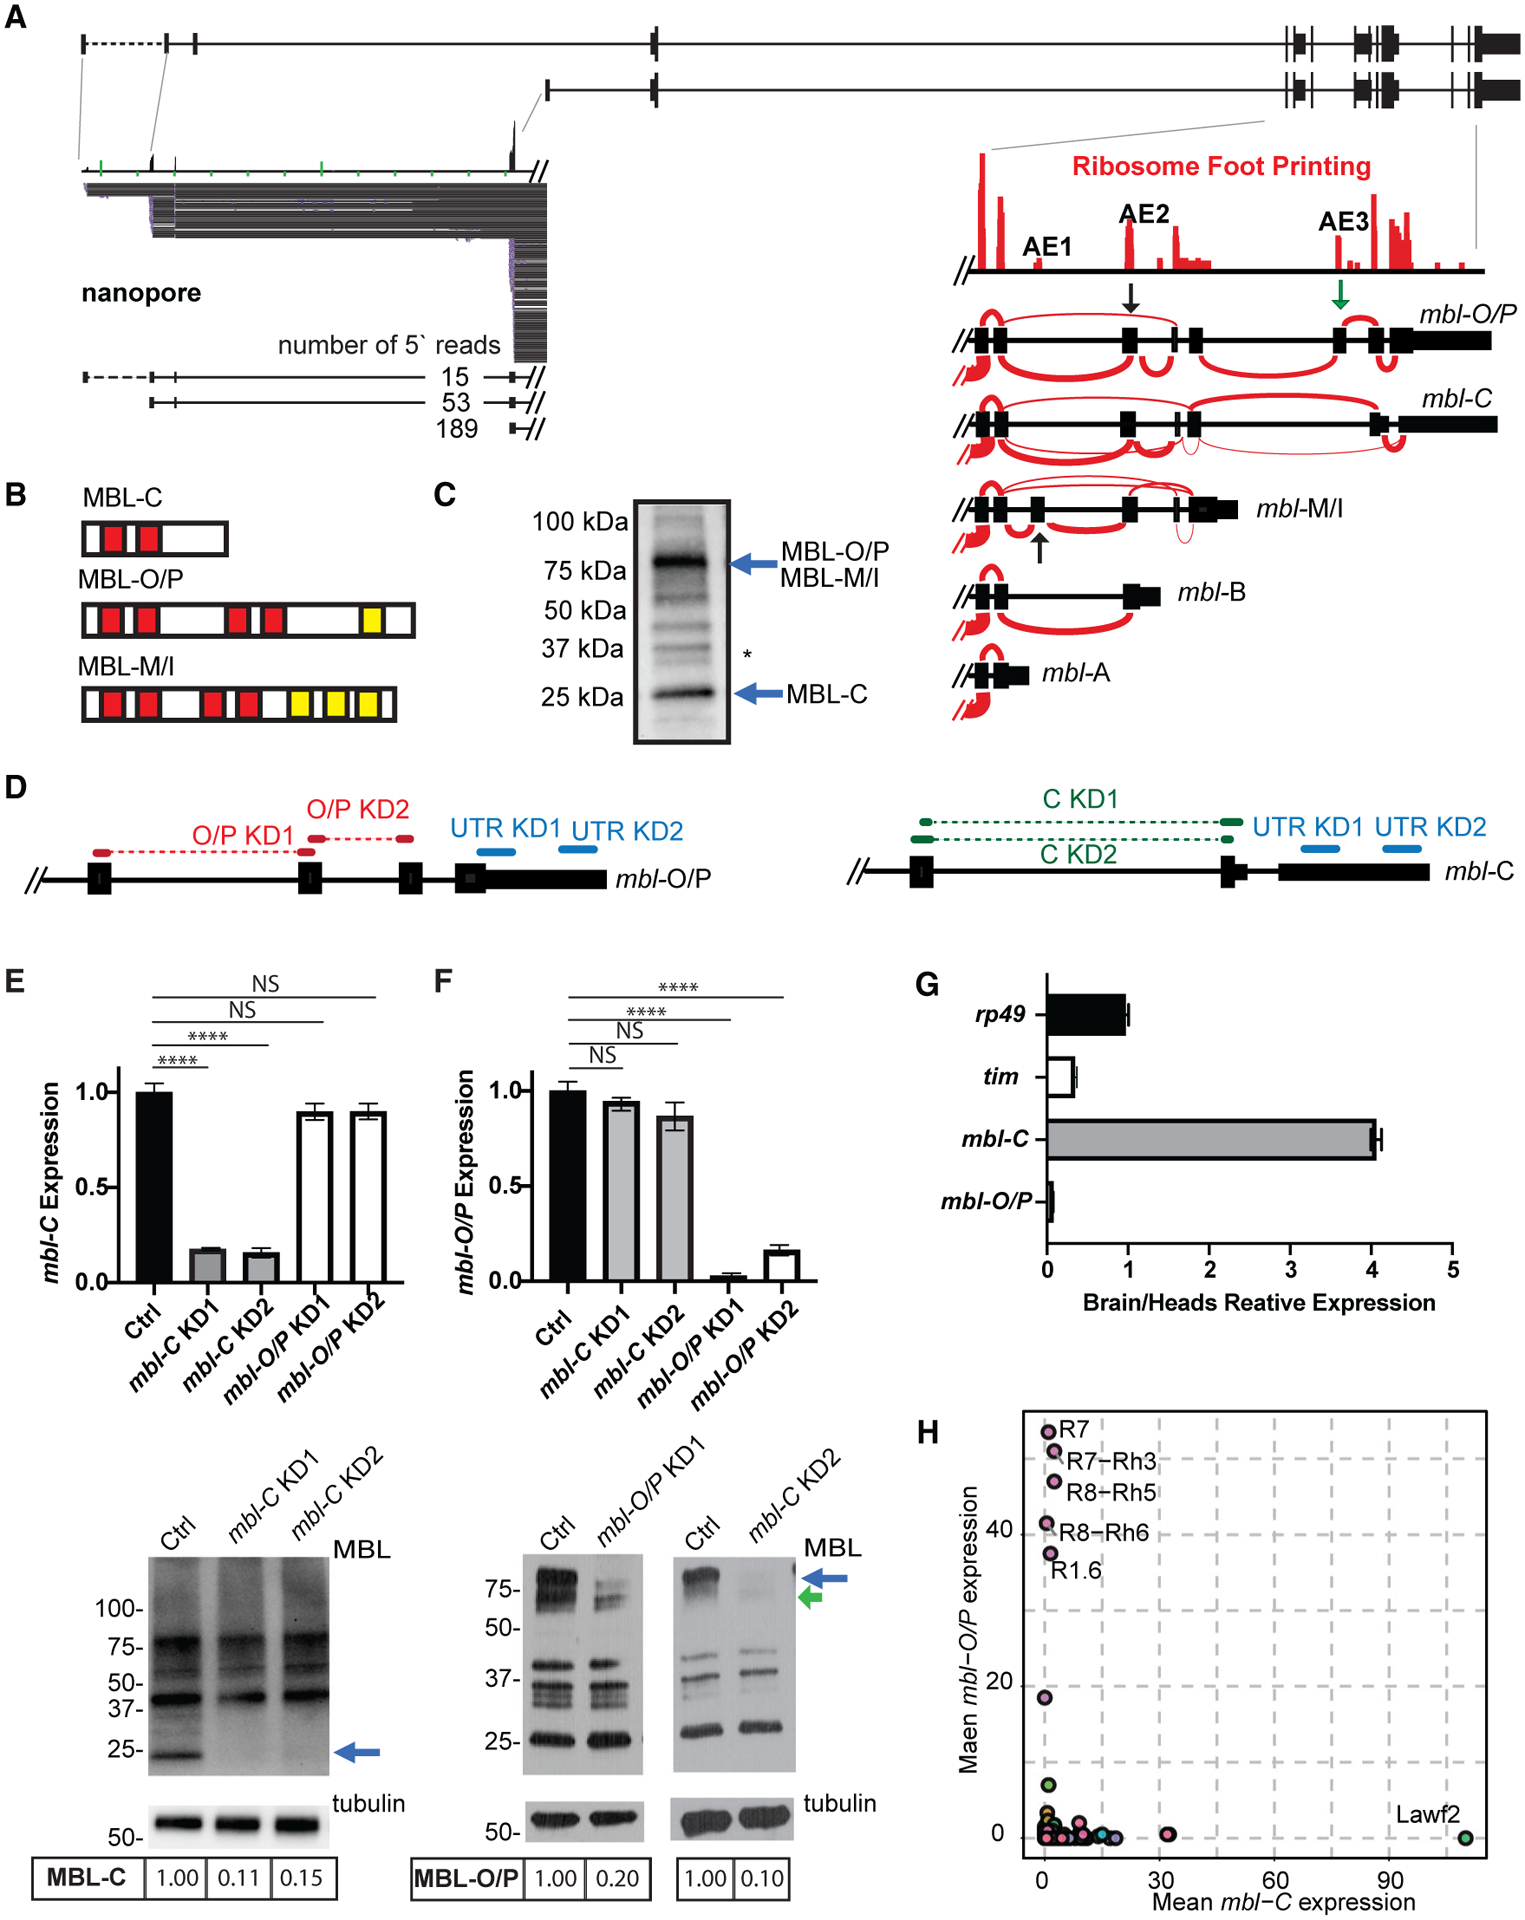
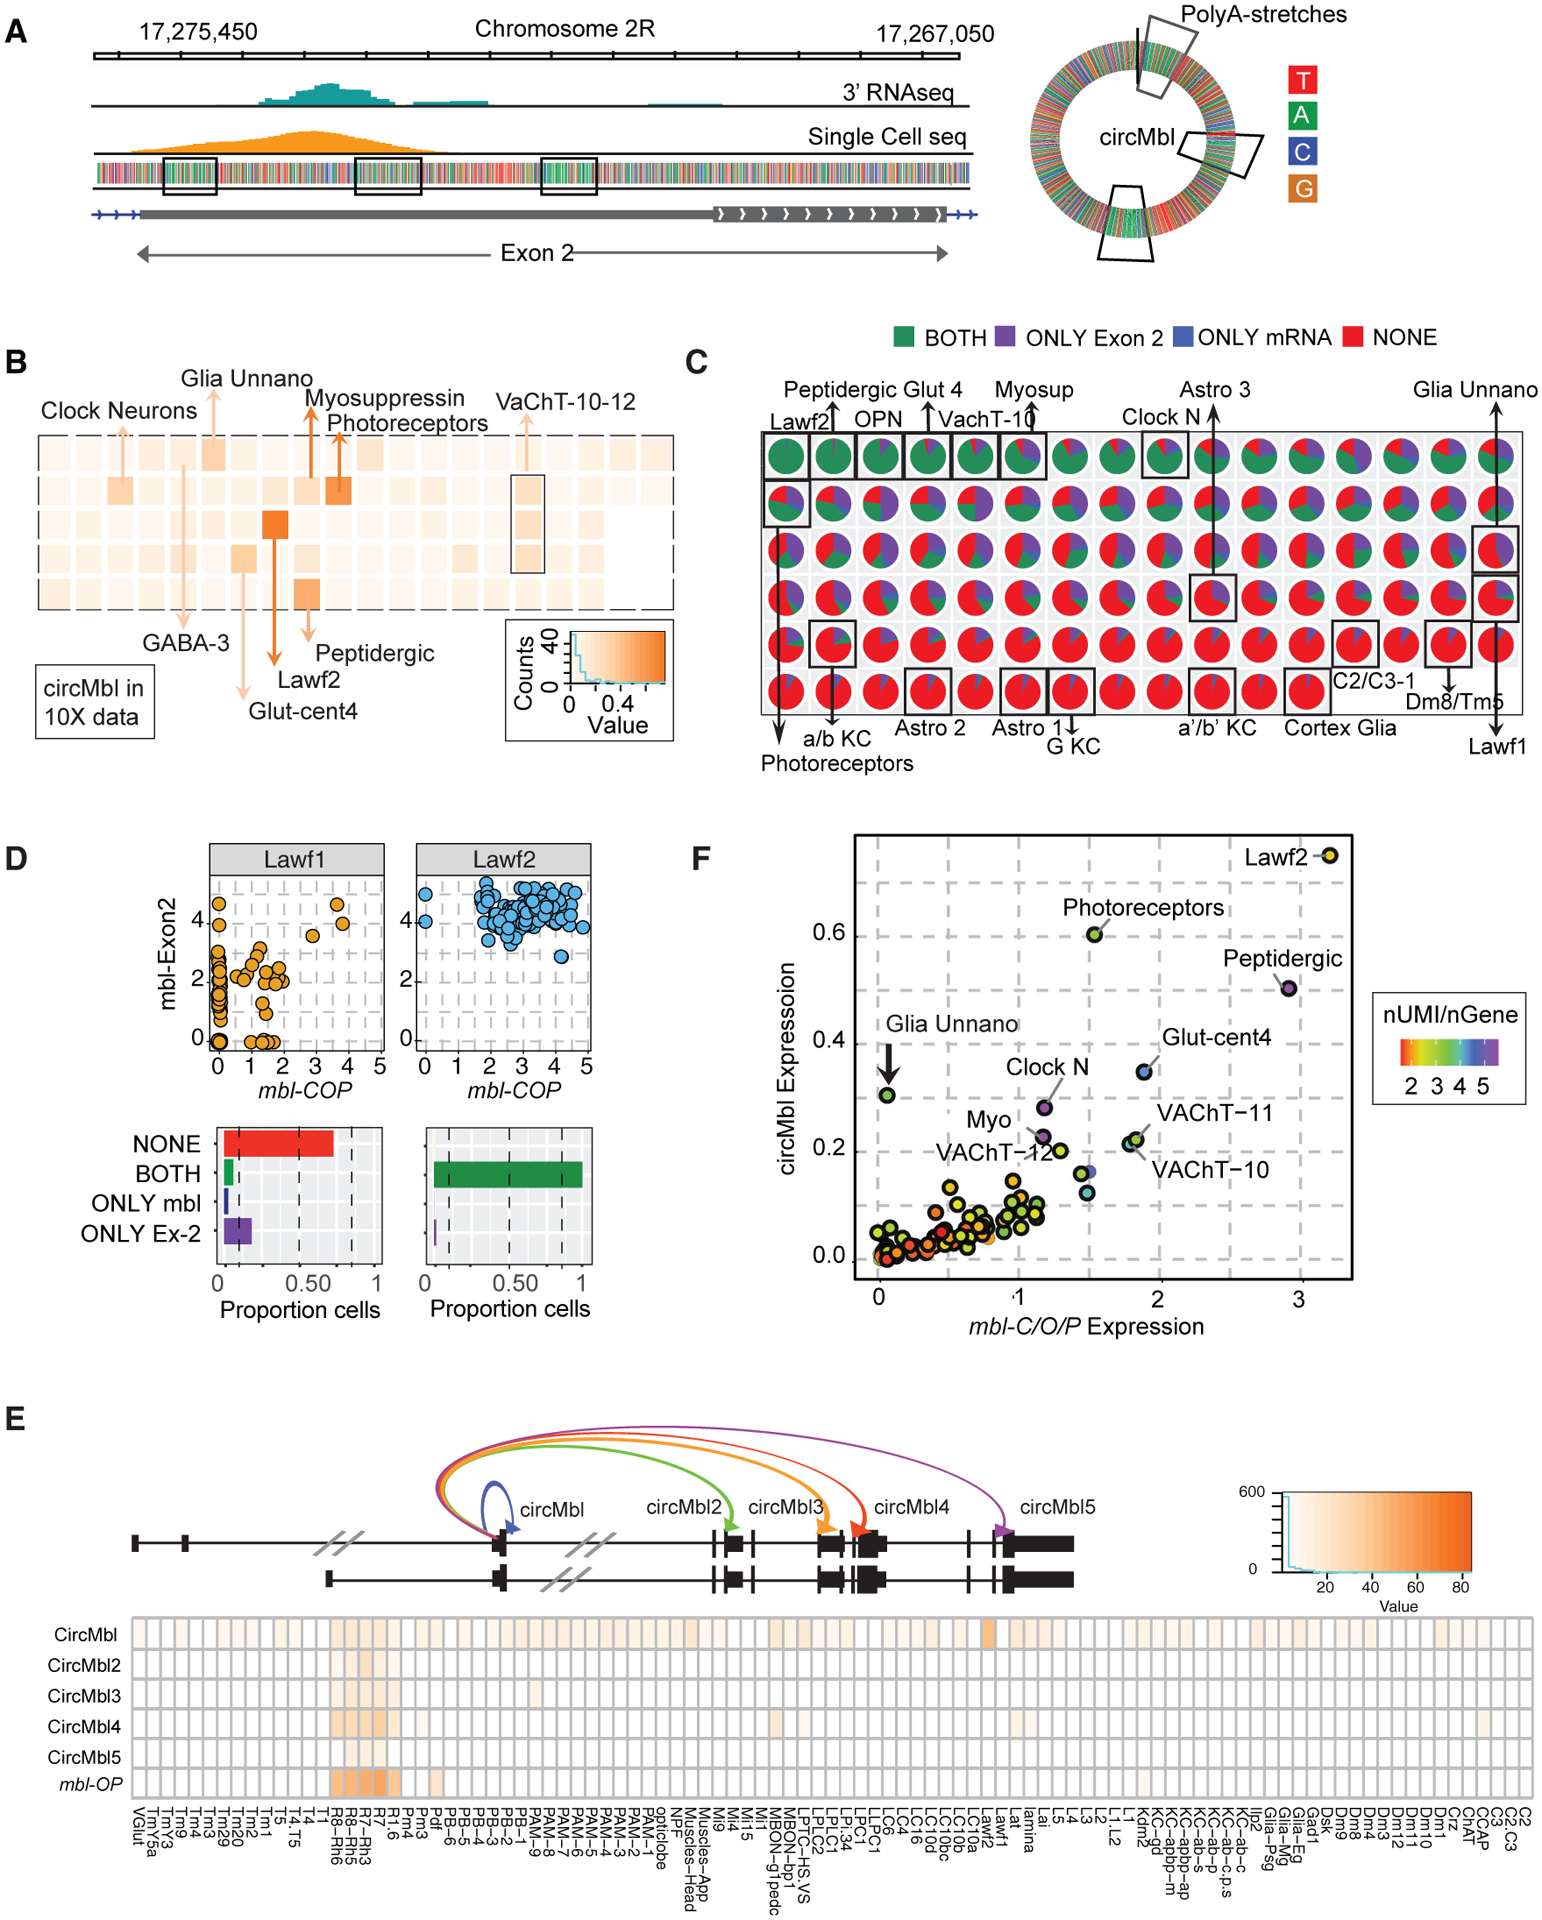
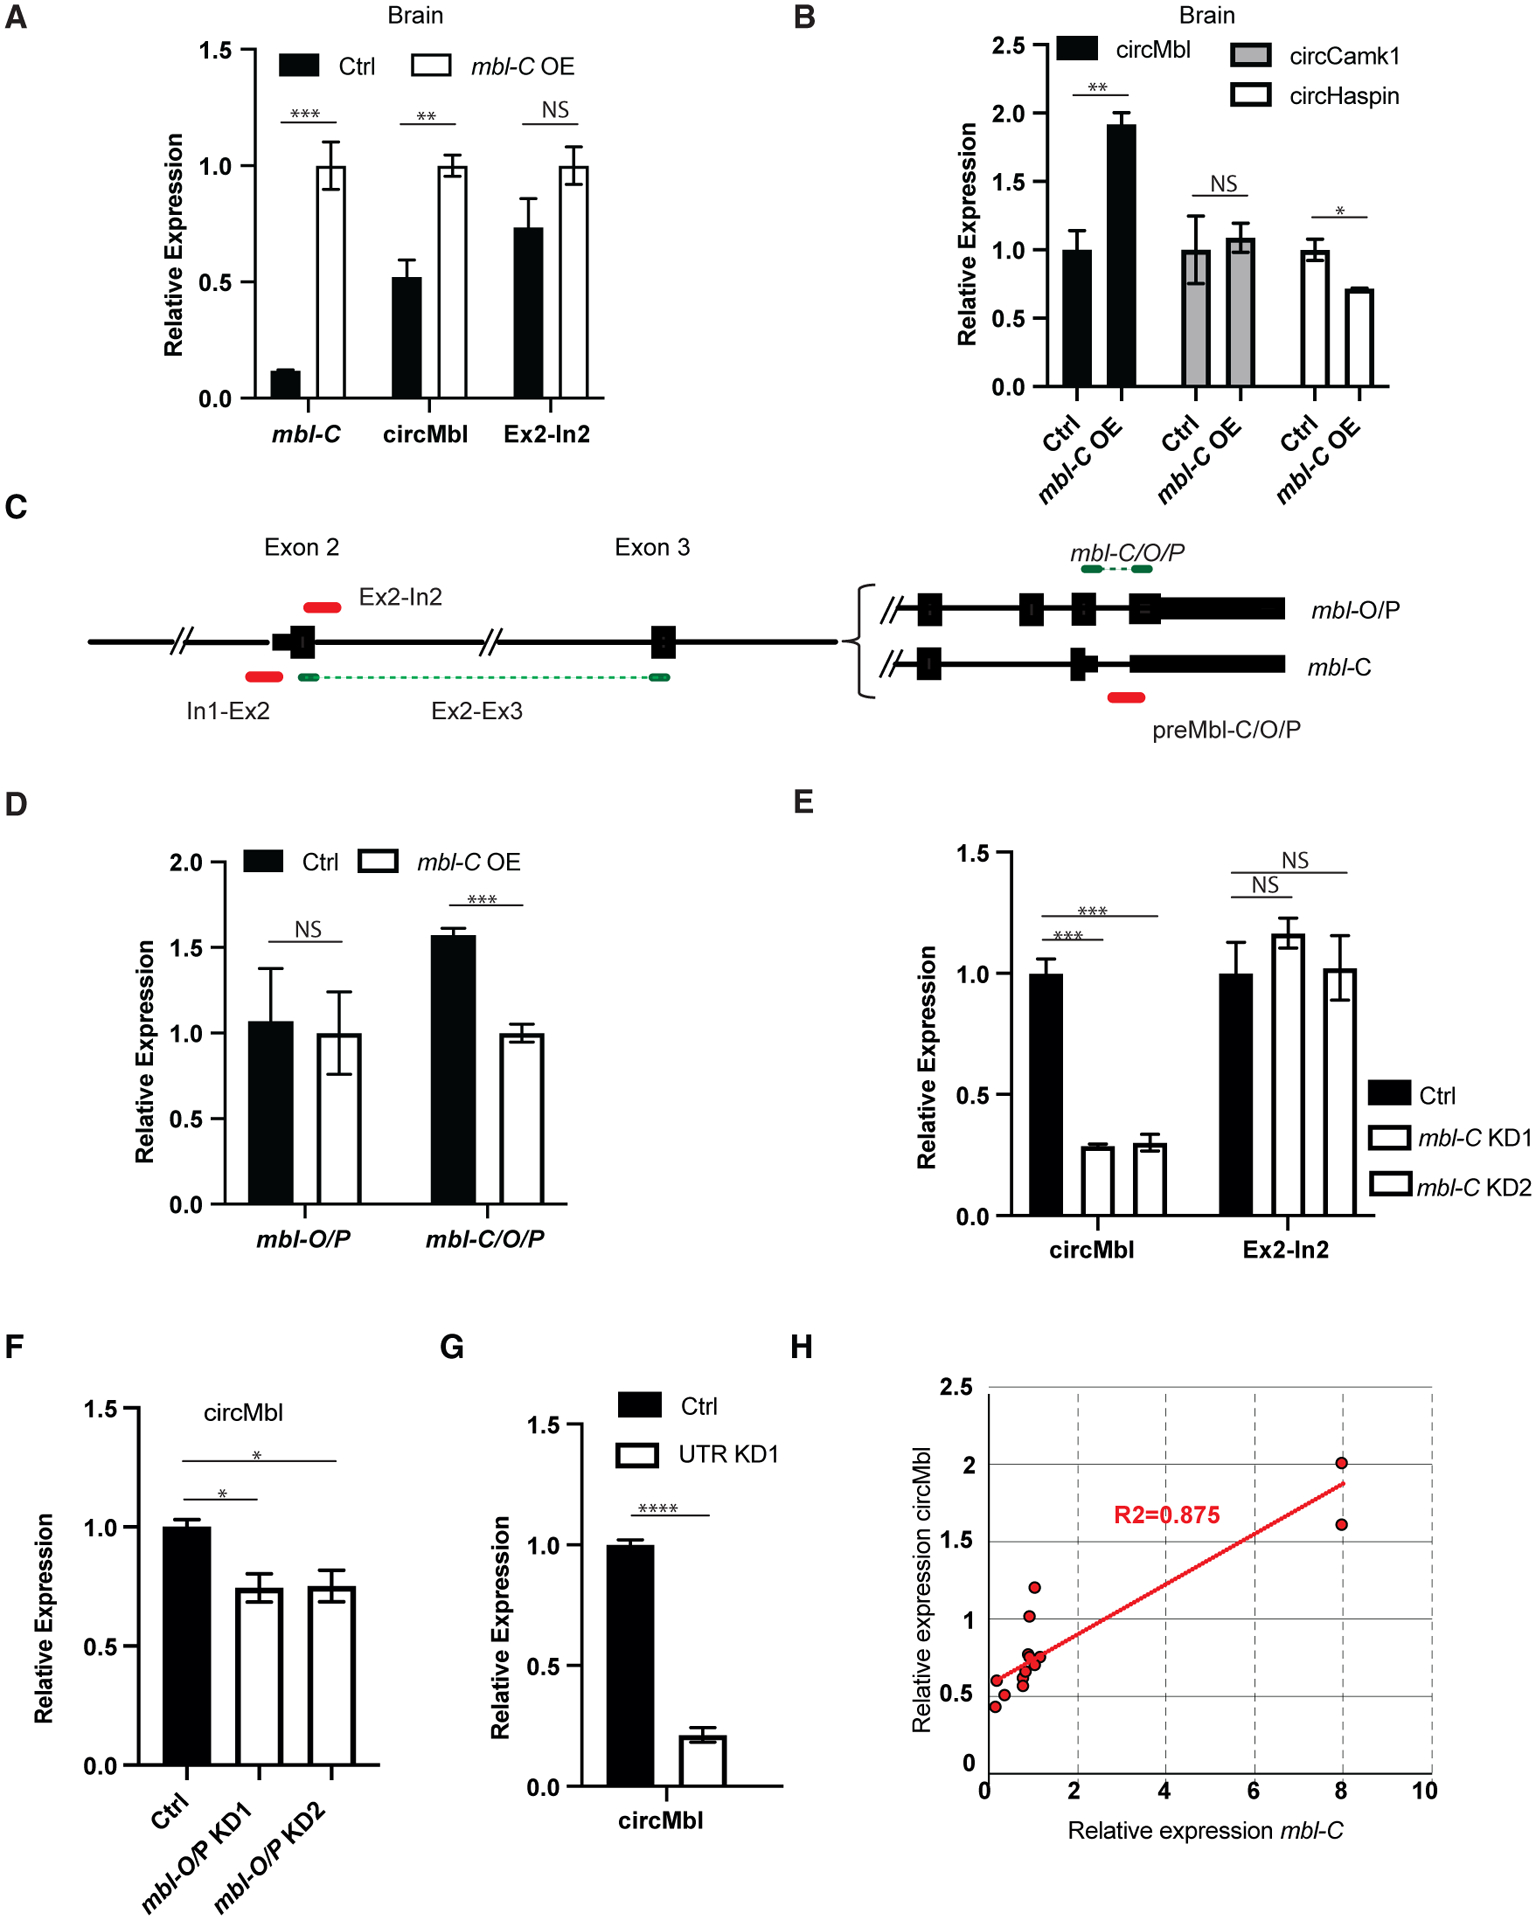
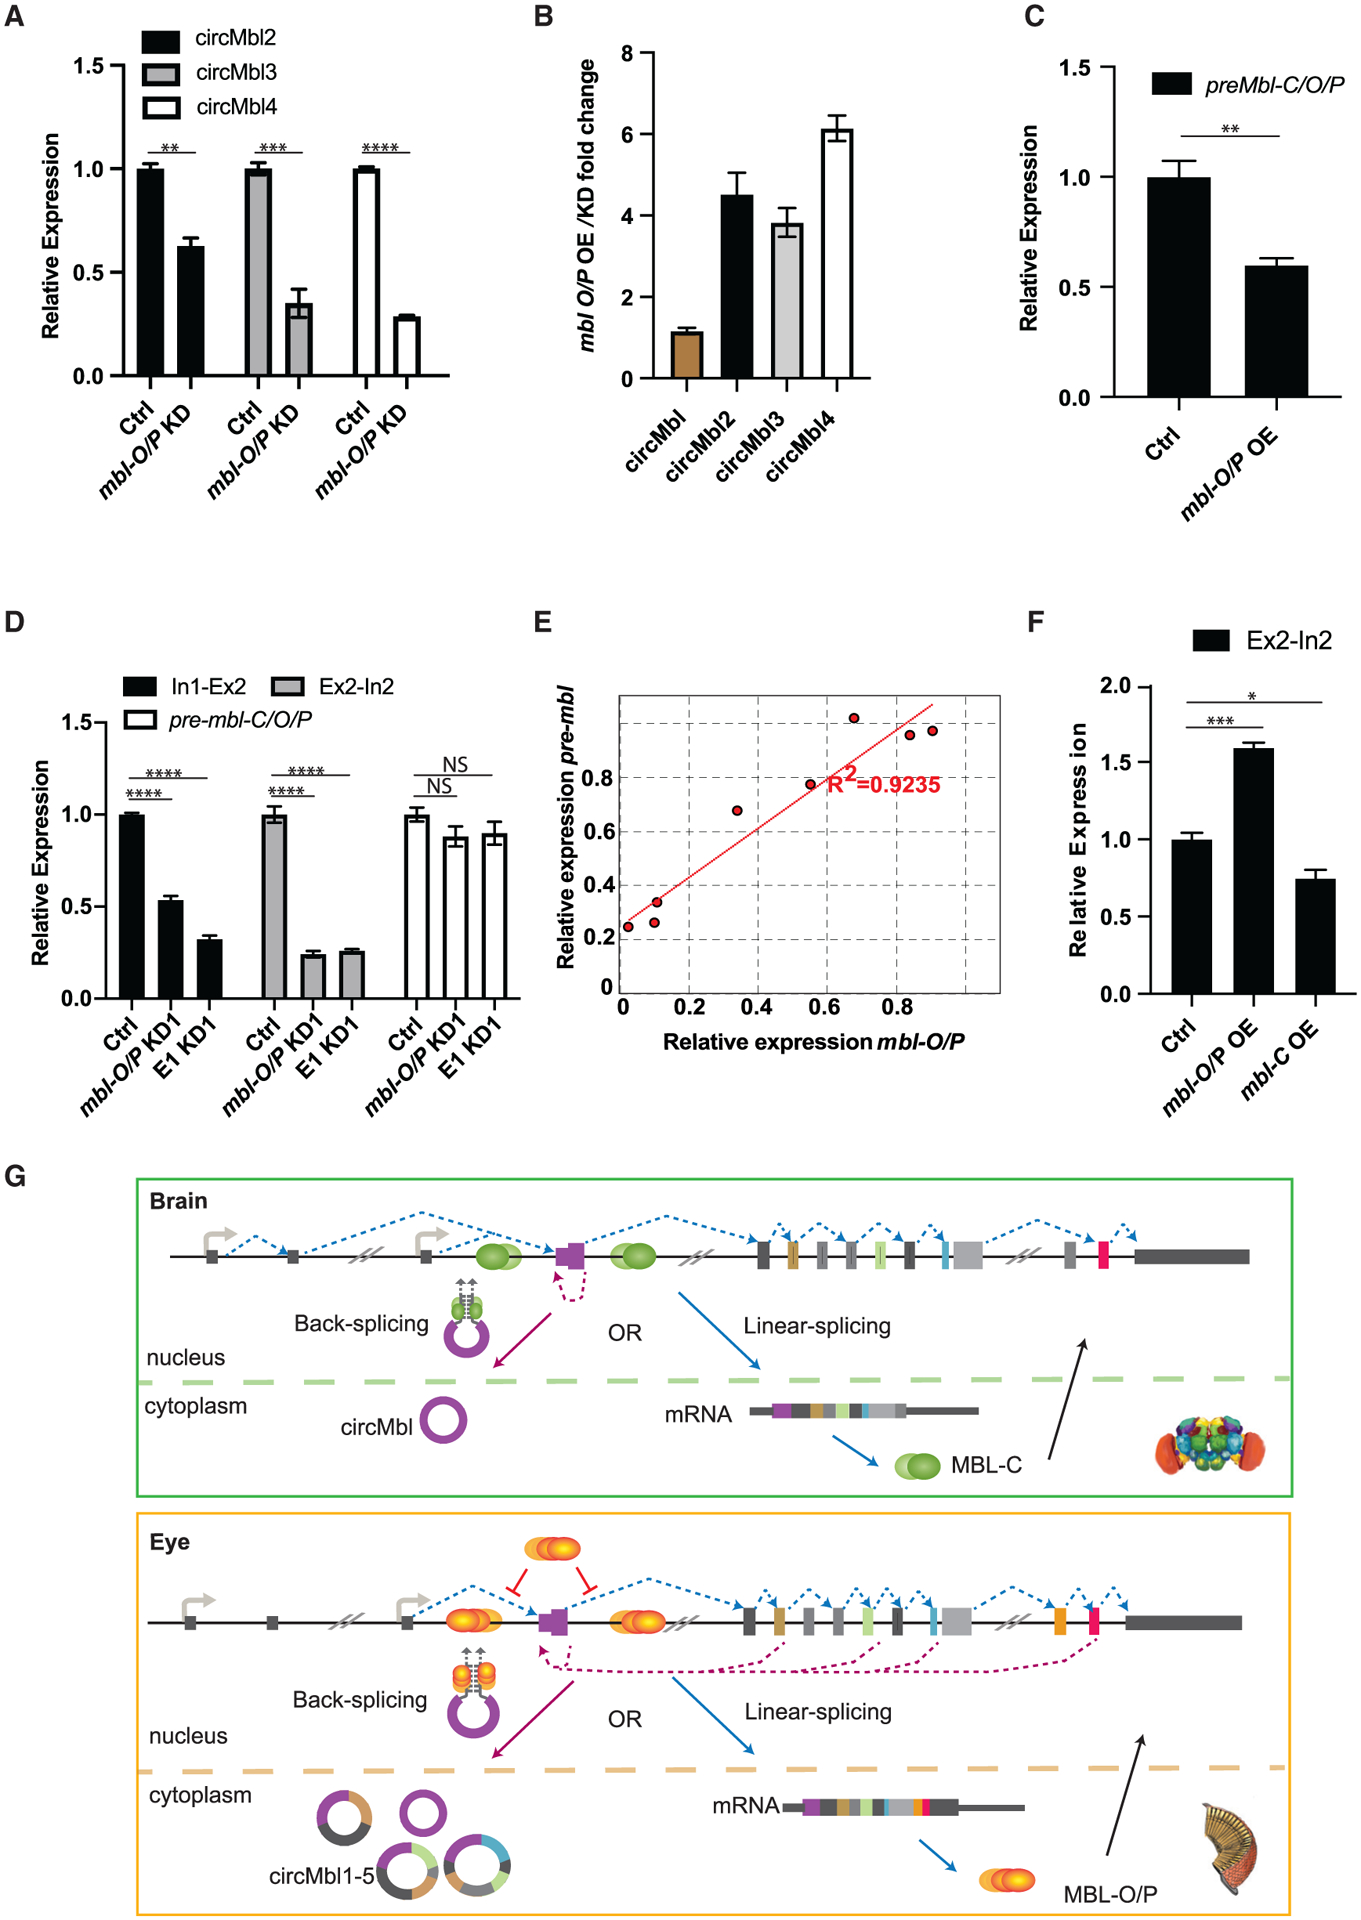
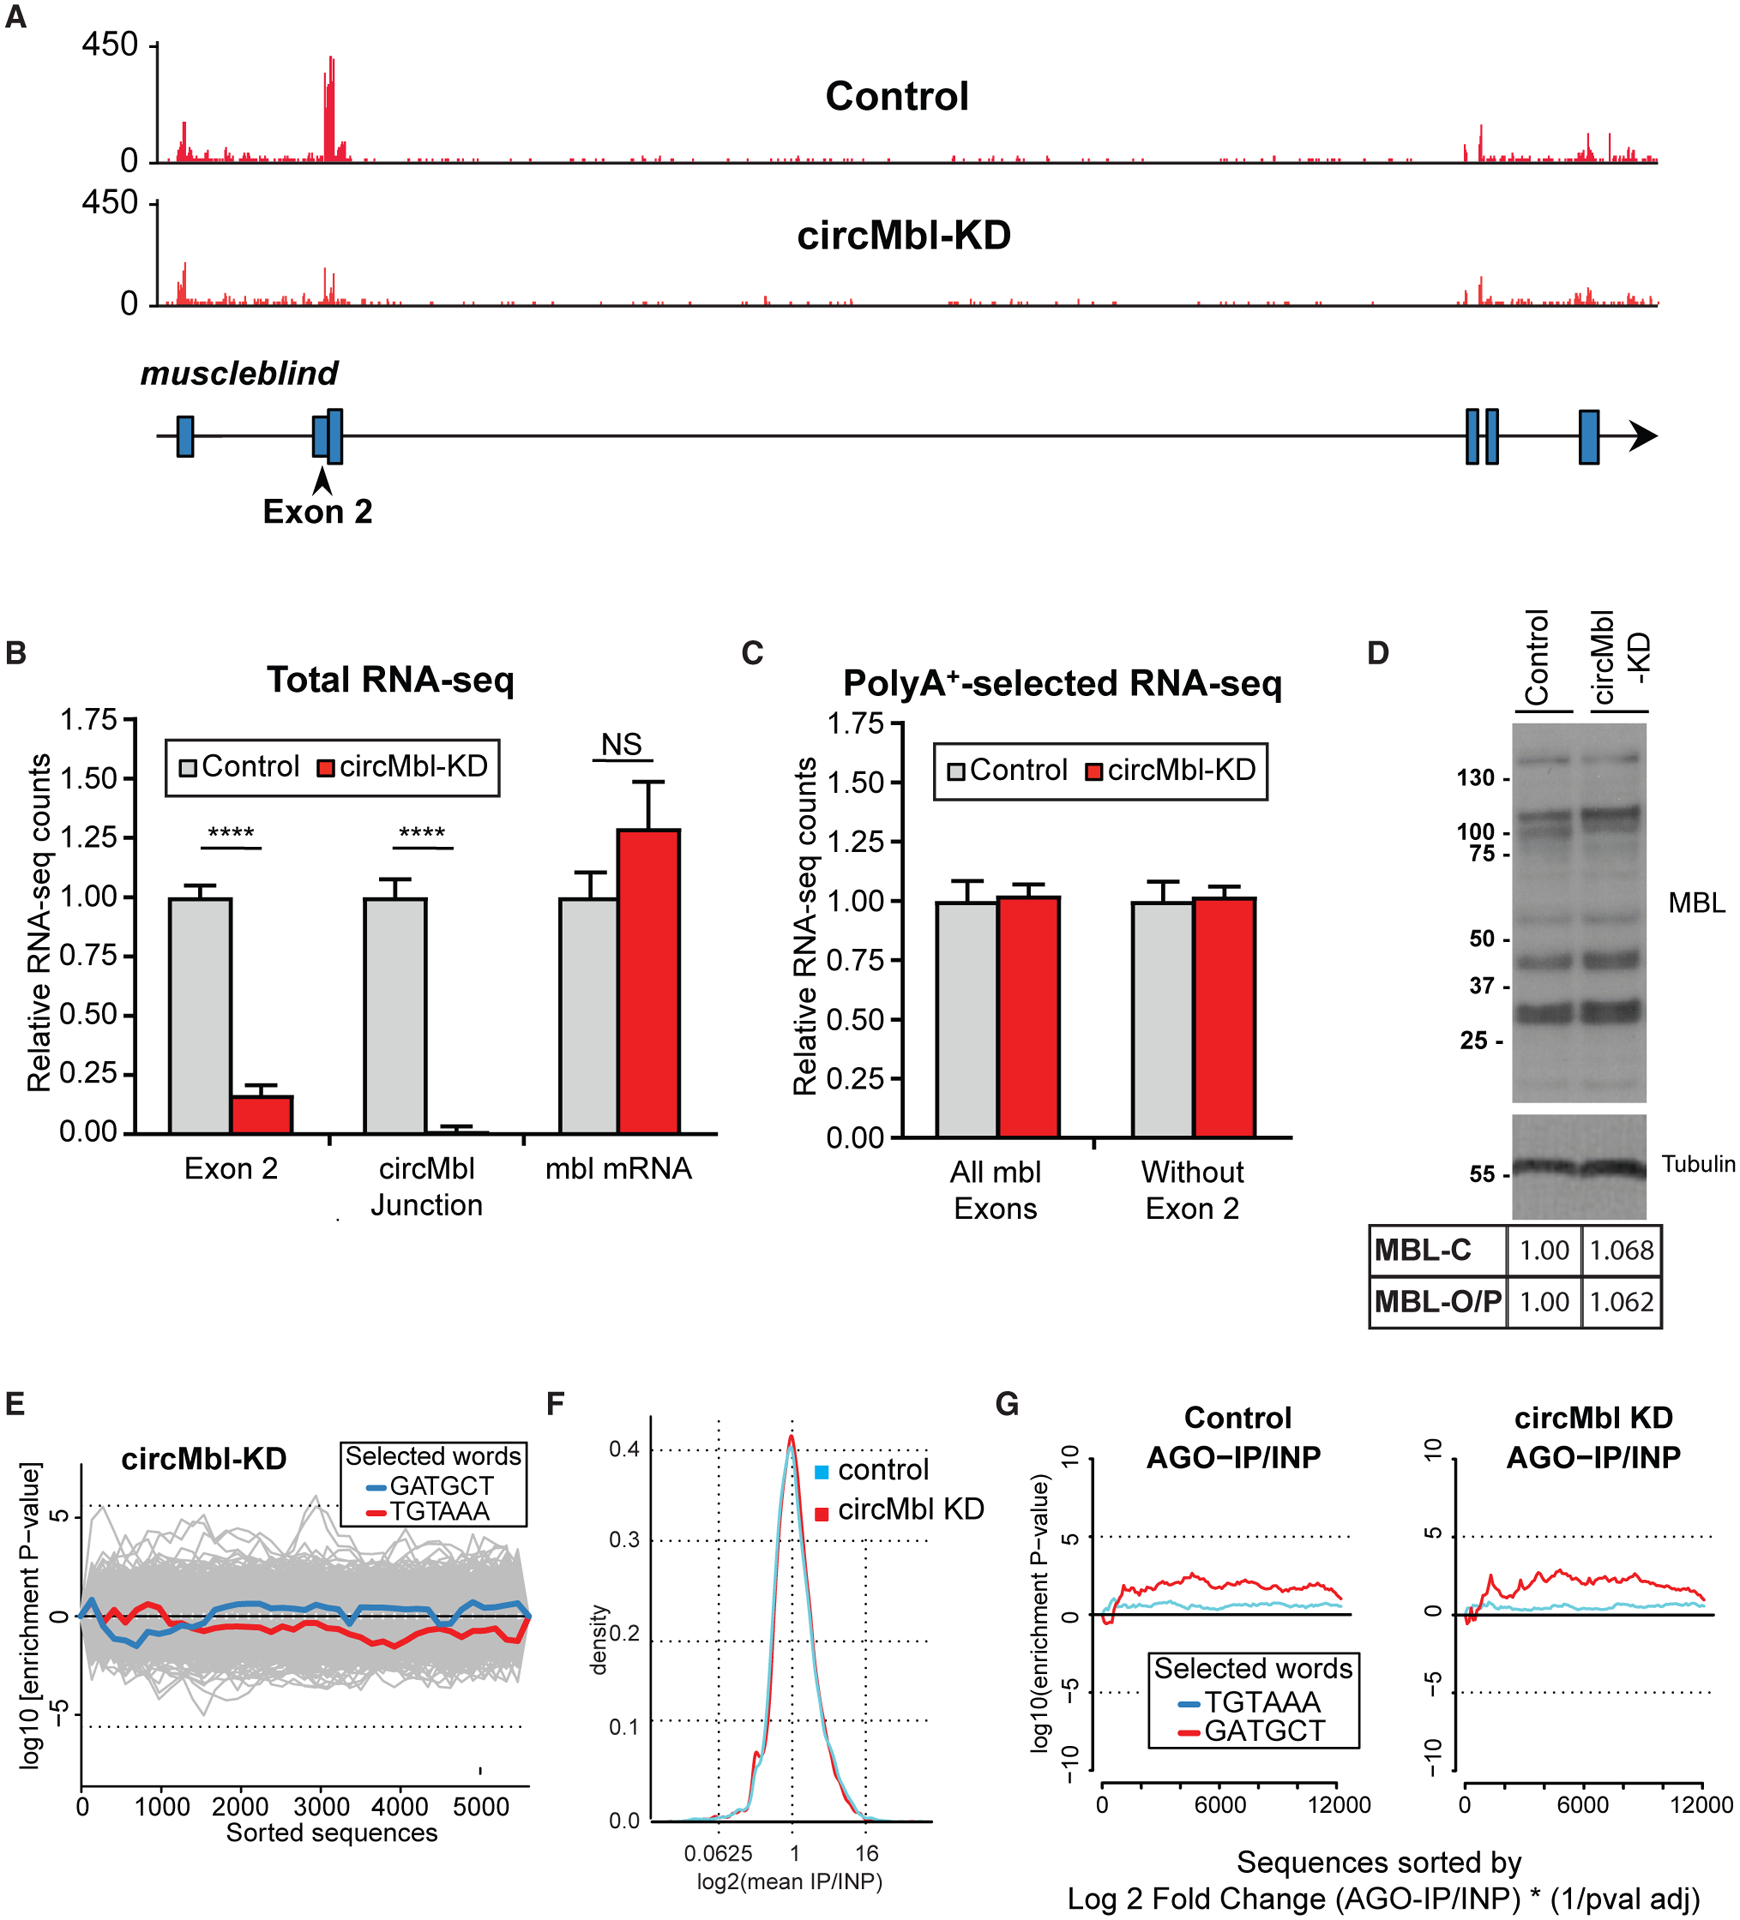
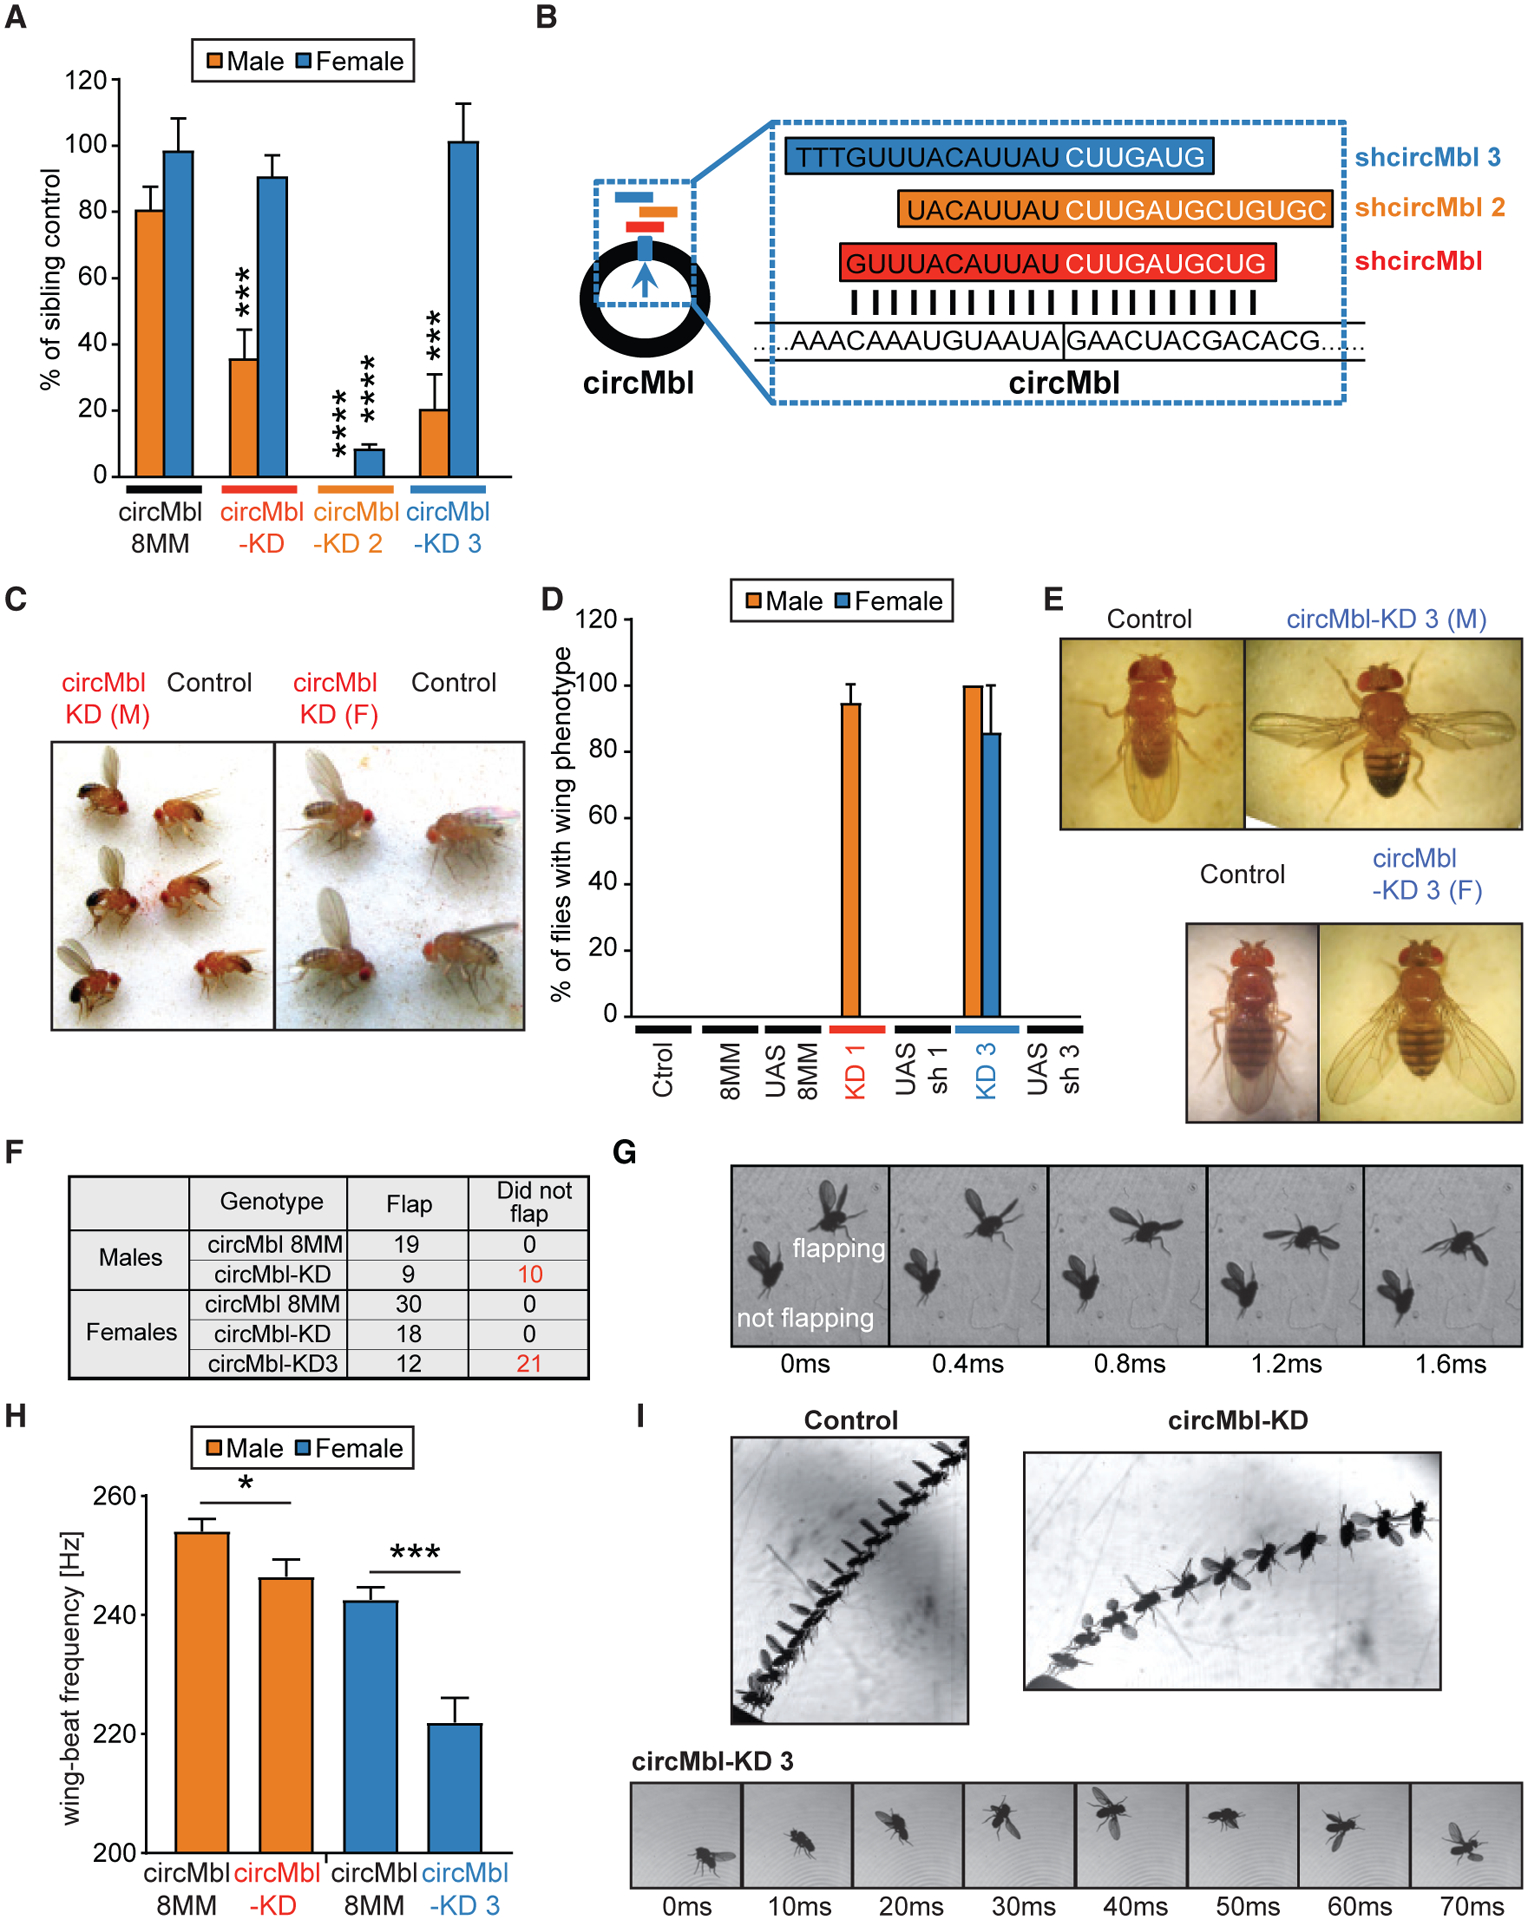
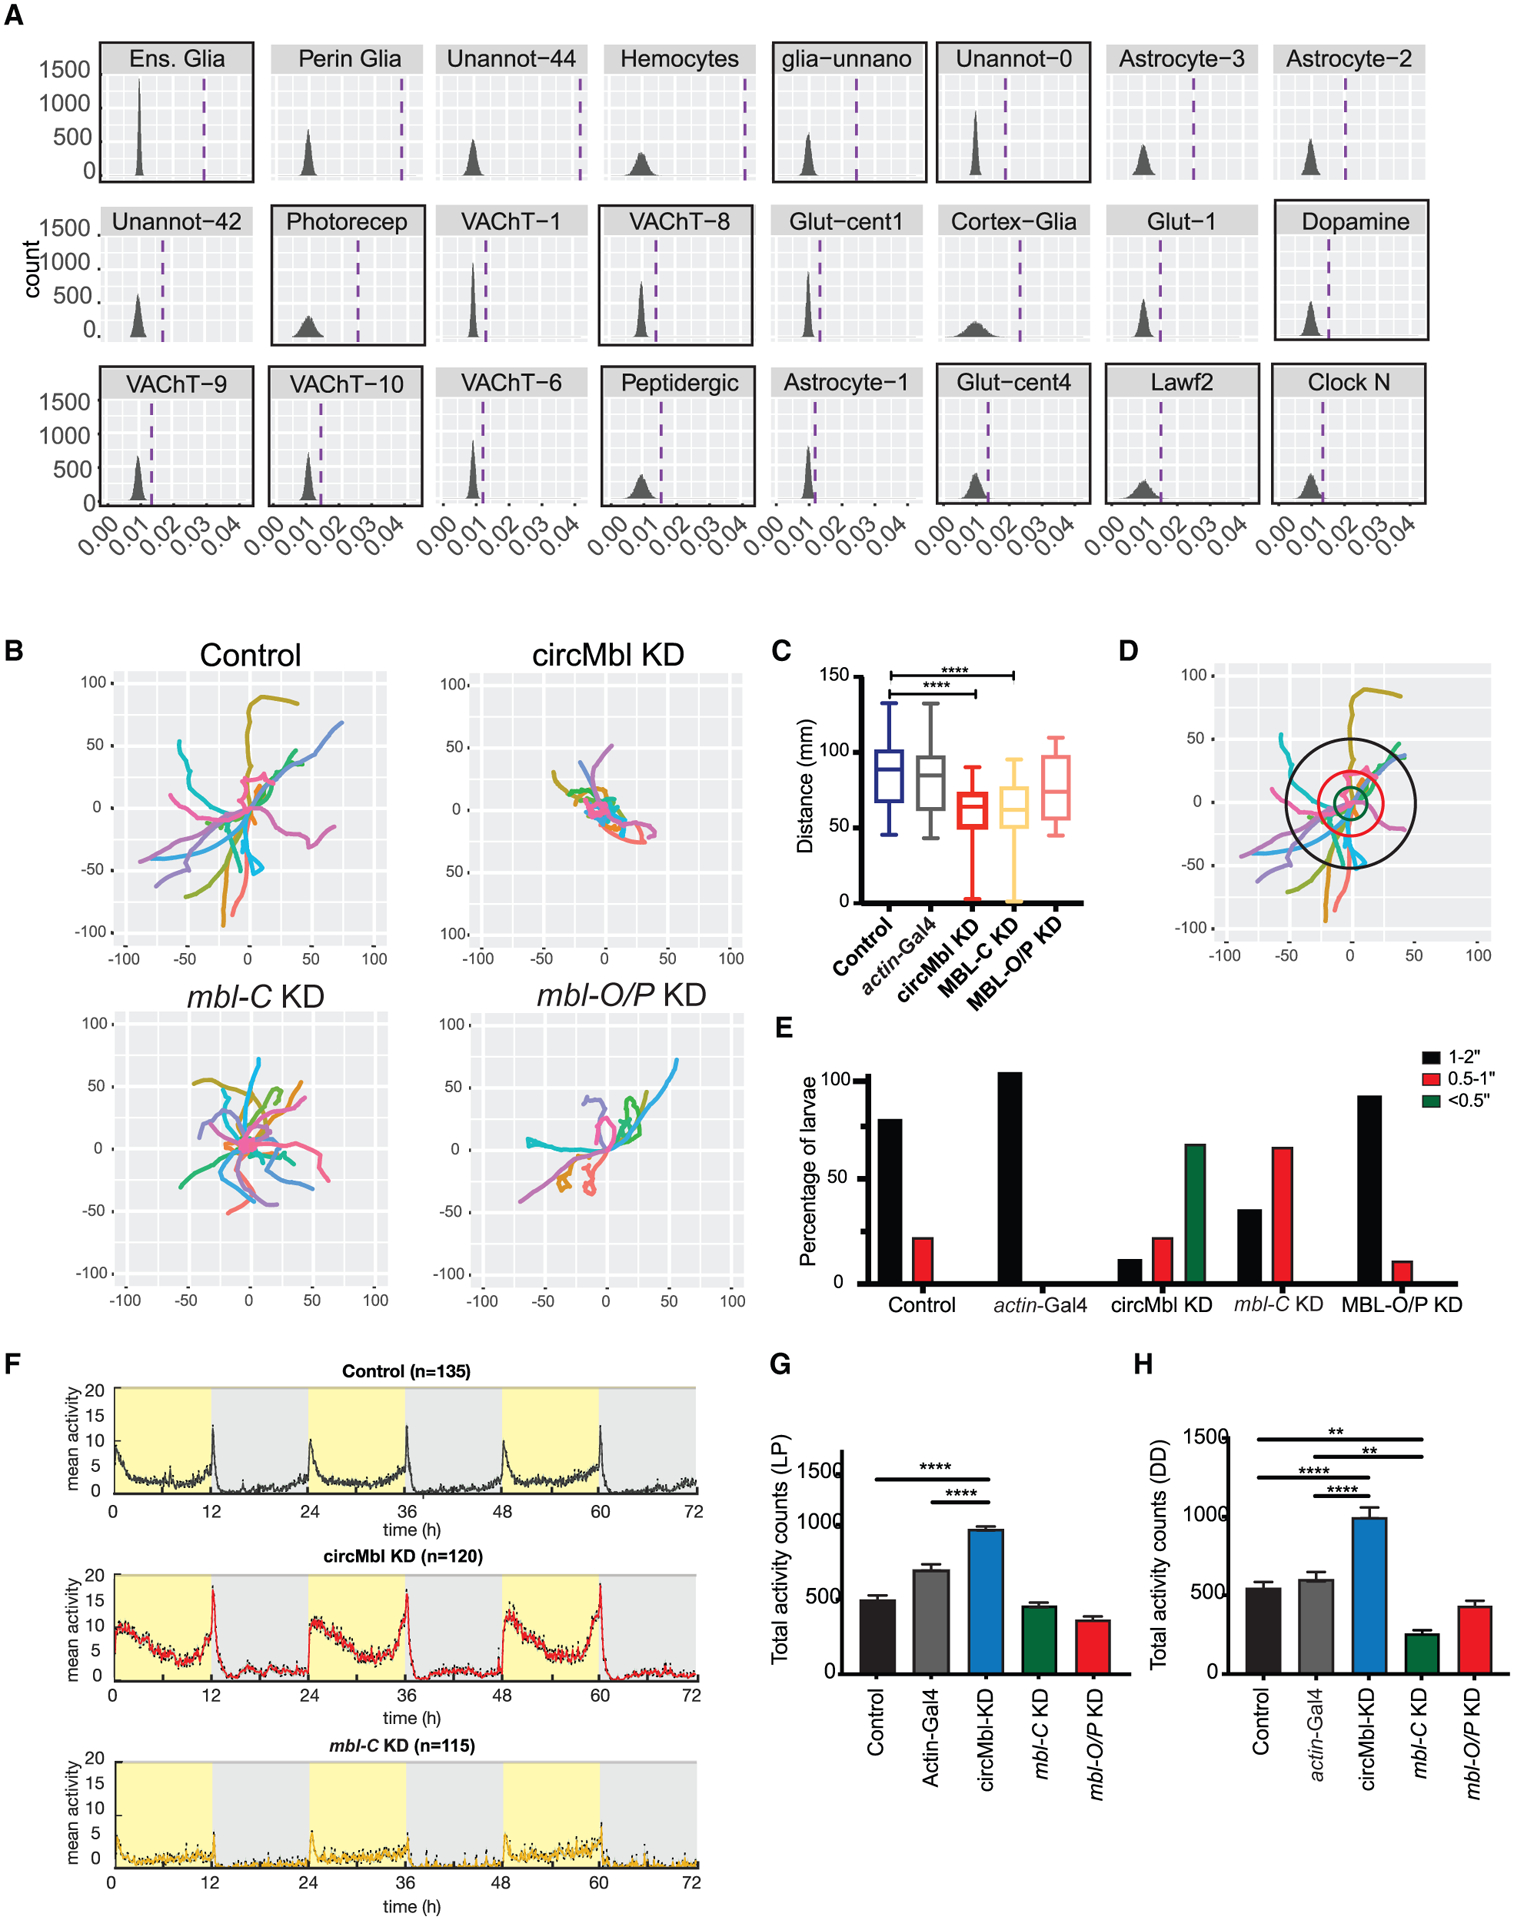
Muscleblind (mbl) is an essential muscle and neuronal splicing regulator. Mbl hosts multiple circular RNAs (circRNAs), including circMbl, which is conserved from flies to humans. Here, we show that mbl-derived circRNAs are key regulators of MBL by cis- and trans-acting mechanisms. By generating fly lines to specifically modulate the levels of all mbl RNA isoforms, including circMbl, we demonstrate that the two major mbl protein isoforms, MBL-O/P and MBL-C, buffer their own levels by producing different types of circRNA isoforms in the eye and fly brain, respectively. Moreover, we show that circMbl has unique functions in trans, as knockdown of circMbl results in specific morphological and physiological phenotypes. In addition, depletion of MBL-C or circMbl results in opposite behavioral phenotypes, showing that they also regulate each other in trans. Together, our results illuminate key aspects of mbl regulation and uncover cis and trans functions of circMbl in vivo.

Keywords: CP: Molecular biology; Drosophila; MBNL; RNA metabolism; circMbl; circRNA; muscleblind; splicing.


Conflict of interest statement

Declaration of interests The authors declare no competing interests.

Figures

Figure 1.
Figure 1.. The mbl locus generates several RNA and protein isoforms
(A) Upper: schematic representation of mbl locus. Bottom left: nanopore RNA-seq reads from three distinct promoter regions. Bottom right: ribosome footprinting data. Sashimi plots show the different mbl isoforms 3′ annotation. (B) Scheme of the protein domains in the different MBL isoforms. Red boxes indicate zinc fingers. Yellow boxes indicate intrinsically disordered regions. (C) Western blot showing MBL-C and MBL-O/P protein isoforms (blue arrows); membrane was blotted using anti-MBL. Asterisk denotes non-specific band (based on the fact that none of the shRNAs or the available KK RNAi line affected the band consistently and that the band is not labeled when performing a western blot in an endogenously FLAG-tag MBL fly [Michela Zaffagni, personal communication]). (D) shRNAs used to knock down mbl-C and mbl-O/P isoforms either independently or together. (E and F). qRT-PCR (top) and western blot (bottom) from heads of KD for mbl-C (E) or mbl-O/P (F) isoform. Arrow indicates the MBL-C or MBL-O/P bands. (G) qRT-PCR of rp49, tim, and mbl isoform expression levels in fly brain and heads. (H) mbl-C and mbl-O/P mean expression in total RNA-seq data from sorted cells (n = 2, data from Davis et al., 2020). Each circle represents a cell type. In all qRT-PCR analyses, tubulin was used as normalization control (n = 3, standard error of the mean [SEM], two-tailed t test performed for significant difference: ****p < 0.0001, ***p < 0.0002, **p < 0.0021, *p < 0.0332). In all western blot images, the quantification of MBL isoforms is stated below the images.
Figure 2.
Figure 2.. Levels of circMbl and mbl in the fly brain
(A) Left: integrative genome viewer (IGV) snapshot of mbl exon 2 aligned reads from bulk 3′ RNA-seq and single-cell 10X RNA-seq. Right: circMbl scheme. Marked in squares are the polyA stretches. (B) Heatmap of mean circMbl normalized expression in each single-cell cluster. (C) Pie charts with proportion of cells with mbl exon 2 and/or mbl-C/O/P UTR signal. (D) Top: dot plot of mbl exon 2 versus mbl-C/O/P normalized expression in single cells from Lawf2 and Lawf1 neuronal clusters. Bottom: proportion of cells expressing one, both, or no mbl exon 2 and mbl-C/OP. (E) Heatmap of normalized expression for the different circMbl isoforms and mbl-O/P in sorted cells. (F) Single-cell cluster mean circMbl versus mbl-C/O/P UTR normalized expression. Color represents UMIs/genes ratio.
Figure 3.
Figure 3.. mbl-C and circMbl regulate each other in cis
(A and B) qRT-PCR of the indicated targets in mbl-C-OE fly brains. (C) Scheme of the primer sets used to quantify the mbl locus expression. (D) qRT-PCR of mbl-O/P and mbl-C/O/P in mbl-C-OE fly brain. (E) qRT-PCR of the indicated targets in mbl-C-KD fly heads. (F and G) qRT-PCR of circMbl in heads of mbl-O/P (F) and UTR-KD flies (G). (H) mbl-C and circMbl expression levels correlation plot in various mbl isoform KD flies. In all cases tubulin was used as a normalization control (n = 3, error bars represent SEM, two-tailed t test performed for significant difference: ****p < 0.0001, ***p < 0.0002, **p < 0.0021, *p < 0.0332).
Figure 4.
Figure 4.. MBL-O/P regulates its own production by two different mechanisms
(A) qRT-PCR of circMbl isoforms in mbl-O/P-KD fly heads. (B) qRT-PCR of circMbl isoforms fold change in mbl-O/P transgenic fly heads. (C) qRT-PCR of pre-mbl in MBL-O/P-OE fly heads. (D) qRT-PCR evaluation of the levels of preRNA in mbl-O/P and Exon1-KD fly heads. (E) mbl-O/P and preMbl (Ex2-In2) expression levels correlation plot in various mbl isoforms KD flies. (F) qRT-PCR in mbl-O/P and -C-OE fly heads. (G) Representation of MBL-C and MBL-O/P regulation in cis by circMbl isoforms in different tissues. In the brain (green), MBL-C binds to pre-mRNA in order to facilitate backsplicing (as described in Ashwal-Fluss et al., 2014). In the eye, MBL-O/P regulates its own levels by two different mechanisms: inhibiting the splicing of the first and second introns (red inhibition symbols) and promoting backsplicing (dashed violet lines). Tubulin was used as a normalization control (n = 3, error bars represent SEM, two-tailed t test performed for significant difference: ****p < 0.0001, ***p < 0.0002, **p < 0.0021, *p < 0.0332).
Figure 5.
Figure 5.. circMbl can be specifically downregulated in vivo
(A) IGV snapshot, showing a specific reduction of exon 2 in respect to a control strain. (B and C) Quantification of the indicated mbl regions from total (B) and poly(A+) (C) RNA-seq data (n = 3, error bars represent SEM, two-tailed t test performed for significant difference: ****p < 0.0001, ***p < 0.0002, **p < 0.0021, *p < 0.0332). (D) Western blot of control and circMbl-KD flies using anti-MBL immunosera. (E) Assessment of off-targets by Sylamer. Traces show the seed enrichment for the genes differentially expressed upon downregulation of circMbl. shRNA and shRNA* seed sequences shown in blue and red, respectively. (F) General binding of mRNAs to AGO1 in shRNA and control line. (G) Sylamer enrichment landscape plot for sh-circMbl and sh-circMbl* 6-mers. The x axis represents the genes sorted from the most to the least enriched in the AGO1 immunoprecipitation (IP) sequencing. INP, input.
Figure 6.
Figure 6.. Knockdown of circMbl provokes specific phenotypes
(A) Viability of males and females from control and circMbl-KD lines. We plotted the percentage of males and females of the indicated genotype against the sibling controls. The plotted results are the average of eight independent experiments for circMbl-KD flies and seven for the rest of the strains (comparison of KD lines with controls of same sex, Student’s t test: ***p < 0.0005, ****p < 0.0001). (B) Scheme of the shRNAs against circMbl. (C) Representative picture of circMbl-KD males with “wings up” reared at 25°C (left) or females (right) reared at 29°C next to control flies (actin-Gal4). (D) Percentage of wing phenotype in circMbl-KD lines and its control flies. We plotted the percentage of males and females presenting wings up (circMbl-KD) or open (circMbl-KD3) phenotypes for the indicated genotypes. The plotted results are the average of eight independent experiments for circMbl-KD flies and seven for the other strains (error bars represent SEM, two-tailed t test performed for significant difference: ****p < 0.0001, ***p < 0.0002, **p < 0.0021, *p < 0.0332). (E) Representative pictures of circMbl-KD3 males (top right) and females (bottom right) next to controls (actin-Gal4 flies). (F) Results of the tapping assay. (G) A sequence of side-view images from the tapping assay taken 0.4 ms apart. Images show two male circMbl-KD flies falling side by side. (H) Mean wing-beat frequency in the free-flight assay. We measured ~30 flies from first three lines and 12 flies from the circMbl-KD3 (n = 25/32/29/12; Student’s t test: *p < 0.05, ***p < 0.0005). (I) Representative flight events from the free-flight assay. Top left: a control male taking off normally. Superposed images are shown every 4 ms. Top right: a male circMbl-KD fly taking off. Superposed images are shown every 6 ms. Bottom: a female circMbl-KD3 fly shown shortly after take-off. Images are shown every 10 ms.
Figure 7.
Figure 7.. Knockdown of circMbl and MBL-C results in locomotor defects
(A) Single-cell clusters with significant enrichment for genes differentially expressed in circMbl-KD brains. Dashed lines denote mean gene set enrichment in each cluster. Clusters with high levels of circMbl are highlighted with black squares. (B) Path covered in larval assay for the indicated flies. (C) Total distance (mm) traveled by each larva (three independent replicas, control n = 32, circMbl-KD n = 26, MBL-C-KD n = 32, MBL-O/P-KD n = 32). Boxplot shows mean, interquartile, and extreme values (two-tailed t test performed for significant difference: ****p < 0.0001, ***p < 0.0002, **p < 0.0021, *p < 0.0332). (D) Representation of the analysis of the movement of control (8MM) larvae. The concentric circles are at distance of <0.5 inch (green), 0.5–1 inch (red), and 1–2 inches (black). (E) Percentage of larvae that cross each of the concentric circles described in (D) (three independent experiments, number of larvae per experiment >10 when possible). (F) Average activity over 3 days in 12:12 LD at 25°C. Light phase is represented in yellow and dark phase in gray (five independent replicas, control n = 135, circMbl-KD n = 120, MBL-C-KD n = 115, MBL-O/P-KD n = 96). (G and H) Total activity during the light period in LD (G) and total activity over 5 days in complete darkness (DD) (H). Asterisks represent statistical significance relative to 8MM and Actin-Gal4 controls calculated by one-way ANOVA and Tukey’s multiple comparisons test (****p < 0.0001, **p < 0.005).

Similar articles

Cited by

References

    1. Aktas T, Avsar Ilik I, Maticzka D, Bhardwaj V, Pessoa Rodrigues C, Mittler G, Manke T, Backofen R, and Akhtar A (2017). DHX9 suppresses RNA processing defects originating from the Alu invasion of the human genome. Nature 544, 115–119. 10.1038/nature21715. - DOI - PubMed
    1. Alexa A, and Rahnenfuhrer J (2021). topGO: Enrichment analysis for Gene Ontology. R package version 2.10.0.
    1. Anders S, Reyes A, and Huber W (2012). Detecting differential usage of exons from RNA-seq data. Genome Res. 22, 2008–2017. 10.1101/gr.133744.111. - DOI - PMC - PubMed
    1. Artero R, Prokop A, Paricio N, Begemann G, Pueyo I, Mlodzik M, Perez-Alonso M, and Baylies MK (1998). The muscleblind gene participates in the organization of Z-bands and epidermal attachments of Drosophila muscles and is regulated by Dmef2. Dev. Biol 195, 131–143. 10.1006/dbio.1997.8833. - DOI - PubMed
    1. Ashwal-Fluss R, Meyer M, Pamudurti NR, Ivanov A, Bartok O, Hanan M, Evantal N, Memczak S, Rajewsky N, and Kadener S (2014). circRNA biogenesis competes with pre-mRNA splicing. Mol. Cell 56, 55–66. 10.1016/j.molcel.2014.08.019. - DOI - PubMed

Publication types

LinkOut - more resources