. 2022 Apr 26;39(4):110751.
doi: 10.1016/j.celrep.2022.110751.

An increase in spontaneous activity mediates visual habituation

Affiliations

An increase in spontaneous activity mediates visual habituation

Jae-Eun Kang Miller et al. Cell Rep. .

Abstract

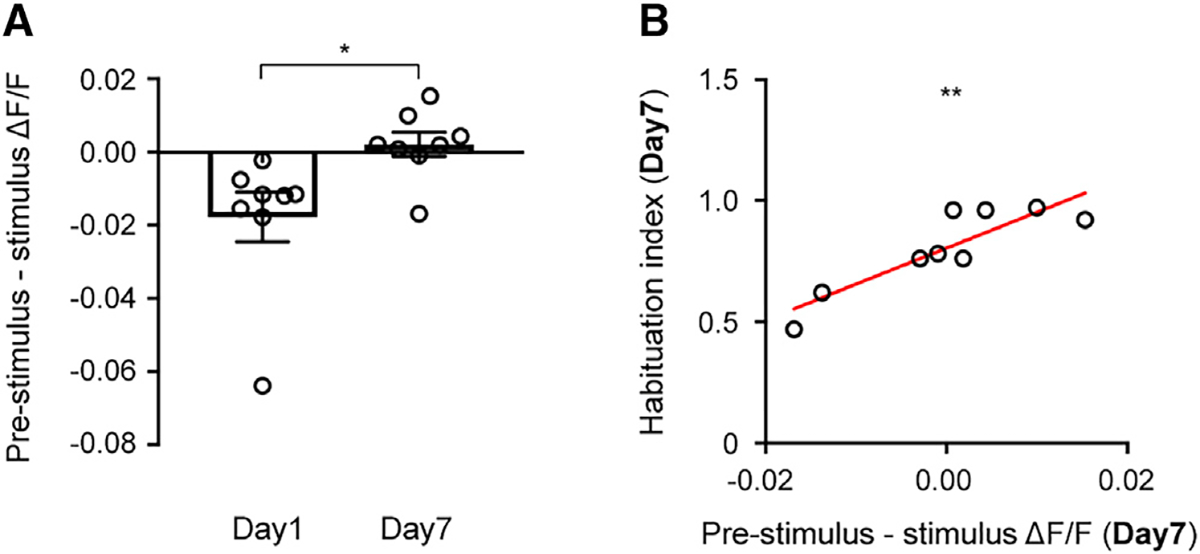
The cerebral cortex is spontaneously active, but the function of this ongoing activity remains unclear. To test whether spontaneous activity encodes learned experiences, we measured the response of neuronal populations in mouse primary visual cortex with chronic two-photon calcium imaging during visual habituation to a specific oriented stimulus. We find that, during habituation, spontaneous activity increases in neurons across the full range of orientation selectivity, eventually matching that of evoked levels. This increase in spontaneous activity robustly correlates with the degree of habituation. Moreover, boosting spontaneous activity with two-photon optogenetic stimulation to the levels of visually evoked activity accelerates habituation. Our study shows that cortical spontaneous activity is linked to habituation, and we propose that habituation unfolds by minimizing the difference between spontaneous and stimulus-evoked activity levels. We conclude that baseline spontaneous activity could gate incoming sensory information to the cortex based on the learned experience of the animal.

Keywords: CP: Neuroscience; V1; intrinsic activity; mouse; ongoing activity; perceptual learning; visual memory; visual recognition.


Conflict of interest statement

Declaration of interests The authors declare no competing interests.

Figures

Figure 1.
Figure 1.. Mice behaviorally habituate to drifting oriented gratings
(A) Illustration of a head-fixed awake chronic two-photon imaging setup. Mice were presented with drifting gratings, and their running speed was recorded by a photodiode. Note that the tapes on the wheel, which were shown here for visual clarity, were only present at the bottom of the wheel. (B) Visual stimulation protocol. Mice became accustomed to head fixation for 3 days while being presented with a gray screen for 30 min. Over the next 7 days, mice were presented with five trials of drifting gratings with a single orientation daily for 10 min. One orientation was randomly selected for each mouse. In a control group, drifting gratings with the same orientation as the habituation group were presented on day 1 and day 7, but from day 2 to day 6, drifting gratings with different orientations were presented in a random order each day. (C) Example of animal’s running speed during 30 s of pre-stimulus and 100 s of visual stimulus periods averaged over five trials from day 1 through day 7 (see Figure S1 for the details of calculating running speed). Red area indicates the 10-s window that is used to calculate stimulus-induced running (see Figure S1). (D) Example of running speed from a control mouse. (E) Running habituates in habituation group, but not control group. Running speed was normalized by day 1 running speed in each mouse (see Figure S2 for raw running speed). n = 14 mice for habituation group; n = 11 mice for control group; *p = 0.004, **p = 0.015, and ***p = 0.0004 by two-way ANOVA with Sidak’s multiple comparisons test. (F) Habituation index was calculated from normalized running speed (habituation index = [normalized running speed on day 1] − [normalized running speed on day N]). *p = 0.004, **p = 0.015, and ***p = 0.0004 by two-way ANOVA with Sidak’s multiple comparisons test. Data are presented as mean + SEM.
Figure 2.
Figure 2.. Habituation increases spontaneous activity
(A and B) Top: raster plots of neuronal activity from the same 125 neurons during pre-trial, pre-stimulus, and visual stimulus periods on (A) day 1 and (B) day 7.Bottom: examples of ΔF/F traces on (A) day 1 and (B) day 7 are shown. See Figure S8 for example of ΔF/F traces on days 1, 3, 5, and 7. (C) Mean ΔF/F of population during pre-stimulus and visual stimulus periods on day 1 and day 7. n = 7 mice; *p = 0.041; **p = 0.007 by one-way ANOVA with Tukey’s multiple comparisons test. (D) A comparison of mean ΔF/F of single cells during visual stimulus periods on day 1 and day 7. n = 530 cells from 7 mice. (E) A comparison of mean ΔF/F of single cells during pre-stimulus periods on day 1 and day 7. Red elliptical highlights the cells with significantly increased pre-stimulus ΔF/F on day 7. n = 530 cells from 7 mice. (F) Mean ΔF/F of population during pre-trial period on day 1 and day 7. n = 7 mice; **p = 0.009 by paired t test. (G) Percentage of cells per animal that significantly increase pre-stimulus ΔF/F on day 7, compared with day 1 (defined as pre-stimulus cells). Data are presented as mean ± SD. (H) Distributions of preferred orientations of pre-stimulus cells and the other cells. n = 7 mice; p = 0.36 by two-way ANOVA with Sidak’s multiple comparisons test. Data are presented as mean + SEM.
Figure 3.
Figure 3.. Habituation correlates with a reduction in the difference between mean pre-stimulus and stimulus-induced activity
(A) Mean population ΔF/F during the pre-stimulus period subtracted by mean population ΔF/F during the stimulus period on day 1 and day 7; *p = 0.03 by paired t test. (B) Mean population ΔF/F during pre-stimulus period subtracted by mean population ΔF/F during stimulus period on day 7 significantly correlated with habituation index on day 7. r = 0.87; n = 9 mice; **p = 0.002 by Pearson’s correlation coefficient. Data are presented as mean + SEM.
Figure 4.
Figure 4.. Increasing pre-visual stimulus activity accelerates habituation
(A) Illustration of a head-fixed setup with simultaneous two-photon imaging and two-photon optogenetic stimulation. (B) Mice became accustomed to head fixation for 3 days while being presented with gray screen. Over the next 4 days, mice were presented with five trials of drifting gratings with a single orientation daily as described in Figure 1. In addition, two-photon optogenetic stimulation was performed during pre-trial and pre-stimulus periods. Calcium signals were recorded simultaneously. (C) Mean % increase in population ΔF/F during pre-visual stimulus period on day 1 and day 3 of optogenetic stimulation, compared with the baseline population ΔF/F in the absence of optogenetic stimulation on day 1. The red line indicates mean % increase in population ΔF/F during pre-visual stimulus period on day 7 of natural habituation. n = 7 mice for both groups; *p = 0.027 by paired t test. (D) Habituation index on day 1 and day 3 of optogenetic stimulation. The red line indicates habituation index on day 7 of natural habituation. n = 7 mice for both groups; ***p = 0.0009 by paired t test. (E) Mean population ΔF/F during pre-visual stimulus period subtracted by mean population ΔF/F during visual stimulus period on day 3 was significantly correlated with habituation index on day 3 after optogenetic stimulation. r = 0.77; n = 7 mice; *p = 0.022 by Pearson’s correlation coefficient. (F) A proposed model illustrating the role of spontaneous activity in visual habituation. When an animal is exposed to a visual stimulusfor the first time, a sharp stimulus-induced increase in neuronal activity above baseline leads to behavioral response. After repeated exposure to the visual stimulus, spontaneous activity increases (red arrow). As a result, stimulus-induced neuronal activity relative to pre-visual stimulus activity is reduced, and this results in a reduced behavioral response. Data are presented as mean ± SEM.

References

    1. Berger H (1929). Über das Elektrenkephalogramm des Menschen. Archiv für Psychiatrie und Nervenkrankheiten 87, 527–570.
    1. Berkes P, Orban G, Lengyel M, and Fiser J (2011). Spontaneous cortical activity reveals hallmarks of an optimal internal model of the environment. Science 331, 83–87. - PMC - PubMed
    1. Brainard DH (1997). The psychophysics toolbox. Spat. Vis 10, 433–436. - PubMed
    1. Carrillo-Reid L, Miller JE, Hamm JP, Jackson J, and Yuste R (2015). Endogenous sequential cortical activity evoked by visual stimuli. J. Neurosci 35, 8813–8828. - PMC - PubMed
    1. Carrillo-Reid L, Yang W, Bando Y, Peterka DS, and Yuste R (2016). Imprinting and recalling cortical ensembles. Science 353, 691–694. - PMC - PubMed

Publication types

LinkOut - more resources