. 2022 Apr 26;39(4):110744.
doi: 10.1016/j.celrep.2022.110744.

Characterization and functional interrogation of the SARS-CoV-2 RNA interactome

Affiliations

Characterization and functional interrogation of the SARS-CoV-2 RNA interactome

Athéna Labeau et al. Cell Rep. .

Abstract

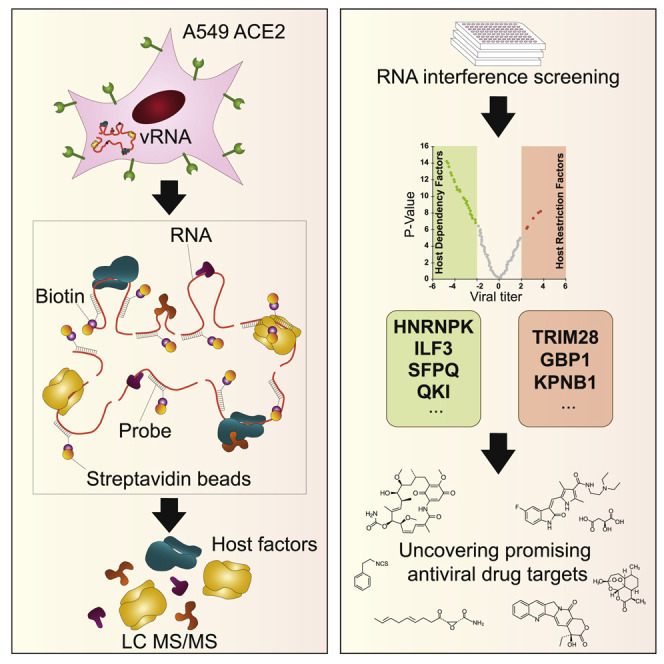
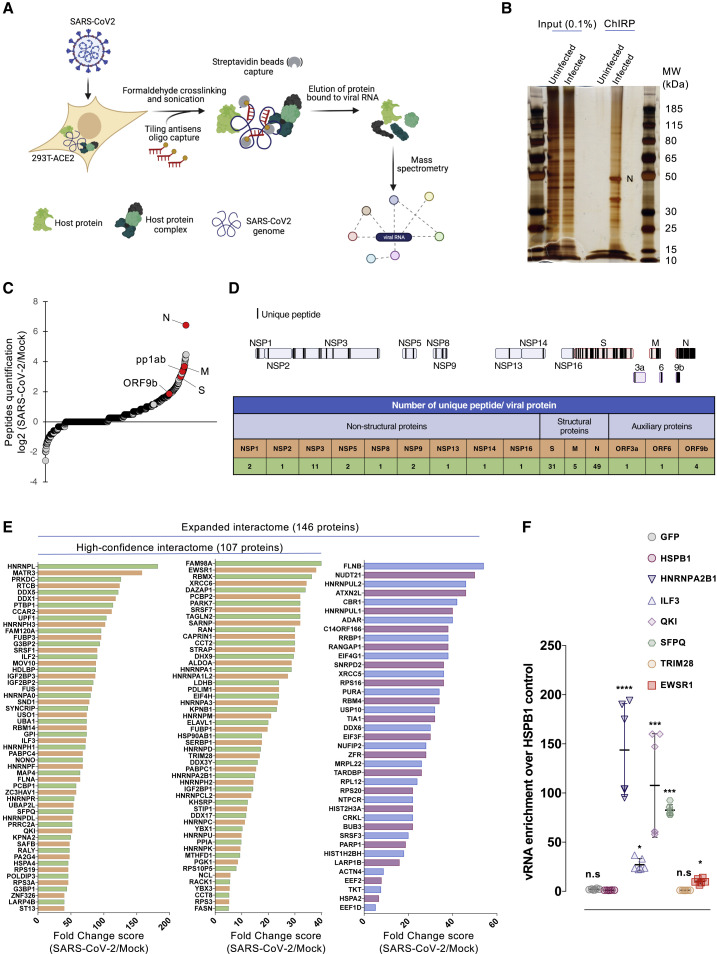
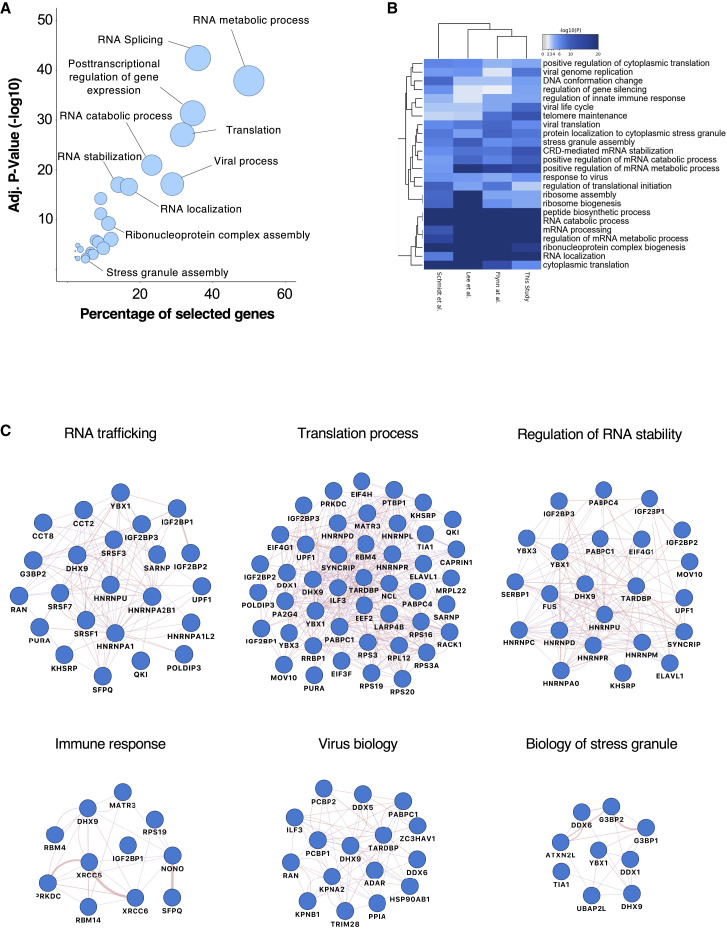
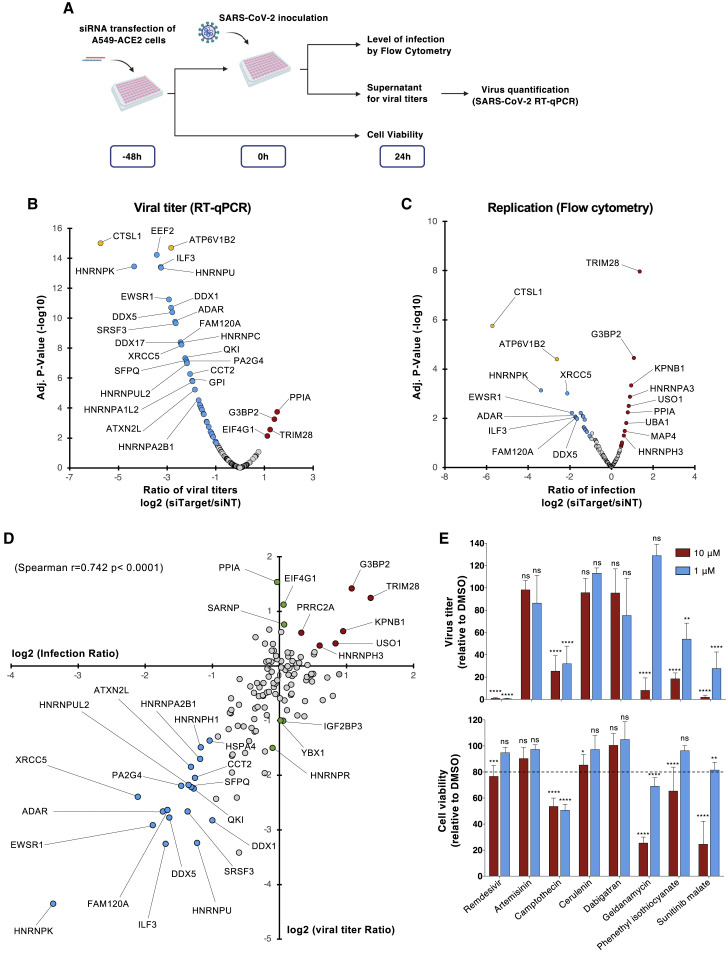
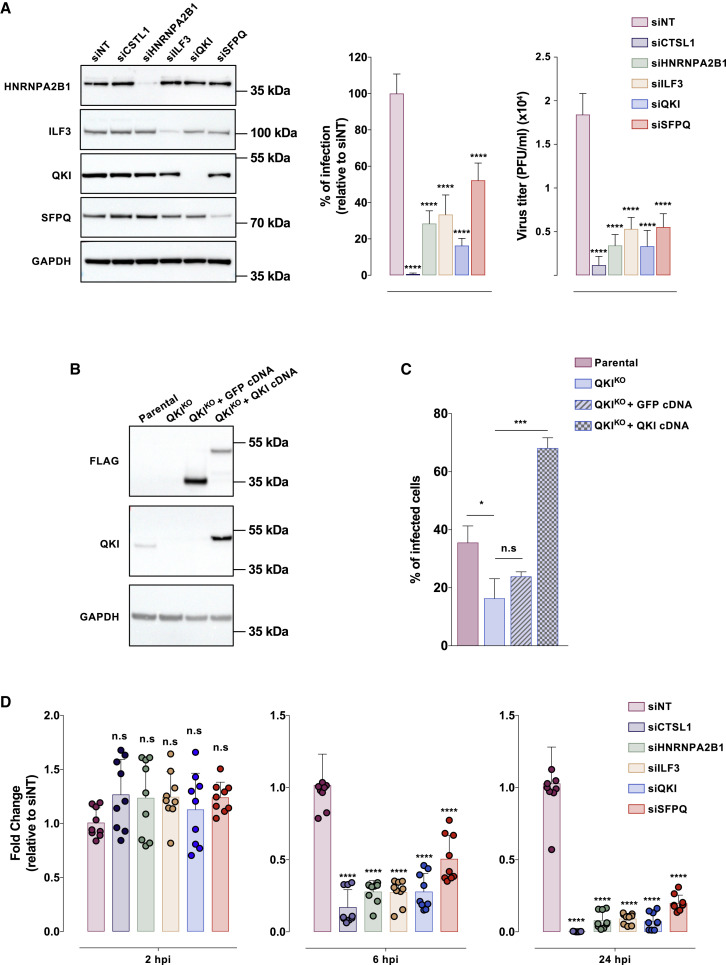
Severe acute respiratory syndrome coronavirus 2 (SARS-CoV-2) is the causative agent of the COVID-19 pandemic, which has led to a devastating global health crisis. The emergence of variants that escape neutralizing responses emphasizes the urgent need to deepen our understanding of SARS-CoV-2 biology. Using a comprehensive identification of RNA-binding proteins (RBPs) by mass spectrometry (ChIRP-MS) approach, we identify 107 high-confidence cellular factors that interact with the SARS-CoV-2 genome during infection. By systematically knocking down their expression in human lung epithelial cells, we find that the majority of the identified RBPs are SARS-CoV-2 proviral factors. In particular, we show that HNRNPA2B1, ILF3, QKI, and SFPQ interact with the SARS-CoV-2 genome and promote viral RNA amplification. Our study provides valuable resources for future investigations into the mechanisms of SARS-CoV-2 replication and the identification of host-centered antiviral therapies.

Keywords: CP: Microbiology; SARS-CoV-2 RNA interactome; SARS-CoV-2 infection inhibitors; comprehensive identification of RNA binding proteins by mass spectrometry, ChIRP-MS; host RNA binding proteins; host-dependency factors; severe acute respiratory syndrome coronavirus 2; siRNA screen.


Conflict of interest statement

Declaration of interests The authors declare no competing interests.

Figures

None
Graphical abstract
Figure 1
Figure 1
Purification of the SARS-CoV-2 RNA interactome (A) Schematic illustrating the ChIRP-MS approach used to identify host factors bound to SARS-CoV-2 RNA. (B) Proteins enriched by ChIRP from uninfected and SARS-CoV-2-infected cells were resolved by SDS-PAGE and visualized by silver staining. (C) Quantification of the peptides ratio as the average of peptides count for a prey in SARS-CoV-2 divided by the average peptides count for the same prey in the control (zero counts are replaced by 1). Viral proteins are marked by red circles (n = 5 biological replicates). (D) Top: Schematic representing unique peptide distribution along the enriched viral proteins. Bottom: Table showing the number of unique peptides for each viral protein. Data from 1 representative biological replicate are shown. (E) Fold change (FC; SAINTexpress FC score) of the high-confidence and the expanded interactomes identified in our SARS-CoV-2 ChIRP-MS. (F) vRIP assays in 293T-ACE2 cells transfected with plasmid encoding the indicated proteins bearing a hemagglutinin (HA) or FLAG tag and infected with SARS CoV-2. FLAG-HSPB1 and FLAG-GFP were used as negative controls. Enrichment of immunoprecipitated vRNA was calculated as 2(−ΔΔCt [normalized RIP/normalized HSPB1]. The data shown are means ± SDs of 2 biological replicates (with technical duplicates). Adjusted p values were calculated by the Kruskal-Wallis test with Benjamini, Krieger, and Yekutieli correction (n.s, non-significant; p < 0.05, ∗∗∗p < 0.001, and ∗∗∗∗p < 0.0001).
Figure 2
Figure 2
Biological analysis of the SARS-CoV-2 RNA interactome (A) GO enrichment analysis of SARS-CoV-2 RNA interactome proteins. Circles represent the enriched function for an annotated ontology term and circle size corresponds to the number of enriched proteins within that term. (B) Heatmap of shared GO:biological processes enriched across all SARS-CoV-2 RNA interactomes. Horizontally, biological functions have been clustered according to their enrichment significance among cohorts. Vertically, cohorts have been clustered according to their functional enrichment similarities. (C) Selected biological process networks of SARS-CoV-2 interactome proteins.
Figure 3
Figure 3
Functional interrogation of the SARS-CoV-2 RNA interactome and compounds screening (A) Schematic illustrating the loss-of-function screen procedure. (B and C) A549-ACE2 cells were transfected with an arrayed siRNA library and challenged with SARS-CoV-2 (MOI 0.05) for 24 h. (B) Yield of viral particles released in the supernatant of infected cells was quantified by qRT-PCR and normalized to the siNT-transfected cells. The data shown are the means of 2 biological replicates (with technical duplicates). (C) Viral replication was assessed by flow cytometry using anti-N protein monoclonal antibody (mAb) and normalized to the siNT-transfected cells. The data shown are the means of 2 biological replicates (with technical duplicates). Adjusted p values were calculated by 1-way ANOVA with Benjamini and Hochberg correction. Host dependency factors are marked in blue and host restriction factors in are marked in red. Positive controls (CTSL1 and ATP6V1B2) are highlighted in yellow. (D) Intersection of the data obtained from N protein quantification by flow cytometry and viruses released in the supernatant of infected cells by qRT-PCR. The data shown are the means of 2 biological replicates (with technical duplicates). Host dependency factors are marked in blue and host restriction factors are marked in red. (E) A549-ACE2 were infected with SARS-CoV-2 (MOI 0.05) in the continuous presence of compounds (10 and 1 μM). Viruses released in supernatant were quantified 24 hpi by qRT-PCR (top panel). Cell viability was assessed in parallel (bottom panel). The data shown are the means ± SDs of 3 biological replicates (with technical duplicates). Significance was calculated using a 2-way ANOVA statistical test with Dunnett’s multiple comparisons test (n.s, not significant; ∗∗p < 0.01, ∗∗∗p < 0.001, ∗∗∗∗p < 0.0001).
Figure 4
Figure 4
HNRNPA2B1, ILF3, QKI, and SFPQ mediate SARS-CoV-2 replication (A) A549-ACE2 cells were reverse transfected with the indicated siRNA pool. In 48 h, protein knockdown was ascertained by western blot (left panel) and cells were challenged with SARS-CoV-2 (MOI 0.01) for 24 h. Viral replication was assessed by flow cytometry using anti-N protein mAb and normalized to the siNT-transfected cells (center panel); the yield of viral particles released in the supernatant of infected cells was quantified by qRT-PCR (right panel). The data shown are the means ± SDs of 3 biological replicates (with technical triplicates). Significance was calculated using 1-way ANOVA statistical test with Dunnett’s multiple comparisons test. (B) Immunoblot with anti-FLAG or anti-QKI mAb in parental, QKIKO A549-ACE2 cells, and QKIKO cells trans-complemented with GFP or QKI cDNA. (C) Indicated cells were inoculated with SARS-CoV-2 (MOI 0.01). Infection was quantified 24 h later by flow cytometry using anti-N protein mAb. The data shown are the means ± SDs of 3 biological replicates (with technical duplicates). Significance was calculated by the Kruskal-Wallis test with Dunnett’s multiple comparisons test. (D) A549-ACE2 cells were treated as in (A). At the indicated time points, cells were treated with trypsin to remove cell surface-bound viral particles and viral RNA was quantified by qRT-PCR. The data shown are the means ± SDs of 3 biological replicates (with technical triplicates). The p values were calculated by 1-way ANOVA with Dunnett’s multiple comparisons test (n.s, non-significant; p < 0.05, ∗∗∗p < 0.001, ∗∗∗∗p < 0.0001).

References

    1. Banerjee A.K., Blanco M.R., Bruce E.A., Honson D.D., Chen L.M., Chow A., Bhat P., Ollikainen N., Quinodoz S.A., Loney C., et al. SARS-CoV-2 disrupts splicing, translation, and protein trafficking to suppress host defenses. Cell. 2020;183:1325–1339.e21. - PMC - PubMed
    1. Bell J.L., Wächter K., Mühleck B., Pazaitis N., Köhn M., Lederer M., Hüttelmaier S. Insulin-like growth factor 2 mRNA-binding proteins (IGF2BPs): post-transcriptional drivers of cancer progression? Cell Mol. Life Sci. 2013;70:2657–2675. - PMC - PubMed
    1. Bindea G., Mlecnik B., Hackl H., Charoentong P., Tosolini M., Kirilovsky A., Fridman W.-H., Pagès F., Trajanoski Z., Galon J. ClueGO: a Cytoscape plug-in to decipher functionally grouped gene ontology and pathway annotation networks. Bioinformatics. 2009;25:1091–1093. - PMC - PubMed
    1. Cabrita L.D., Cassaignau A.M.E., Launay H.M.M., Waudby C.A., Wlodarski T., Camilloni C., Karyadi M.-E., Robertson A.L., Wang X., Wentink A.S., et al. A structural ensemble of a ribosome–nascent chain complex during cotranslational protein folding. Nat. Struct. Mol. Biol. 2016;23:278–285. - PMC - PubMed
    1. Cele S., Gazy I., Jackson L., Hwa S.-H., Tegally H., Lustig G., Giandhari J., Pillay S., Wilkinson E., Naidoo Y., et al. Escape of SARS-CoV-2 501Y.V2 from neutralization by convalescent plasma. Nature. 2021;593:142–146. - PMC - PubMed

Publication types