. 2022 Jun;606(7913):358-367.
doi: 10.1038/s41586-022-04769-z. Epub 2022 Apr 27.

ABO genotype alters the gut microbiota by regulating GalNAc levels in pigs

Affiliations

ABO genotype alters the gut microbiota by regulating GalNAc levels in pigs

Hui Yang et al. Nature. 2022 Jun.

Abstract

The composition of the intestinal microbiome varies considerably between individuals and is correlated with health1. Understanding the extent to which, and how, host genetics contributes to this variation is essential yet has proved to be difficult, as few associations have been replicated, particularly in humans2. Here we study the effect of host genotype on the composition of the intestinal microbiota in a large mosaic pig population. We show that, under conditions of exacerbated genetic diversity and environmental uniformity, microbiota composition and the abundance of specific taxa are heritable. We map a quantitative trait locus affecting the abundance of Erysipelotrichaceae species and show that it is caused by a 2.3 kb deletion in the gene encoding N-acetyl-galactosaminyl-transferase that underpins the ABO blood group in humans. We show that this deletion is a ≥3.5-million-year-old trans-species polymorphism under balancing selection. We demonstrate that it decreases the concentrations of N-acetyl-galactosamine in the gut, and thereby reduces the abundance of Erysipelotrichaceae that can import and catabolize N-acetyl-galactosamine. Our results provide very strong evidence for an effect of the host genotype on the abundance of specific bacteria in the intestine combined with insights into the molecular mechanisms that underpin this association. Our data pave the way towards identifying the same effect in rural human populations.


Conflict of interest statement

The authors declare no competing interests.

Figures

Fig. 1
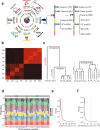
Fig. 1. Intestinal microbiota of the healthy pig.
a, Joint principal coordinate analysis (PCoA) of 5,110 16S rRNA profiles. F6 day 25 faeces (D25, mauve), day 120 faeces (D120, red), day 240 faeces (D240, green), ileal content (IC, light blue), caecum content (CC, dark blue) (left). Middle, as described for the left plot but for F7. Right, F7 ileal content (IC, light blue), caecum content (CC, dark blue), ileal mucosa (IM, pink), caecal mucosa (CM, brown). b, The average microbiota composition of the 12 data series. Taxa are coloured by phylum and family within phylum, highlighting 43 families among the top 15 in at least one data series. The names of the corresponding phyla and families are shown in the key. The average composition of 106 human faeces and 6 mouse faeces (C57BL/6) samples is shown. c, α-Diversity values (Shannon’s index) for the 12 data series coloured as in a. Sample sizes are provided in Supplementary Table 2.1. The box plots show the median (centre line), interquartile range (box limits), 1.5× the interquartile range span (whiskers) and outliers (dots). d, β-Diversity values (pair-wise Bray–Curtis distances) for the 12 data series coloured as in a. Distances were computed for all sample pairs. Sample numbers and box plots are as described in c.
Fig. 2
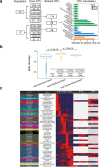
Fig. 2. Heritability of microbiota composition in mosaic pigs.
a, Correlation between genome-wide kinship (Θ) and microbiome dissimilarity (Bray–Curtis distance) within litter. The correlation (Spearman's r) was measured separately for the 12 data series. P values (one-sided) were computed by permutation. Adjusted r values were below the 50th percentile of the permutation values for 11 out of 12 (P = 0.0029). The empirical P value (one-sided) of r was ≤0.05/12 = 0.004 (Bonferroni corrected) for two data series. P values were combined across the 12 data series yielding an overall P value of 3 × 10−4. The number of litters (l) and animal pairs (n) used are given for each data series. b, The correlation between genome-wide kinship and microbiome dissimilarity (Bray–Curtis distance) across generations. We considered all possible pairs of F6 and F7 animals (not including sow–offspring pairs). Analyses were conducted for the five traits measured in both F6 and F7. r, p and n are as described in a. r values were below the 50th percentile of the permutation values for the five analysed sample types (P = 0.03). The empirical P value (one-sided) of r was ≤0.05/5 = 0.01 (Bonferroni corrected) for one sample type. P values for the five sample types were combined yielding an overall P value of 0.013. c, The frequency distribution of heritabilities of individual taxa sorted by sample type (left) or taxonomic level (right). The values obtained by joint analysis of F6 and F7. d, Total heritabilities computed by sample type and taxonomic level.
Fig. 3
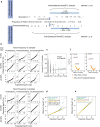
Fig. 3. A miQTL affecting Erysipelotrichaceae species.
a, The result of genome-wide meta-analysis (across sample types) in F6 and F7 for OTU476. Reported log-transformed P values are nominal (that is, not corrected for multiple testing). b, Local magnified views of chromosome 1 (272.8–273 Mb) of OTU476 and OTU327 in F6 and F7. log-transformed nominal P values as in a. c, log[1/P] values in F6 (x-axis) and F7 (y-axis) for the association between SNP 1_272907239 and the abundance of 8,490 OTUs for all of the sample types and two analyses methods (abundance and presence/absence, explaining the two OTU476 values) (left). OTUs belonging to p-75-a5 and Erysipelotrichaceae are shown in red and yellow, respectively. Right, comparison of the distribution of association (1_272907239) P values for p-75-a5 and Erysipelotrichaceae OTUs with other OTUs in F6 and F7. Box plots are as described in Fig. 1c. The notches in the boxes correspond to 95% confidence intervals of the median values. Distributions were compared using Wilcoxon’s rank-sum test. P values (nominal) of the comparisons are given above the horizontal lines. c, LD (r2) between the four top SNPs and the 2.3 kb ABO deletion in F6 and F7.
Fig. 4
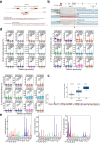
Fig. 4. A 3.5-million-year-old deletion in the pig ABO orthologue causes the miQTL.
a, The structure of the porcine AO blood group gene. IGV (Integrated Genome Viewer) view of the genotypes of the 61 F0 animals showing 145 variants in a ~5 kb interval spanning the 2.3 kb deletion. The top two red rectangles show the 2.3 kb deletion. Homozygous alternative (light blue), heterozygous (dark blue) and homozygous reference (grey) genotypes are shown. The horizontal blue arrows mark SINEs that have mediated intrachromosomal recombination. The vertical black arrows mark the top variants from Fig. 3b. The effect of the 2.3 kb deletion on acetyl-galactosaminyl transferase transcripts is shown, including the creation of alternative exons 8 and 9, and the reduction of transcript levels to around one-third of normal. b, The effect of the AO genotype (AA, AO or OO) on the abundance of OTU476. The effect of the A allele is dominant over that of the O allele, and the miQTL effect is detected in the caecum (content and mucosa) and in day 120 and 240 faeces samples. Sample sizes are provided in Supplementary Table 4.1. The box plots are as described in Fig. 3d. c, Unweighted pair group method with arithmetic mean dendrogram based on the sequence similarity between 14 AA and 34 OO animals in a 5 kb window centred on the 2.3 kb deletion. CH, Chinese; EU, European; RU, Russian; DOM, domestic pigs; WB, wild boars; PHAC_AFR, common warthog; SUS_VERR, Javan warty pig; SUS_CEB, Visayan warty pig; SUS_SCR_VII, Sumatran wild boar. Breeds: BX, Bamaxiang; EH, Erhualian; LA, Laiwu; LD, Landrace; LW, Large White; PT, Piétrain; TB, Tibetan; WD, White Duroc. d, The peak of reduced population differentiation coinciding with the 2.3 kb deletion (red) in the porcine AO gene (blue). The position on chromosome 1 is shown on the x-axis; and 1/(mean F statistic) for all variants in a 2 kb sliding window is shown on the y-axis. The F statistic was computed as the ratio of the between-breed mean squares and the within-breed mean squares for the dosage of O allele. Chr., chromosome.
Fig. 5
Fig. 5. The miQTL acts by increasing GalNAc concentrations and affects GalNAc-using bacteria.
a, The effect of AO genotype on GalNAc concentrations in caecal content (nAA = 33, nAO = 118, nOO = 127). Concentrations were corrected for batch effect and scaled between 0 and 1 to equalize residual variance. P values (two-sided and nominal) for genotype contrasts were computed using Wilcoxon’s tests. The box plots are as described in Fig. 1c. b, The correlation between GalNAc concentration and OTU476 abundance within the AO genotype. Area under the curve (AUC) values for GalNAc corrected for batch effect and AO genotype and scaled as described above. The P value (nominal, two-sided) of Spearman’s correlation is given (P = 0.012). The shaded area corresponds to the 95% confidence region for the regression fit. c, Same as in b, with animals coloured by AO genotype. d, The GalNAc transport and catabolic pathway in OTU476-like strains. GalNAc-6-P, N-acetylgalactosamine-6-phosphate; GalN-6-P, galactosamine-6-P; Tag_6-P, tagatose-6-phosphate; Tag-1,6-PP, tagatose-1,6-biphosphate; GAP, glyceraldehyde-3-phosphate; DHAP, dihydroxyacetone-phosphate; 3PG, 3-phosphoglycerate; Pyr, pyruvate; Lact, lactate. Enzymes encoded in the GalNAc operon are shown in blue. Metabolites considered in the metabolic flux analysis are shown in bold. e, The proportion of 13C-labelled metabolites determined by GC–MS in the OTU476-like strain (4-8-110) fed 13C-labelled (red) versus regular GalNAc (green). f, In vivo (germ-free mice) E. coli versus OTU476-like strain competition with and without GalNAc. The proportion of 16S rRNA reads mapping to the 4-8-110 reference rRNA sequence versus E. coli rRNA sequence (that is, 1 minus the proportions shown in the figure correspond to reads mapping to the E. coli 16S rRNA) in the caecum content and faeces of 10 germ-free mice (Kunming line) inoculated by gavage with a pure culture of 4-8-110 and E. coli and force-fed with GalNAc (red bars) versus PBS (green bars). P values (nominal, two-sided, uncorrected) comparing the difference in abundance were determined using Wilcoxon tests.
Fig. 6
Fig. 6. The GalNAc operon organization and transcriptome response of miQTL-responsive bacteria.
a, The GalNAc operon organization and local transcriptome response to GalNAc addition in OTU476-like strains and E. coli. Top, GalNAc operon organization. Identified ORFs are represented as coloured boxes. Genes implicated in GalNAc import and catabolism are shown in red if they are part of the cluster and in green if located elsewhere in the genome. Genes with a known function unrelated to GalNAc are shown in blue. ORFs with an uncharacterized gene product are shown in grey. Gene acronyms are given next to the corresponding boxes. ORFs transcribed from the top and bottom strand are shown above and below the dotted line, respectively. The respective transcriptional directions are marked by arrows. Bottom, local gene expression levels (fragments per kb of exon model per million mapped reads (FPKM)) with (dark colour) and without (light colour) addition of GalNAc in the growth medium. The colours for the ORFs with a known function (GalNAc gene (red), other gene (blue)) are the same as in the top panels. The error bars are the s.e.m. from three replicates (individual values are shown as dots). b, The global transcriptome response to GalNAc addition in OTU476-like strains and E. coli. The log2-transformed fold change in expression for all genes in the respective genomes (4,419 in E. coli, 1,119 in OTU476-like strains, ranked according to genomic position) after addition of GalNAc in the medium is shown. GalNAc genes are shown in red and other genes are shown in blue. Insets: corresponding QQ plots showing the near absence of effects on genes other than the GalNAc regulon in E. coli versus the widespread response in OTU476-like strains. The P values used to generate the QQ plots are nominal, and were determined using DISEQ2.
Extended Data Fig. 1
Extended Data Fig. 1. Generating a large mosaic pig population for genetic analysis of complex phenotypes.
(a) Rotational breeding design used for the generation of a large mosaic pig population for the genetic analysis of complex phenotypes, with sampling scheme for faeces (D25, D120, D240), luminal content of the ileum (IC) and caecum (CC), and mucosal scrapings in the ileum (IM) and caecum (CM). BX: Bamaxiang, EH: Erhualian, LA: Laiwu, TB: Tibetan, LW: Large White, LD: Landrace, PT: Piétrain, WD: White Duroc. (b) Average similarity (1 – π) between allelic sequences sampled within and between the eight founder breeds. The colour intensity ranges from black (breeds with lowest allelic similarity: BX vs WD, 1 - 4.3x10⁻³) to bright red (breed with highest allelic similarity: WD, 1 - 1.8x10⁻³). The acronyms for the breeds are as in (a). More than 30 million variants with MAF ≥ 3% segregate in this population, i.e. more than one variant every 100 base pairs. This is slightly lower than the 40 million high quality variants segregating in the mouse collaborative cross. (c) Comparison of the average nucleotide diversity (π, i.e. the proportion of sites that differ between two chromosomes sampled at random in the population(s)) within and between European (Eur) and Asian (As) domestic pigs, and between modern European (HSEur), Asian humans (HSAs), Neanderthal (Neand) and Chimpanzee (Pan Trogl). The average nucleotide diversity within the four Chinese founder breeds was ~2.5x10⁻³ and within the four European founder breeds ~2.0x10⁻³. By comparison, π-values within African and within Asian/European human populations are ~9x10⁻⁴ and ~8x10⁻⁴, respectively,. Thus, against intuition (as domestication is often assumed to have severely reduced effective population size) the within population diversity is >2-fold higher in domestic pigs than in human populations, as previously reported. Nucleotide diversities between Chinese founder breeds and between European founder breeds were ~3.6x10⁻³ and ~2.5x10⁻³, respectively, i.e. 1.44-fold and 1.25-fold higher than the respective within-breed π-values. These π-values are of the same order of magnitude as the sequence divergence between Homo sapiens and Neanderthals/Denosivans (~3x10⁻³, ref. ). By comparison, π-values between Africans, Asians and Europeans are typically ≤ ~1x10⁻³ (ref. ). The nucleotide diversity between Chinese and European breeds averaged ~4.3x10⁻³. This π-value is similar to the divergence between M. domesticus and M. castaneus, and close to halve the ~1% difference between chimpanzee and human. Note that Chinese and European pig breeds are derived from Chinese and European wild boars, respectively, which are thought to have diverged ~1 million years ago, while M. domesticus and M. castaneus are thought to have diverged ≤ 500,000 years ago. (d) Autosome-specific estimates of the genomic contributions of the eight founder breeds in the F6 and F7 generation. We used a linear model incorporating all variants to estimate the average contribution of the eight founder breeds in the F6 and F7 generation at genome and chromosome level. At genome-wide level, the proportion of the eight founder breed genomes ranged from 11.2% (respectively 11.5%) to 14.1% (14.7%) in the F6 (F7) generations. At chromosome-specific level, the proportion of the eight founder breeds ranged from 6.7% (respectively 4.9%) to 20.7% (22.1%) in the F6 (F7) generations. The genomic contribution of the eight founder breeds in the F6 and F7 generation is remarkably uniform and close to expectations (i.e. 12.5%) both at genome-wide and chromosome-wide level, suggesting comparable levels of genetic diversity across the entire genome. This does not preclude that more granular examination may reveal local departures from expectations, or under-representation of incompatible allelic combinations at non-syntenic loci. (e-f) Indicators of achievable mapping resolution in the F6 generation: (e) Frequency distribution (density) of the number of variants in high LD (r2 ≥ 0.9) with an “index” variant (was computed separately for all variants considered sequentially as the “index”), corresponding to the expected size of “credible sets” in GWAS. The red vertical line corresponds to the genome-wide median. The green vertical line corresponds to the mapping resolution achieved in this study for the ABO locus (see hereafter). (f) Frequency distribution (density) of the maximum distance between an index variant and a variant in high LD (r2 ≥ 0.9) with it, defining the spread of credible sets. Red and green vertical lines are as in (D).
Extended Data Fig. 2
Extended Data Fig. 2. Characterizing the age- and location-specific composition of the intestinal microbiome of the healthy pig.
(a) Definition of a core intestinal microbiome of the pig. A total of 58 OTUs that were annotated to 21 taxa were identified in >95% of day 120 and 240 faeces and caecum content samples of both F6 and F7 generations, hence defined as core bacterial taxa. (b) The compositions of the porcine and human intestinal microbiota are closer to each other than either is to that of the mouse. Boxplots are as is Fig. 1c. The number of samples available for analysis were 1281 pigs, 106 humans and 6 mice. (c) Abundances (F6-F7 averages when available) of the 43 families represented in Fig. 1b in the seven sample types relative to the sample type in which they are the most abundant (red – blue scale). The families are ordered according to the sample type in which they are the most abundant. The colour-code for phyla is as in Fig. 1b. Columns are added for comparison with mouse and human. Mouse data are from Fig. 1 in Suzuki & Nachman, and human data from Fig. 6 in Vuik et al. P_I: proximal ileum, D_IL: distal ileum, C: caecum, CO: colon, RE: rectum, F: faeces. The families differing the most with regards to location-specific distribution between species include Helicobacteriaceae, Veillonellaceae, Lactobacillaceae and Streptocaccaceae.
Extended Data Fig. 3
Extended Data Fig. 3. Evaluating the heritability of intestinal microbiota composition in the mosaic pig population.
Correlation between heritability estimates of taxa/OTUs in F6 and F7 generation by sample type (D25, D120, D240, CC and IC). Correlation coefficients (r) and associated p-values (p) were computed using heritability estimates that were pre-corrected for bacterial abundance (residuals of linear model). Heritability estimates indeed tend to slightly increase with taxa abundance. Yet, results show that this effect cannot account for the observed correlations between F6 and F7 estimates in D120, D240 and CC, hence pointing towards genuine genetic effects. The shaded areas correspond to the 95% confidence region for the regression fit. Correlation coefficients and two-sided p-values were computed using Spearman’s rank-based method. Reported p-values are nominal (i.e. uncorrected for multiple testing).
Extended Data Fig. 4
Extended Data Fig. 4. Identifying a microbiota QTL (miQTL) with major effect on the abundance of Erysipelotrichaceae species by whole genome sequence based GWAS.
(a) Schematic illustration of the samples and SNPs used for the two types of analyses (abundance and presence/absence) performed for miQTL mapping. (b) (Upper) Distribution of log(1/p) values for 1,527 sets of 11 p-values obtained in 11 data-series for a SNP x taxon x analysis model combination that yielded a genome-wide significant signal (p < 5 x 10⁻⁸) in the 12th data-series. (Lower) Distribution of log(1/p) values for 1,527 sets of 11 p-values obtained in the same data-series and with the same analysis model as in (upper) but with randomly selected SNP x taxon combinations matching the ones in (upper) for MAF and taxa abundance. Log(1/p) values were computed using GenABEL as described in Methods. Corresponding p-values are nominal and two-sided. (c) Correlation between the average (F6 and F7) taxon heritability, and the average (F6 and F7) number of genome-wide significant (p ≤5 × 10⁻⁸) miQTL for D240 faecal samples. The shaded area corresponds to the 95% confidence region for the regression fit. Correlation coefficient and associated p-values are Spearman’s. (d) QQ plot for 1,527 (number of signals (SNP x taxon x model x one data series in one cohort) exceeding the genome-wide log(1/p) threshold value of 7.3) sets of ≤ 5-7 p-values (same SNP x taxon x model, all data series in the other cohort) for real SNPs (Blue: quantitative model; Green: binary model), and matched sets of ≤ 5-7 p-values corresponding to randomly selected SNP x taxon combinations matched for MAF and abundance or presence/absence rate (Brown: quantitative model; Yellow: binary model). Log (1/p) values were computed using GenABLE as described in Methods. Corresponding p-values are nominal and two-sided. (e) Same QQ plot as in (C) after removal of all SNPs in the chromosome 1: 272.8-273.1Mb interval. Log(1/p) values were computed using GenABLE as described in Methods. Corresponding p-values are nominal and two-sided. (f) Distribution of the association log(1/p) values and corresponding signed z-scores for SNP 1_272907239 and 31 p-75-a5 OTUs (red) and 83 Erysipelotrichaceae (yellow) OTUs, showing an enrichment of effects with same sign as for OTU476 and OTU327. Log(1/p) values were computed using Metal (v3.0) as described in Methods. Corresponding p-values are nominal and two-sided. See also Supplemental discussion 1.
Extended Data Fig. 5
Extended Data Fig. 5. The chromosome 1 miQTL is caused by a 2.3 kb deletion in the orthologue of the human ABO gene.
(a) Breakpoints of the 2.3 kb deletion showing the role of a duplicated SINE sequence in mediating an intra-chromosomal recombination. (b) Illustrative example of allelic balance for the cG146C SNP in an AA homozygote and of allelic imbalance for the same SNP in an AO heterozygote. (c) (Upper) eQTL analysis for the porcine AO gene maximizing at the exact position of the 2.3 kb deletion (p = 1.9x10−43) and showing the additive effect of the A allele increasing transcript levels ~3-fold (inset; FPKM: Fragments Per Kilobase of transcript per Million mapped reads). The “n’s” correspond to the number of animals of each genotype available for analysis. Boxplots are as in Fig. 1c. (Lower) Genome wide eQTL scan for the porcine ABO gene showing the strong cis-eQTL signal on chromosome 1. eQTL analysis was conducted with GEMMA (v0.97). Reported log-transformed p-values are nominal and two-sided. (d) Effect of N-acetyl-galactosaminyl transferase genotype (AA, AO or OO) on abundance of OTU327 and p-75-a5 in the twelve data series. Absence of an effect of N-acetyl-galactosaminyl transferase genotype (AA, AO or OO) on abundance of E. coli in the twelve data series. Sample sizes are as in STable 4.1. Boxplots are as in Fig. 3d. (e) Abundance of OTU476, OTU327 and p-75-a5 in the twelve data series. Violin plots with indication of the median. Numbers (n’s) are as in STable 4.1. See also Supplemental discussion 2.
Extended Data Fig. 6
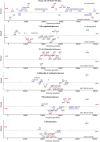
Extended Data Fig. 6. cis-eQTL analyses in the vicinity of the chromosome 1 miQTLK supports the causality of the 2.3 kb deletion.
(a) Cis-eQTL analysis for the porcine N-acetyl-galactosaminyl transferase (“ABO”), GBTG1, LCN1 (=OBP2B), MED22 and SURF6 genes in caecum. The blue triangle corresponds to the top SNP for the miQTL. The red triangles correspond to the top SNPs for the respective cis-eQTL. Only for N-acetyl-galactosaminyl transferase are blue and red variants the same. eQTL analyses were conducted with GEMMA (v0.97). Reported log-transformed p-values are nominal and two-sided. (b) Effect of AO genotype on the expression levels of the corresponding genes in caecum. There was no evidence for an effect of AO genotype on the expression of any of these genes other than ABO. The number of AA, AO and OO samples available for cis-eQTL analysis for each gene are given (n). Boxplots are as in Fig. 1c. We tested the difference in gene expression level between pairs of genotype classes using a two-sided t-test. (c) Effect of the top cis-eQTL SNPs (blue triangles in A) on OTU476 abundance. Only the top cis-eQTL SNPs for ABO has an effect on OTU476 abundance. The number of AA, AO and OO samples available for miQTL analysis for each gene are given (n). Boxplots are as in Fig. 1c. We tested the difference in bacterial abundance between pairs of genotype classes using a two-sided t-test.
Extended Data Fig. 7
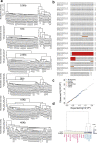
Extended Data Fig. 7. The 2.3 kb deletion in the orthologue of the human ABO gene is 3.5 million years old and under balancing selection.
(a) UPGMA tree based on nucleotide diversities between 14 AA and 34 OO animals in windows of increasing size (0.5 to 40 kb) centred on the 2.3 kb deletion in the porcine N-acetyl-galactosaminyl transferase gene (porcine O allele). PA: Phacochaerus Africanus, SC: Sus cebifrons, SV: Sus verrucosus, SU: Sus scrofa vittatus, CB: Chinese wild boar, RB: Russian wild boar, EB: European wild boar, ERH: Erhualian, BX: Bamaxiang, T: Tibetan, LA: Laiwu, LR: Landrace, LW: Large White, PI: Piétrain, WD: White Duroc. Context: To gain additional insights in the age of the porcine O allele, we generated phylogenetic trees of the A and O alleles of 14 AA and 34 OO animals including domestic pigs, wild boars, Visayan and Javanese warty pigs, and common African warthog. Examination of their local SNP genotypes (50K window encompassing the ABO gene) reveals traces of ancestral recombinations between O and A haplotypes as close as 300 and 800 base pairs from the proximal and distal deletion breakpoints, respectively, as well as multiple instances of homoplasy that may either be due to recombination, gene conversion or recurrent de novo mutations. On their own, these signatures support the old age of the O allele. We constructed UPGMA trees based on nucleotide diversity for windows ranging from 500 bp to 40 kb centred on the 2.3 kb deletion. Smaller windows have a higher likelihood to compare the genuine ancestral O versus A states, yet yield less robust trees because they are based on smaller number of variants. Larger windows will increasingly be contaminated with recombinant A-O haplotypes blurring the sought signal. Indeed, for windows ≥ 20 kb or more, the gene tree corresponds to the species tree, while for windows ≤ 15 kb the tree sorts animals by AA vs OO genotype. For all windows ≤ 15 kb the Sus cebifrons O allele maps outside of the Sus scrofa O allele supporting a deep divergence (rather than hybridization) and hence the old age of the O allele. Of note, for windows ≤1.2 kb, the warthog A allele is more closely related to the Sus A alleles than to the Sus O alleles (ED7A). This suggests that the O allele may be older than the divergence of the Phacochoerus and Sus A alleles, i.e. > 10 MYA. It will be interesting to study larger numbers of warthog to see whether the same 2.3 kb deletion exists in this and other related species as well. (b) Alignment of ~900 base pairs of the O alleles of domestic pigs (Bamaxian), European and Asian wild boars, and Sus cebufrons demonstrating that these are identical-by-descent. The SINE element that is presumed to have mediated the recombinational event that caused to 2.3 kb deletion is highlighted in red. Context: To further support their identity-by-descent we aligned ~900 base pairs (centred on the position of the 2.3 kb deletion) of the O alleles of domestic pig, European and Asian wild boars and Sus cebifrons. The sequences were nearly identical further supporting our hypothesis. It is noteworthy that the old age of the “O” allele must have contributed to the remarkable mapping resolution (≤3 kb) that was achieved in this study. In total, 42 variants were in near perfect LD (r2 ≥ 0.9) with the 2.3 kb deletion in the F0 generation, spanning 2,298 bp (1,522 on the proximal side, and 762 on the distal side of the 2.3 kb deletion). This 2.3 kb span is lower than genome-wide expectations (17th percentile), presumably due to the numerous cross-overs that have accrued since the birth of the 2.3 kb deletion that occurred in the distant past. Yet the number of informative variants within this small segment is higher than genome-wide average of (57% percentile) also probably due at least in part to the accumulation of numerous mutations since the remote time of coalescence of the A and O alleles (see Fig. 1d in main text). (c) QQ plots for the effect of AO genotype on 150 phenotypes pertaining to meat quality, growth, carcass composition, hematology, health, and other phenotypes in the F6 and F7 generation. P-values were obtained using a mixed model followed by meta-analysis (weighted Z score) across the F6 and F7 generations as described in Methods. log-transformed p-values used for the QQ plot are nominal and two-sided. Context: Our findings in suidae are reminiscent of the trans-species polymorphism of the ABO gene in primates attributed to balancing selection. The phenotype driving balancing selection remain largely unknown yet a tug of war with pathogens is usually invoked: synthesized glycans may affect pathogen adhesion, toxin binding or act as soluble decoys, while naturally occurring antibodies may be protective,. In humans, the O allele may protect against malaria, E. Coli and Salmonella enteric infection, SARS-CoV-1, SARS-CoV-2 and schistosomiasis, while being a possible risk factor for cholera, H. pylori and norovirus infection. Whatever the underlying selective force, it appears to have operated independently in at least two mammalian branches (primates and suidae), over exceedingly long periods of time, and over broad geographic ranges, hence pointing towards its pervasive nature. To gain insights in what selective forces might underpin the observed balanced polymorphism, we tested the effect of porcine AO genotype on >150 traits measured in the F6 and F7 generations pertaining to carcass composition, growth, meat quality, hematological parameters, disease resistance and behaviour. No significant effects were observed when accounting for multiple testing, including those pertaining to immunity and disease resistance. (d) Expression profile of the AO gene in a panel of adult and embryonic porcine tissues (own RNA-Seq data).
Extended Data Fig. 8
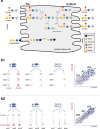
Extended Data Fig. 8. The chromosome 1 miQTL affects caecal N-acetyl-D-galactosamine (GalNAc) concentrations which are correlated with the abundance of Erysipelotyrichaceae species within AO genotype: theory.
(a) ABO and α-gal epitopes in pigs and human. The glycosyltransferase gene located on 9q34.2 and underpinning the human ABO blood group is characterized in most human populations by three major alleles: (i) IA encoding a α-3-N-acetyl-D-galactosaminyltransferase that is adding GalNAc to H and Lewis antigens (yielding the A antigen) on various glycoproteins including mucins secreted in the intestinal lumen, (ii) IB encoding a α-3-D-galactosyltransferase that is adding galactose to the same antigens (yielding the B antigen), and (iii) the inactive IO null allele that precludes expression of either the A and/or the B antigen. Mutations in the fucosyltransferase 2 gene (FUT2) preclude formation of the H antigen on secreted proteins and hence the detection of A and B antigens in secretions. The pig orthologue of the human ABO glycosyltransferase gene is located on the telomeric end of porcine chromosome 1q, and is characterized by two major alleles: (i) the A allele, encoding a α-3-N-acetyl-D-galactosaminyltransferase that is adding GalNAc to H and Lewis antigens, similar to the human IA allele, and (ii) the O allele corresponding to a null allele as a result of a 2.3 kb deletion similar to the human IO allele. Thus, the B antigen (Galα1-3(Fucα1-2)Galβ1-4GlcNAc-R) is not observed in pig populations. However, what is found abundantly on the surface of cells in many tissues is the so-called “α-gal epitope” (Galα1-3Galβ1-4GlcNAc-R), which results from the addition of a galactose to the Galβ1-4GlcNAc-R precursor by a α1,3galactosyltransferase encoded by the GGTA1 gene. The orthologue of the GGTA1 gene is non-functional in human and Old World non-human primates, which, however, have high titers of circulating anti-α-gal antibodies contributing to acute rejection of xenografts,. (b) Identifying whether changes in GalNAc concentration are the cause of the observed changes in abundance of Erysipelotrichaceae species by searching for a correlation between the two phenotypes “within AO genotype”. (b1) If AO genotype is associated with the abundance of Erysipelotrichaceae species and GalNAc concentrations by virtue of different molecular mechanisms (for instance because they involved distinct causative mutations albeit in linkage disequilibrium, or because the gene has an as of yet unknown other activity that is causing the change in bacterial abundance, independently of its glycosyltransferase activity), there is no reason to expect a correlation between bacterial abundance and GalNAc concentration within AO genotype (red horizontal lines in the dotted circles). There is of course a correlation across genotypes that is due to the fact that AO genotype has a (direct or indirect) effect on both phenotypes. (b2) If, on the other hand, AO genotype causes the change in GalNAc concentration (which is very likely given its known enzymatic activity) which then causes the change in the abundance of Erysipelotrichaceae species, one can expect that bacterial abundance and GalNAc concentration will be correlated, also within AO genotype, as indicated by the sloped red lines within the dotted ellipses. This is what is observed with the real data.
Extended Data Fig. 9
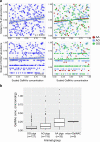
Extended Data Fig. 9. The chromosome 1 miQTL affects caecal N-acetyl-D-galactosamine (GalNAc) concentrations which are correlated with the abundance of Erysipelotyrichaceae species within AO genotype: results.
(a) Positive correlation between caecal GalNAc concentrations and bacterial abundance (upper panels: p-75-a5; lower panels: OTU327) “within AO genotype”. GalNAc concentrations and bacterial abundances were corrected for batch effects and AO genotype and scaled between 0 and 1 to equalize residual variance. Correlations were computed using all samples jointly and Spearman’s rank-based test; corresponding p-values (nominal; two-sided) are given (left panels). Regression lines are shown for the different AO genotypes separately (right panels); all of them are positive. Note that the scatter plots for p-75-a5 are not identical but very similar to those for OTU476 (Fig. 5b, c). This is because OTU476 accounts for most of the p-75-a5 genus in caecum content (see also Extended Data Fig. 5). These data can therefore not be considered to be independent. The shaded areas correspond to the 95% confidence regions for the regression fit. (b) Comparison of the free GalNAc concentrations in caecal content of OO, AO and AA pigs as well as in caecal content of germ-free mice gavaged with 200mg/kg GalNAc. Concentrations were determined in freeze-dried caecal content powder using LC-MS/MS. Number of analyzed samples are given (n). Boxplots are as in Fig. 1c.
Extended Data Fig. 10
Extended Data Fig. 10. The chromosome 1 miQTL affects bacteria with a functional GalNAc import and catabolic pathway.
Presence anywhere in the genome (green), presence in close proximity to agaS (red), or absence (black) of the orthologues of 24 genes implicated in the GalNAc TR/CP pathway in the genome of (i) two OTU476 like strains (4-15-1 and 4-8-110), (ii) 248 MAGs assigned to the Erysipelotrichaceae family, and (iii) 2,863 MAGs assigned to other bacterial families. The two lanes on the right of the three panels correspond to the Regulon (red) and Pathway (green) score respectively. Both scores range from 0 (black) to 6 (bright red or green). Means (range) for the corresponding dataset are given on top. P-values (nominal, two-sided, uncorrected) of the pathway and regulon scores were computed using a linear model described in Methods.
Extended Data Fig. 11
Extended Data Fig. 11. Different GalNAc operon structure and transcriptome response in miQTL-sensitive versus -insensitive GalNAc utilizing bacteria.
Maps of GalNAc “operons” in one of the two OTU476-like strains (NB: The organization of the GalNAc gene cluster was identical in both 4-15-1 and 4-8-110 strains), and six MAGs assigned respectively to an Erysipelotrichaceae, E. coli (an Enterobacteriaceae), a Collinsella (a Coriobacteriaceae), a Fusobacteriaceae, a Firmicutes and a Clostridium. Identified Open Reading Frames (ORFs) are represented as coloured boxes. Genes implicated in GalNAc import and catabolism are in red if they are part of the cluster and in green if located elsewhere in the genome. Genes with a known function unrelated to GalNAc are in blue. ORFs with uncharacterized gene product in gray. Gene acronyms are given next to the corresponding boxes. ORFs transcribed from the top (respectively bottom) strand are above (below) the dotted line. The respective transcriptional directions are marked by the arrows. The source of information used to confirm the map order is given (finished genome, multiple MAGs, single contig).
Extended Data Fig. 12
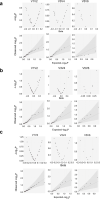
Extended Data Fig. 12. No effect of ABO genotype on intestinal Erysipelotrichaceae abundance in human.
Volcano and QQ plots for 43 (V1-V2), 20 (V3-V4) and 9 (V5-V6) OTUs classified as Erysipelotrichaceae for the contrasts (a) [AA, AO and AB] versus [BB, BO and OO], (b) [BB, BO and AB] versus [AA, AO and OO], and (c) [OO] versus [all others]. The shaded areas correspond to the 95% confidence intervals of the spread of the QQ plot under the null hypothesis of no QTL. The actual points are always within these intervals precluding us to reject the null hypothesis. P-values (nominal, two-sided) were computed using the linear model described in Methods and hereafter. See also Supplemental discussion 3.

Comment in

References

    1. Kundu P, Blacher E, Elinav E, Pettersson S. Our gut microbiome: the evolving inner self. Cell. 2017;171:1481–1493. doi: 10.1016/j.cell.2017.11.024. - DOI - PubMed
    1. Rothschild D, et al. Environment dominates over host genetics in shaping human gut microbiota. Nature. 2018;555:210–215. doi: 10.1038/nature25973. - DOI - PubMed
    1. O’Hara E, Neves ALA, Song Y, Guan LL. The role of the gut microbiome in cattle production and health: driver or passenger? Annu. Rev. Anim. Biosci. 2020;8:199–220. doi: 10.1146/annurev-animal-021419-083952. - DOI - PubMed
    1. Schmidt TSB, Raes J, Bork P. The human gut microbiome: from association to modulation. Cell. 2018;172:1198–1215. doi: 10.1016/j.cell.2018.02.044. - DOI - PubMed
    1. Polderman TJC, et al. Meta-analysis of the heritability of human traits based on 50 years of twin studies. Nat. Genet. 2015;47:702–709. doi: 10.1038/ng.3285. - DOI - PubMed

MeSH terms

Substances