. 2022 Jun;606(7916):930-936.
doi: 10.1038/s41586-022-04767-1. Epub 2022 Apr 27.

Breakage of cytoplasmic chromosomes by pathological DNA base excision repair

Affiliations

Breakage of cytoplasmic chromosomes by pathological DNA base excision repair

Shangming Tang et al. Nature. 2022 Jun.

Abstract

Chromothripsis is a catastrophic mutational process that promotes tumorigenesis and causes congenital disease1-4. Chromothripsis originates from aberrations of nuclei called micronuclei or chromosome bridges5-8. These structures are associated with fragile nuclear envelopes that spontaneously rupture9,10, leading to DNA damage when chromatin is exposed to the interphase cytoplasm. Here we identify a mechanism explaining a major fraction of this DNA damage. Micronuclei accumulate large amounts of RNA-DNA hybrids, which are edited by adenine deaminases acting on RNA (ADAR enzymes) to generate deoxyinosine. Deoxyinosine is then converted into abasic sites by a DNA base excision repair (BER) glycosylase, N-methyl-purine DNA glycosylase11,12 (MPG). These abasic sites are cleaved by the BER endonuclease, apurinic/apyrimidinic endonuclease12 (APE1), creating single-stranded DNA nicks that can be converted to DNA double strand breaks by DNA replication or when closely spaced nicks occur on opposite strands13,14. This model predicts that MPG should be able to remove the deoxyinosine base from the DNA strand of RNA-DNA hybrids, which we demonstrate using purified proteins and oligonucleotide substrates. These findings identify a mechanism for fragmentation of micronuclear chromosomes, an important step in generating chromothripsis. Rather than breaking any normal chromosome, we propose that the eukaryotic cytoplasm only damages chromosomes with pre-existing defects such as the DNA base abnormality described here.


Conflict of interest statement

Competing interest

D. Pellman is a member of the Volastra Therapeutics SAB.

Figures
Extended Data Figure 1.
Extended Data Figure 1.. DNA damage in micronuclei depends on APE1 endonuclease.
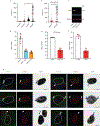
(a) γ-H2AX fluorescence intensity (FI, arbitrary units) in all PN and MN (ruptured and unruptured) before (EdU) and after S phase entry (EdU+). RPE-1 cells were synchronized as in Fig. 1a (mean with 95% CI, ****P<0.0001, Ordinary one-way ANOVA with Tukey’s multiple comparisons test, EdU: n=95; EdU+: n=171). (b) γ-H2AX FI in ruptured MN, comparing EdU+ and EdU cells, as in Extended data Fig. 1a (mean with 95% CI, ****P<0.0001, Two-tailed Mann-Whitney U test, EdU: n=65; EdU+: n=131). (c) Western blot to detect APE1 in control and two knockout clones. GAPDH is the loading control. (d) Aggregated data from three replicates showing the % of γ-H2AX positive MN (> 3 SD above PN background) in control and two APE1 knockout clones (mean with SD, ***P=0.0004 (control vs. APE1 KO1), ***P=0.0002 (control vs. APE1 KO2), Ordinary one-way ANOVA with Dunnett’s multiple comparisons test control: n=687; APE1 KO1: n=472; APE1 KO2: n=519). (e) Aggregated data from three replicates of control and APE1 knockout U2OS cells, synchronized as in Fig. 1a, after p53 RNAi (mean with SD, ***P=0.0002, two-tailed unpaired t-test. control: n=346; APE1 KO: n=318). (f) Aggregated data from three replicates for the example in Fig. 1c. (mean with SD, ***P=0.0007, two-tailed unpaired t-test, control: n=423; -APE1: n=457). (g) Representative images of RPE-1 cells co-stained to detect TUNEL signal (green) and γ-H2AX (red). Of TUNEL positive MN (n=391), 70.3% are also γ-H2AX positive. Dotted white lines outline the PN. Arrow heads: MN.
Extended Data Figure 2.
Extended Data Figure 2.. DNA damage in micronuclei in synchronized and unsynchronized cells depends on the catalytic activity of APE1.
(a) APE1-AID-SMASh degradation in unsynchronized RPE-1 cells. Control: no drugs; -APE1: 12 hours drug treatment prior to western (Dox, IAA and ASV). GAPDH is the loading control. (b) MN γ-H2AX FI with or without APE1 degradation in unsynchronized RPE-1 cells (mean with 95% CI, ****P<0.0001, Two-tailed Mann-Whitney U test, control: n=133; -APE: n=123). (c) Aggregated data from three replicates for MN DNA damage after APE1-AID-SMASh degradation in unsynchronized RPE-1 cells. Drugs to induce APE1-AID-SMASh degradation were added 12 hours prior to treatment with MPS1i to generate MN. After 48 hours cells were fixed and DNA damage was assessed (mean with SD, ***P=0.0003, two-tailed unpaired t-test, control: n=379; -APE1: n=353). (d) Aggregated data from three replicates for the example in Fig. 1g (mean with SD, NS: P =0.3606, ***P=0.0002, Ordinary one-way ANOVA with Dunnett’s multiple comparisons test, control: n=424; APE1 add-back: n=392; APE1-CI add-back: n=400). (e) MN γ-H2AX FI as shown in Fig. 1g but comparing labeling in EdU+ and EdU- cells for the indicated samples (mean with 95% CI, ****P<0.0001, Ordinary one-way ANOVA with Tukey’s multiple comparisons test. N values from left to right: n=53, 288, 41, 177, 71 and 280).
Extended Data Figure 3.
Extended Data Figure 3.. Western blot verification of glycosylase knockdown efficiency and MPG accumulation co-localizes with ruptured, TUNEL-positive MN.
(a) Western blots to detect the indicated glycosylases. Shown are the control and 72 hours RNAi treatments of RPE-1 cells. Asterisk indicates background bands. GAPDH is the loading control. Uncropped images are shown in the Source Data file. (b) MPG accumulation co-localizes with ruptured, TUNEL-positive MN in RPE-1 cells. Top two panels: TUNEL-labeling is green; MPG-labeling is red. Of visibly TUNEL positive MN (n=325), 99% display heavy accumulation of endogenous MPG. Bottom two panels: TUNEL-labeling is green; BAF-labeling is red. Of visibly TUNEL positive MN (n=334), 92% display heavy accumulation of BAF, a marker for NE rupture. Arrow heads: MN.
Extended Data Figure 4.
Extended Data Figure 4.. MPG catalytic activity is required for DNA damage in micronuclei in RPE-1 and U2OS cells.
(a) Western blots to detect MPG in control and two knockout clones. Asterisk indicates background bands. GAPDH is the loading control. (b) MPG catalytic activity is required to generate MN DNA damage. Aggregated data from three replicates for MN DNA damage in the indicated cell lines with the indicated add-back constructs as in Fig. 2g (mean with SD; NS, P =0.8326; ****P<0.0001; Ordinary one-way ANOVA with Dunnett’s multiple comparisons test. N values from left to the right: n=264, 472, 392, and 287). (c) Western blots to detect MPG in control and two knockout U2OS clones. GAPDH is loading control. Asterisk indicates background bands. GAPDH is the loading control. (d) MN γ-H2AX FI in control and MPG knockout U2OS cells. MN γ-H2AX FI measurements for control and two MPG KO clones synchronized as in Fig. 1a, after p53 RNAi (mean with 95% CI, ****P<0.0001, Ordinary one-way ANOVA with Dunnett’s multiple comparisons test. control: n=80; MPG KO1: n=76; MGP KO 2: n=119).
Extended Data Figure 5.
Extended Data Figure 5.. BER factors downstream of ssDNA nick generation are lost from ruptured micronuclei.
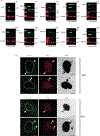
Representative images of RPE-1 cells stained for BAF and the indicated BER components. White arrowheads: ruptured MN that accumulate BAF lose BER components. White arrows: intact MN retain detectable BER components. Number on the right on each panel is showing the percentage of ruptured MN that visibly lose respective BER factors: 89.4% for XRCC1(n=132), 94.2% for LigI (n=241), 98.2% for LigIII (n=230) and 98% for Polβ (n=155).
Extended Data Figure 6.
Extended Data Figure 6.. RNA-DNA hybrids contribute to DNA damage in micronuclei.
(a) Dot blot showing that the α-inosine antibody recognizes dI in dsDNA oligonucleotides. α-dsDNA is the loading control. (b) dI accumulates on MN in MPG KO cells. Aggregated data from four biological replicates to detect α-inosine signal from purified PN and MN from wild-type and two MPG KO clones of U2OS cells. (mean with SD, Ordinary one-way ANOVA with Dunnett’s multiple comparisons test, *P=0.0465 (KO1), *P=0.0212(KO2)). (c) Aggregated data from three replicate experiments for the example in Fig. 3c and 3d. Inosine+ ruptured MN were defined as having >3SD of the PN mean value (mean with SD, ****P<0.0001, two-tailed unpaired t-test. control: n=577; MPG KO: n=882). (d) Overexpression of ITPA does not reduce DNA damage in MN. MN γ-H2AX FI measured from control or cells overexpressing ITPA. ITPA expression was induced with CMV promoter (mean with 95% CI, NS, P=0.3736, Two-tailed Mann-Whitney U test, control: n=129; ITPA: n=124). (e) Aggregated data from three replicate experiments to detect MN DNA damage after ITPA overexpression as in Extended Data Fig. 6d (mean with SD, NS, P=0.2306, two-tailed unpaired t-test. control: n=274; ITPA: n=372). (f) Data from four independent replicates of the experiment in Fig. 3e, showing S9.6 enrichment in MN over PN. Y axis shows S9.6 labeling intensity for PN and MN fractions from four biological replicates (mean with SD, **P=0.0020, unpaired t test after log transformation). (g) Western blot to detect induced expression of RNaseH1 (Tet-on system). GAPDH is the loading control. (h) RNaseH1 over expression suppresses MN DNA damage. Aggregated data from three replicate experiments for the example shown in Fig. 3g (mean with SD, NS, P=0.9355, ***P=0.0001, Ordinary one-way ANOVA with Dunnett’s multiple comparisons test. control: n=399; RNaseH1: n=391; RNaseH1-CI (D210N): n=548). (i) Overexpression of RNaseH1 suppresses MN DNA damage in U2OS cells. MN γ-H2AX FI from cells with or without overexpression of RNaseH1 or a catalytically inactive mutant (D210N) in U2OS cells (mean with 95% CI, ****P<0.0001, Ordinary one-way ANOVA with Dunnett’s multiple comparisons test. control: 141; RNASEH1: n=168; RNASEH1-CI: n=125). (j) Overexpression of RNaseH1 suppresses MN DNA damage in U2OS cells. Summary of three biological replicates as in Extended data Fig. 3i above (mean with SD, NS, P=0.3963, *** P=0.0002, Ordinary one-way ANOVA with Dunnett’s multiple comparisons test. control: n=548; RNASEH1: n=470; RNASEH1-CI: n=380). (k) Western blot to detect induced expression of the C-terminal catalytic domain of SETX (C-SETX, Tet-on system). GAPDH is the loading control. (l) C-SETX overexpression suppresses MN DNA damage. MN γ-H2AX FI in cells with or without overexpression of C-SETX (mean with 95% CI, ****P<0.0001, Two-tailed Mann-Whitney U test. control: n=149; C-SETX: n=118). (m) Aggregated data from three replicates for overexpression of C-SETX as in Extended data Fig. 3l (mean with SD, ****P<0.0001, two-tailed unpaired t-test. control: n=392; C-SETX: n=579).
Extended Data Figure 7.
Extended Data Figure 7.. Inhibition of transcription (DRB) reduces micronuclei DNA damage.
(a) Representative images showing that α-inosine signal colocalizes with the accumulation of RNaseH1-CI (marking RNA-DNA hybrids) on MN in MPG KO RPE-1 cells. (b) Fluorescence intensity of α-inosine and RNaseH1 CI signal of cells shown in (a) above (mean with 95% CI, ****P<0.0001, Ordinary one-way ANOVA with Tukey’s multiple comparisons test. n=81cells were analyzed). This shows that MN that accumulate RNA-DNA hybrids also have high-level α-inosine labeling. (c) MN γ-H2AX FI measured from control or cells treated with 100 μM DRB, which prevents S phase entry, almost completely blocks MN DNA damage (mean with 95% CI, ****P<0.0001, Two-tailed Mann-Whitney U test, control: n=151; DRB: n=266). (d) % of TUNEL positive MN in control and cells treated with 100 μM DRB. Aggregated data from 3 replicates from a similar experiment to (c) above but with TUNEL-labeling (mean with SD, ****P<0.0001, two-tailed unpaired t-test, control: n=490; DRB 100 μM: n=928). (e) % γ-H2AX positive MN in control and cells treated with 40 μM DRB. Aggregated data from 6 replicates from the experiment in Fig. 3h (mean with SD, two-tailed unpaired t-test, ****P<0.0001, control: n=910; DRB 40 μM: n=990). Note 40 μM DRB allows some cells to progress into S phase; only S phase cells were analyzed (visibly EdU positive PN). (f) % of TUNEL positive MN in control and cells treated with 40 μM DRB. Aggregated data from 3 replicates from a similar experiment to Fig. 3h but with TUNEL-labeling instead of γ-H2AX (mean with SD, two-tailed unpaired t-test, ****P<0.0001, control: n=642; DRB 40 μM: n=525). (g) Transcription is required for maximal accumulation of MPG on ruptured MN. Similar to the experiment shown in Fig. 3h (mean with 95% CI, ****P<0.0001, Two-tailed Mann-Whitney U test, control: n=161, DRB 40 μM: n=133). (h) DRB treatment does not affect MN rupture frequency. Similar to experiments shown in Fig. 3h (mean with 95% CI, NS, P=0.5889, Two-tailed Mann-Whitney U test, control: n=161, DRB 40 μM: n=133).
Extended Data Figure 8.
Extended Data Figure 8.. ADARs mediate micronuclei DNA damage.
(a) ADAR1 and ADAR2 are required for MN DNA damage in MDA5 KO TP53 KO (control) RPE-1 cells. Aggregated data from three or more replicates of the experiment to detect MN DNA damage in the indicated cell lines (mean with SD, **P=0.0048 (ADAR2 KO vs control), **P=0.0012 (ADAR1 KO vs ADAR1/2 KO), ****P<0.0001, Ordinary One-way ANOVA with Tukey’s multiple comparisons test. control: n=549; ADAR1 KO: n=387; ADAR2: n=318; ADAR1/2 KO: n=1266). (b) Representative images of RPE-1cells of MDA5 KO (control) and MDA5, ADAR1, ADAR2 triple KO (ADAR1/2 KO). TUNEL assay: green; γ-H2AX: red; white arrows: MN. Dotted white lines outline the PN. (c) ADAR1 and ADAR2 are required for MN DNA damage as assayed by TUNEL-labeling. Aggregated data from three or more replicates to detect MN DNA damage as in (a) above. (mean with SD, *P=0.0122, ****P<0.0001, Ordinary One-way ANOVA with Tukey’s multiple comparisons test. control: n=881; ADAR1 KO: n=531; ADAR2: n=525; ADAR1/2 KO: n=978). (d) Western blot showing ADAR1 steady-state levels in control and an ADAR1 knockout U2OS cell line. GAPDH is the loading control. (e) Western blot to detect ADAR2 from nuclear extracts after ADAR2 RNAi in MDA5 KO ADAR1 KO U2OS lines. Asterisk: background bands; histone H3 is the loading control. (f) MN DNA damage in ADAR1 KO as compared to ADAR1 KO plus ADAR2 RNAi in MDA5 KO U2OS cells (mean with 95% CI, ****P<0.0001, Ordinary one-way ANOVA with Tukey’s multiple comparisons test. control: n=131; ADAR1 KO: n=160; ADAR1 KO + ADAR2 RNAi: n=132). (g) Aggregated data from three replicates of the experiment in (f) above, to detect MN DNA damage in the indicated cell lines (mean with SD, **P=0.0013, ***P=0.0006, ****P<0.0001, Ordinary one-way ANOVA with Tukey’s multiple comparisons test. control: n=437; ADAR1 KO: n=452; ADAR1 KO + ADAR2 RNAi: n=417). (h) Western blot showing the steady-state levels of ADAR1 or ADAR2 from nuclear extracts after double knockdown of ADAR1 and ADAR2 in TP53 knockout RPE-1 cells. Left, ADAR1 levels after RNAi; Right, ADAR2 levels after RNAi. Asterisk: background bands; histone H3 is the loading control. (i) ADARs mediate micronuclei DNA damage shown by RNAi in MDA5-proficient RPE-1 cells. Aggregated data from three replicates to detect MN DNA damage in the indicated RNAi-treated TP53 KO RPE-1 cells (control), as in (h) above (mean with SD, **P=0.0017, ***P=0.0001(control vs. ADAR1 RNAi), ***P=0.0008 (ADAR1 RNAi vs. ADAR1 plus ADAR2 RNAi), **** P<0.0001, Ordinary one-way ANOVA with Tukey’s multiple comparisons test. control: n=882; ADAR1 RNAi: n=456; ADAR2 RNAi: n=573; ADAR1/2 RNAi: n=544). Note: this experiment is a control for Fig. 3i and Extended Data Fig. 8a, c. The cell line used in Fig. 3i and Extended Data Fig. 8a, c lacks MDA5 to enable survival of ADAR-deficient RPE-1 cells. The cell line used here lacks p53 but is proficient for MDA5. Therefore, MDA5 loss does not affect MN DNA damage.
Extended Data Figure 9.
Extended Data Figure 9.. Cytoplasmic localization and the catalytic activity of ADAR1 and ADAR2 are required for micronuclear DNA damage.
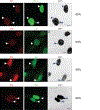
(a) Western blot to detect expression from the indicated ADAR1 add-back constructs in the indicated cell lines. GAPDH is the loading control. (b) Western blot to detect ADAR2 as in (a). GAPDH is the loading control. (c) Cytoplasmic localization of ADAR1 and ADAR2 deaminase activity is required to optimally promote MN DNA damage. Aggregated data from three or more replicates to detect MN DNA damage in the indicated cell lines with the indicated add-back constructs as in Fig. 3i (mean with SD, all the add-backs were compared with the ADAR1/2 KO unless specified on the graph. Ordinary one-way ANOVA with Tukey’s multiple comparisons test, NS, P=0.9528 (ADAR1-p150-CI vs. ADAR1/2 KO), NS, P=0.9488 (ADAR2-CI vs. ADAR1/2 KO), **P=0.0032 (ADAR2 vs. ADAR2-CI), **P=0.0032 (ADAR2 vs. ADAR2-NLS∆), ***P=0.0009 (ADAR1-p110 vs. ADAR1/2 KO),***P=0.0001(ADAR2 vs. ADAR1/2 KO), ****P<0.0001. N values from left to right: n=718, 1041, 641, 417, 182, 497, 653 and 502). ADAR1-p150 and ADAR1-p100 are different isoforms of ADAR1 p150 is primarily cytoplasmic whereas p110 is primarily nuclear. The add-back variants have the following mutations: ADAR1-p150-CI (H908N, E912A), ADAR2-CI (E396A), and ADAR2-NLSΔ (deletion of amino acids 48–72). (d) Representative immunofluorescent images showing the cellular localization of ADAR2 add-back constructs in the ADAR1/2 KO cell line. The proteins expressed from the add-back constructs are indicated on the left. White arrows: MN. (e) α-inosine signal accumulation on ruptured MN requires ADAR1 and ADAR2. Inosine FI was measured in the indicated cell lines (mean with 95% CI, NS, P=0.4863, ****P<0.0001, Ordinary one-way ANOVA with Tukey’s multiple comparisons test. control: n= 91; MPG KO: n= 155; ADAR1/2 KO: n=135). Note: The cells were treated with RNaseT1, RNaseH1 and RNaseIII and denatured before the immunofluorescence staining. See Methods Indirect immunofluorescence microscopy section for details. (f) Aggregated data from three replicates for the example shown in Extended Data Fig. 9e (mean with SD, NS, P=0.8362, ****P<0.0001, Ordinary one-way ANOVA with Dunnett’s multiple comparisons test. control: n=448; MPG KO: n=882; ADAR1/2 KO: n=373). (g) High level α-inosine signal in MN from MPG KO cells requires ADAR1 and ADAR2. α-inosine FI was measured in the indicated cell lines (mean with 95% CI, ****P<0.0001, Ordinary one-way ANOVA with Tukey’s multiple comparisons test. MPG KO: n=134, ADAR2 KO: n=85). Cells were treated as (e) above. (h) Aggregated data from three replicates for the example in Extended Data Fig. 9g, above (mean with SD, **** P<0.0001, two-tailed unpaired t-test. MPG KO: n=882; ADAR1/2 MPG KO: n=341).
Extended Data Figure 10.
Extended Data Figure 10.. RNA-DNA hybrids and α-inosine signal on micronuclei from MPG deficient cells; control for Fig. 4b; and TREX1 KO effect on MN DNA damage in RPE-1 cells.
(a) Overexpression of wild-type RNASEH1, but not RNASEH1-CI, suppresses MN α-inosine signal in MPG KO RPE-1 cells (mean with 95% CI, ****P<0.0001, Ordinary one-way ANOVA with Tukey’s multiple comparisons test. RNASEH1: n=91; RNASEH1-CI: n=121). (b) Aggregated data from three replicates of the experiment in (a) above (mean with SD, two-tailed unpaired t-test, ***P=0.0006, RNASEH1: n=404; RNASEH1-CI: n=348). (c) MPG does not cleave bases from dsDNA, RNA:DNA hybrid, or dsRNA lacking dI or I. Images of Urea-PAGE gels from experiments where MPG and APE1 were incubated with the indicated substrates lacking dI or I, performed as in Fig. 4b. Nucleic acids are visualized with SYBR Gold. Shown is one example of three similar replicate experiments. This is a control experiment showing that there is no cleavage for any RNA or DNA-containing substrate if there is no nucleotide with a hypoxanthine base. (d) Western blot showing TREX1 steady state levels in control and knockout clones. GAPDH is the loading control. (e) The absence of TREX1 does not reduce MN DNA damage. MN γ-H2AX FI measurements for control and two TREX1 KO clones synchronized as in Fig. 1a (mean with 95% CI, *P=0.0466, **P<0.0015, Ordinary one-way ANOVA with Dunnett’s multiple comparisons test. control: n=190; TREX1 KO1: n=155; TREX1 KO 2: n=166). The TREX1 KO clones display a subtle increase in DNA damage relative to controls.
Figure 1.
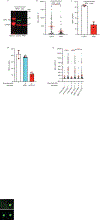
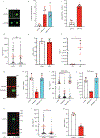
Figure 1.. The APE1 endonuclease is required for DNA damage in micronuclei.
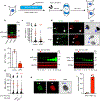
(a) Scheme of the procedure for cell synchronization and the induction of micronuclei. For RNAi treatments, siRNAs were transfected 24 hours prior to synchronization. For conditional protein degradation, doxycycline (dox), synthetic auxin IAA (3-indoleacetic acid), and asunaprevir (ASV) were added with RO-3306 (CDK1i). MPS1i is NMS-P715. (b) Representative western blot showing APE1-AID-SMASh degradation. Note that prior to drug addition, the SMASh tag is auto-cleaved, leaving the APE1-AID fusion. Control: no drugs; -APE1: 1 hour drug treatment (Dox, IAA and ASV). GAPDH is the loading control. (c) MN γ-H2AX fluorescence intensity (FI, arbitrary units) with or without APE1 degradation (mean with 95% CI, ****P<0.0001, Two-tailed Mann-Whitney U test, control: n=145; -APE: n=150). (d) Representative images of cells with or without APE1 depletion. TUNEL assay: green; γ-H2AX: red; white and blue arrows: MN. Dotted white lines outline the PN. Unless otherwise indicated, all scale bars in this study: 10 μm unless specified. (e) % TUNEL positive MN with or without APE1 depletion (mean with SD, ****P<0.0001, two-tailed unpaired t-test, 4 independent experiments, control: n=506, -APE1: n=540). % positive, here, and throughout the paper is >3 SD above the background subtracted primary nucleus signal. (f) Western blot showing induced-expression of APE1 or APE1-CI (catalytic inactive variant, H309N) after APE1-AID-SMASh degradation. Note: although APE1-CI is expressed at lower levels than exogenous APE1, its steady state levels are higher than endogenous APE1. GAPDH is the loading control. M, molecular markers. (g) MN γ-H2AX FI for the indicated samples (mean with 95% CI, add-back samples were compared with the no degradation control. NS, P=0.1046, ****P<0.0001, Ordinary one-way ANOVA with Dunnett’s multiple comparisons test. control: n=288; APE1-WT add-back: n=177; APE1-CI add-back: n=280). (h) Representative immunofluorescence image of another catalytic inactive APE1 variant (APE1-SO: D283A, D308A). Add-back and induction as in Fig. 1f. NE rupture detected by the loss of RFP-NLS. White and blue arrows: MN. (i) % MN with accumulation of APE1-SO as in (h) above, (mean with SD, ***P=0.0002, two-tailed unpaired t-test, 3 experiments, control: n= 121; APE1-SO: n=198).
Figure 2.
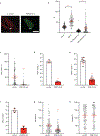
Figure 2.. MPG is required for DNA damage in micronuclei.
(a) RNAi screen of the 11 DNA glycosylases for their requirement in generating MN DNA damage. RPE-1 cells were synchronized as in Fig. 1a. (mean with SD; ****P<0.0001, Ordinary one-way ANOVA with Dunnett’s multiple comparisons test; >3 independent experiments for each RNAi treatment. N values from left to right: n=658, 377, 276, 305, 303, 302, 288, 346, 318, 322, 291, 460. P values for each sample left to right compared to the control: 0.9997, 0.9968, >0.9999, 0.9996, 0.9998, 0.9960, 0.8283, 0.9997, 0.4312, 0.9998, and <0.0001). (b) MPG accumulates on ruptured MN. Genotype is indicated on the left. HA-tagged MPG is expressed from the CMV promoter. % MN visibly positive for MPG are shown on the right. BAF accumulation was used as a marker for ruptured MN. Dotted white lines outline the PN. White and blue arrows: MN. (c) Western blot to detect MPG-AID-SMASh in RPE-1 cells synchronized as in Fig. 1a. Control: no drugs; -MPG: dox, IAA, ASV. GAPDH is the loading control. (d) Representative images of cells with or without MPG degradation. Two different DNA damage markers are used: TUNEL assay: green; γ-H2AX: red; white and blue arrows: MN. Dotted white lines outline the PN. (e) Degradation of MPG suppresses DNA damage in MN. MN γ-H2AX FI measurements for the experiment in Fig. 2c above. Shown is data from two independent MPG-AID-SMASh RPE-1 lines (mean with 95% CI, two MPG-AID-SMASh clones were compared to the no degradation control. ****P<0.0001, Ordinary one-way ANOVA with Dunnett’s multiple comparisons test. control: n=149; -MPG-1: n=112; -MPG-2: n=110). (f) Aggregated data from four replicates scoring % TUNEL positive MN, before and after MPG degradation as in Fig. 2c above (mean with SD, ****P<0.0001, two-tailed unpaired t-test, control: n=593, -MPG: n=544). (g) The catalytic activity of MPG is required for MN DNA damage. MN γ-H2AX FI measurements were made in the indicated cell lines and conditions. MPG catalytic inactive variant, MPG-CI, is MPG-E215A (mean, 95% CI, MPG KO with add-back constructs were compared to an MPG control. NS: P=0.9658; ****P<0.0001, Ordinary one-way ANOVA with Dunnett’s Multiple comparisons test. control: n=153; MPG KO: n=169; MPG add-back: n=96; MPG-CI add-back: n=117).
Figure 3.
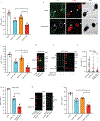
Figure 3.. ADAR-mediated deamination of RNA-DNA hybrids promotes MN DNA damage.
(a) Inverted contrast images of DAPI-stained PN and MN isolated by sequential sucrose gradients from U2OS cells. Scale bar: 50 μm. (b) Dot blot to detect I and/or dI from purified PN and MN in control and MPG KO cells. α-dsDNA is the loading control. (c) Images of α-inosine immunostaining in ruptured MN from wild type and MPG KO cells. BAF accumulation marks MN rupture. White arrows: MN. Dotted white lines outline the PN. (d) α-inosine FI in control and MPG KO cells as shown in Fig. 3c (mean with 95% CI, ****P<0.0001, Ordinary one-way ANOVA with Tukey’s multiple comparisons test. control: n=173; MPG KO: n=201). (e) Dot blot to detect RNA-DNA hybrids with S9.6 from purified PN and MN with different RNase treatments. α-dsDNA is the loading control. (f) Dot blot showing the S9.6 FI in purified PN and MN from wild-type and MPG KO U2OS cells. α-dsDNA is the loading control. (g) Overexpression of RNaseH1 suppresses DNA damage in MN. MN γ-H2AX FI measured in controls or cells overexpressing either wild-type RNaseH1 or catalytically inactive (RNaseH1-CI, D210N) cells. Induced expression of RNaseH1 or RNaseH1-CI is from a Tet-on promoter. Dox was added during the G2/M arrest as shown in Fig. 1a (mean with 95% CI, RNaseH1 and RNaseH1-CI were compared to the no dox control. NS, P=0.5763, ****P<0.0001, Ordinary one-way ANOVA with Dunnett’s multiple comparisons test. control: 108; RNASEH1: n=106; RNASEH1-CI: n=88). (h) MN γ-H2AX fluorescence intensity in EdU positive cells with or without 40 μM DRB (mean with 95% CI, ****P<0.0001, Two-tailed Mann-Whitney U test, control: n=162; DRB: n=170). (i) ADAR1 and ADAR2 independently contribute to DNA damage in MN. MN γ-H2AX FI measured in the indicated cell lines with the indicated add-back constructs (mean with 95% CI, The indicated add-back samples are compared to the control on the far left. NS, P=0.9348 for ADAR1-p150-CI add-back, NS, P=0.1555 for the ADAR2 add-back, NS, P=0.9634 for the ADAR2-CI add-back, ****P<0.0001, **P=0.001 Ordinary one-way ANOVA with Tukey’s multiple comparisons test. N values from left to the right: n=264, 162, 129, 118, 59, 81, 123). Statistical analysis showing that the rescue of the ADAR1/2 knockout by ADAR2 add-back is significant is shown in Extended Data Fig. 10c.
Figure 4.
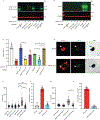
Figure 4.. MPG can remove deoxyinosine from the DNA strand of RNA:DNA hybrids.
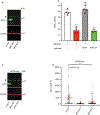
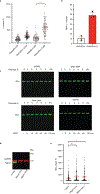
(a) Model summarizing the results of this study. Top panel from left to the right: the cellular events leading to MN DNA damage during interphase. The reason MN accumulate RNA:DNA hybrids is not known but could occur before and/or after NE ruptures. Middle panel: molecular events in MN in the top panel. Bottom panel: zoomed images with the indicated chemical structures. (b) Left. Scheme of the experiment. Right. MPG removes dI from RNA:DNA hybrids. Urea-PAGE gel images to detect specific cleavage at I or dI residues on the labeled strand. Variable times of MPG incubation are indicated, all followed by 5 minutes APE1 digestion. Cleavage efficiency is the FI of the cleavage product divided by the total FI signal in the lane. % cleavage values are averaged from three replicates. (c) Images of a-inosine dot blots showing digested products of indicated substrates by MPG for indicated amount of time.

Comment in

  • A shattering experience.
    Haber JE. Haber JE. Mol Cell. 2022 Jul 7;82(13):2360-2362. doi: 10.1016/j.molcel.2022.06.018. Mol Cell. 2022. PMID: 35803217

References

    1. Maciejowski J & Hatch EM Nuclear Membrane Rupture and Its Consequences. Annu Rev Cell Dev Biol 36, 85–114, doi:10.1146/annurev-cellbio-020520-120627 (2020). - DOI - PMC - PubMed
    1. Ly P & Cleveland DW Rebuilding Chromosomes After Catastrophe: Emerging Mechanisms of Chromothripsis. Trends Cell Biol 27, 917–930, doi:10.1016/j.tcb.2017.08.005 (2017). - DOI - PMC - PubMed
    1. Stephens PJ et al. Massive genomic rearrangement acquired in a single catastrophic event during cancer development. Cell 144, 27–40, doi:10.1016/j.cell.2010.11.055 (2011). - DOI - PMC - PubMed
    1. Korbel JO & Campbell PJ Criteria for inference of chromothripsis in cancer genomes. Cell 152, 1226–1236, doi:10.1016/j.cell.2013.02.023 (2013). - DOI - PubMed
    1. Zhang CZ et al. Chromothripsis from DNA damage in micronuclei. Nature 522, 179–184, doi:10.1038/nature14493 (2015). - DOI - PMC - PubMed