. 2022 Apr 27;20(1):94.
doi: 10.1186/s12915-022-01295-2.

Deviations from temporal scaling support a stage-specific regulation for C. elegans postembryonic development

Affiliations

Deviations from temporal scaling support a stage-specific regulation for C. elegans postembryonic development

Alejandro Mata-Cabana et al. BMC Biol. .

Abstract

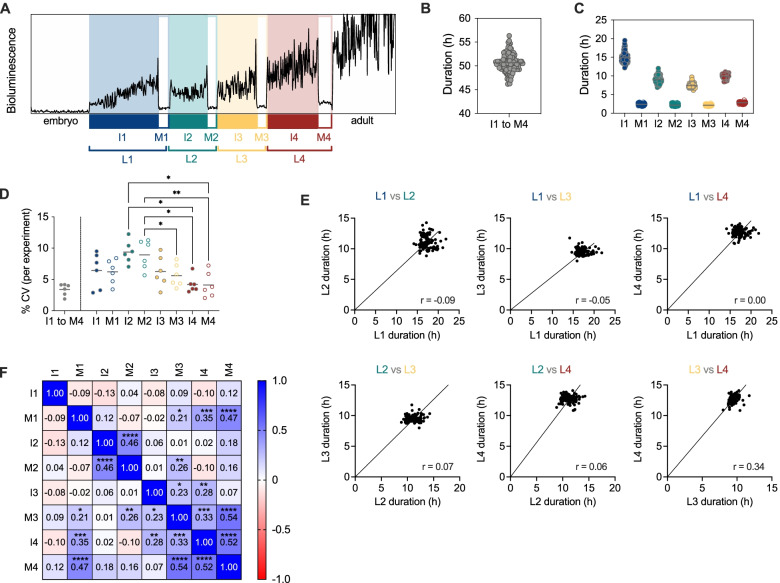
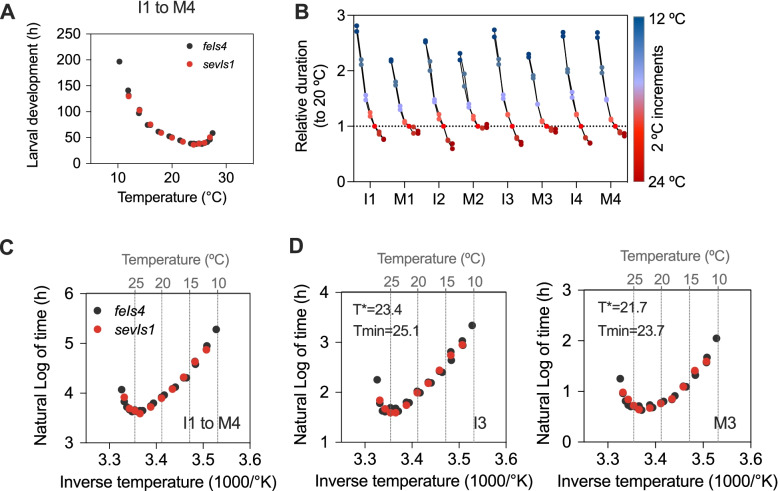
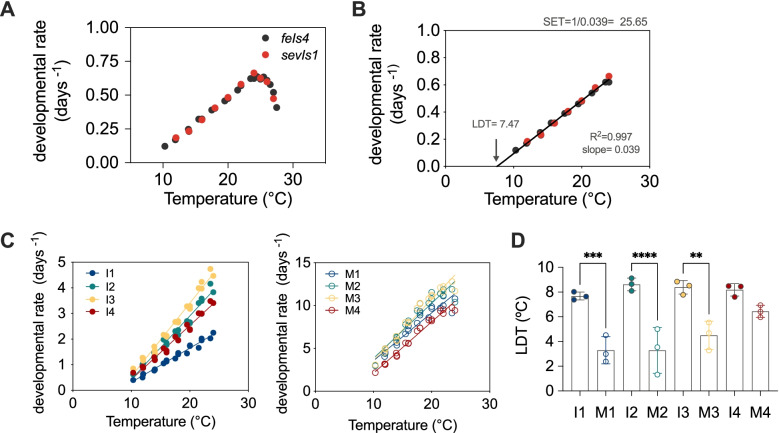
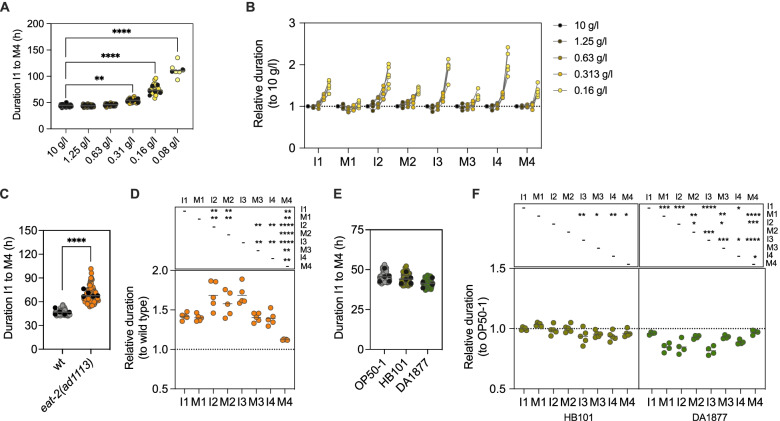
Background: After embryonic development, Caenorhabditis elegans progress through for larval stages, each of them finishing with molting. The repetitive nature of C. elegans postembryonic development is considered an oscillatory process, a concept that has gained traction from regulation by a circadian clock gene homologue. Nevertheless, each larval stage has a defined duration and entails specific events. Since the overall duration of development is controlled by numerous factors, we have asked whether different rate-limiting interventions impact all stages equally.

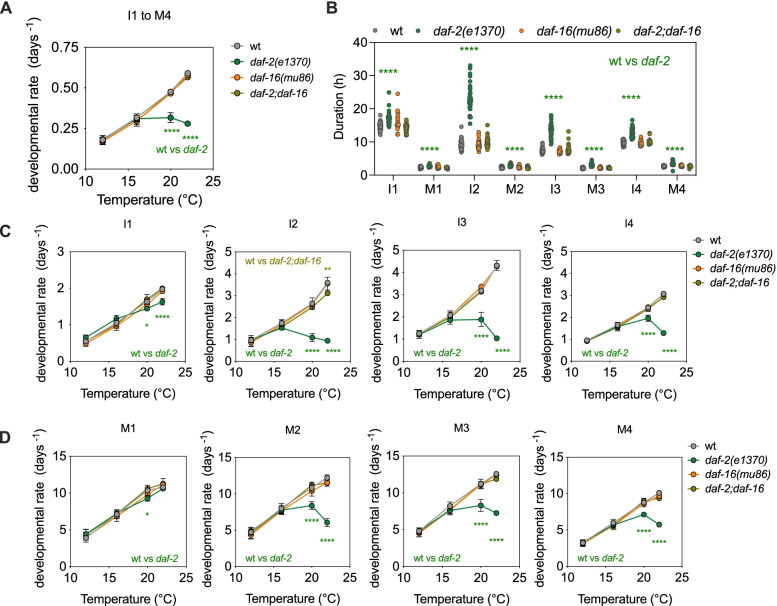
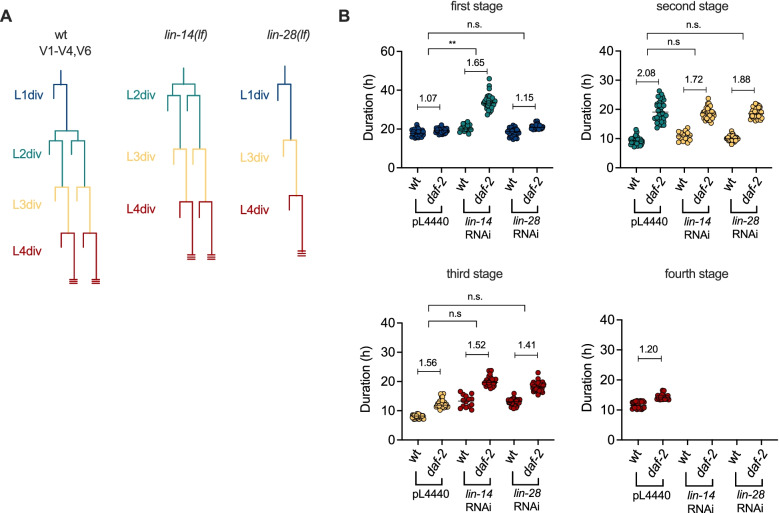
Results: We have measured the duration of each stage of development for over 2500 larvae, under varied environmental conditions known to alter overall developmental rate. We applied changes in temperature and in the quantity and quality of nutrition and analysed the effect of genetically reduced insulin signalling. Our results show that the distinct developmental stages respond differently to these perturbations. The changes in the duration of specific larval stages seem to depend on stage-specific events. Furthermore, our high-resolution measurement of the effect of temperature on the stage-specific duration of development has unveiled novel features of temperature dependence in C. elegans postembryonic development.

Conclusions: Altogether, our results show that multiple factors fine tune developmental timing, impacting larval stages independently. Further understanding of the regulation of this process will allow modelling the mechanisms that control developmental timing.

Keywords: Arrhenius; Development; Developmental rate; Insulin signalling; Nutrients; Scaling; Temperature; Timers.


Conflict of interest statement

The authors declare that they have no competing interests.

Figures

Fig. 1
Fig. 1
Quantitative analysis of development in 103 individual larvae. A Nomenclature of the different stages of development as defined by the luminometry assay. B Total duration of development, from hatching to adult ecdysis (I1 to M4) for 103 larvae at 20 °C. C Duration of each stage of development for the larvae in B. D Coefficient of variation for the complete development (I1 to M4) and for each stage independently. Each dot represents the CV of an independent experiment. Statistics show only significant results of one-way ANOVA. E Pairwise comparison of the duration of the stages for individual larvae. The line represents the linear regression of the data forced through the origin (0,0). For each correlation, the Pearson r values are shown in the relevant graph. F Pairwise correlation matrix for all combinations of developmental stages, including p values when significant. In all cases * p < 0.05, ** p < 0.01, *** p < 0.001 and **** p < 0.0001
Fig. 2
Fig. 2
Temperature dependence of C. elegans postembryonic development. All panels except B represent the data for three datasets (two reporter strains/ two independent replicates; see methods section for more details). A Duration of larval development (I1–L4) at temperatures between 10 and 27 °C. B Duration of each stage relative to the duration at 20 °C for the two datasets with the same incubations temperatures (Datasets 2 and 3). C Arrhenius plot for the duration of development (I1 to M4). D Same representation as in C for two stages of development (I3 and M3)
Fig. 3
Fig. 3
Postembryonic development deviates from developmental rate isomorphy. All panels except B represent the data for three datasets (two reporter strains/ two independent replicates; see methods section for more details). A Temperature dependence of developmental rate (1/days to complete larval development). B Calculation of LDT and SET values from the data within the linear range of temperature dependence (10 to 24 °C). C Temperature dependence of the developmental rate for each stage of development. D Lower developmental threshold (LDT) for each stage of development. Statistics show significant differences between the intermolt and molt of each stage except for I4–M4
Fig. 4
Fig. 4
Food quantity and quality have stage-specific effects on postembryonic development. A Total duration of development at different concentrations of E. coli OP50-1, from 10 to 0.08 g/l. B Duration of each stage of development relative to that at the highest concentration of food. C Duration of development of the wild-type strain and the eat-2(ad1113) mutant. D Duration of each stage of development of the eat-2 mutant relative to that of the wild-type. E Duration of development of the wild-type strain on HB101 and DA1877 diets. F Duration of each stage of development on HB101 and DA1877 diets relative to the duration on OP50-1. In A, C and E, grey or coloured markers show the values of individual animals and black dots represent the average of each experiment. The dots in B, D and F, represent relative durations calculated from the average of each experiment
Fig. 5
Fig. 5
Reduced insulin signalling predominately impacts I2 through M3. A Developmental rate of the wild-type and the mutants daf-2(e1370), daf-16(mu86) and daf-2(e1370);daf-16(mu86) at 12, 16, 20 and 22 °C. B Duration of each stage of development at 20 °C for the four strains. Each dot represents the value for a single animal. Developmental rate of intermolts (C) and molts (D) at 12, 16, 20 and 22 °C, for the wild-type and mutant strains. A–D Statistics show two-way ANOVA. All strains were compared to the wild-type, but only significant differences are shown
Fig. 6
Fig. 6
Stage-specific division patterns determine the duration of the larval stages. A Diagram of V1–V4,V6 seam cell divisions in the wild-type strain and lin-14 and lin-28 lack-of-function mutants. B Duration of each stage of larval development. The stages are plotted as first, second, third or fourth regardless of the cell fates expressed in the stage, which are indicated by the colour of the dots, as shown in A. The numbers inside the plots show the daf-2 to wild-type ratio of the duration of each stage. The results from statistical testing refer to the differences between the ratios of each different RNAi compared to the PL4440 control. The duration of all daf-2 stages is significantly different from that of the wild-type (not shown), as measured by t-test

References

    1. Schindler AJ, Baugh LR, Sherwood DR. Identification of late larval stage developmental checkpoints in Caenorhabditis elegans regulated by insulin/IGF and steroid hormone signaling pathways. PLoS Genet. 2014;10:e1004426. - PMC - PubMed
    1. Singh RN, Sulston JE. Some observations on moulting in Caenorhabditis elegans. Nematologica. 1978;24:63–71. doi: 10.1163/187529278X00074. - DOI
    1. Raizen DM, Zimmerman JE, Maycock MH, Ta UD, You Y-J, Sundaram MV, et al. Lethargus is a Caenorhabditis elegans sleep-like state. Nature. 2008;451:569–72. doi: 10.1038/nature06535. - DOI - PubMed
    1. Kim DH, Grün D, van Oudenaarden A. Dampening of expression oscillations by synchronous regulation of a microRNA and its target. Nat Genet. 2013;45:1337–1344. doi: 10.1038/ng.2763. - DOI - PMC - PubMed
    1. Hendriks G-J, Gaidatzis D, Aeschimann F, Großhans H. Extensive oscillatory gene expression during C. elegans larval development. Mol Cell. 2014;53:380–92. - PubMed

Publication types

MeSH terms

Substances

LinkOut - more resources