. 2022 Apr 28;41(1):158.
doi: 10.1186/s13046-022-02365-7.

Hypomethylation-mediated upregulation of the WASF2 promoter region correlates with poor clinical outcomes in hepatocellular carcinoma

Affiliations

Hypomethylation-mediated upregulation of the WASF2 promoter region correlates with poor clinical outcomes in hepatocellular carcinoma

Hye Ri Ahn et al. J Exp Clin Cancer Res. .

Abstract

Background: Hepatocellular carcinoma (HCC) is one of the most common and lethal cancers worldwide. Wiskott-Aldrich syndrome protein family member 2 (WASF2) is an integral member of the actin cytoskeleton pathway, which plays a crucial role in cell motility. In this study, we aimed to explore the role of WASF2 in HCC carcinogenesis and its regulatory mechanism.

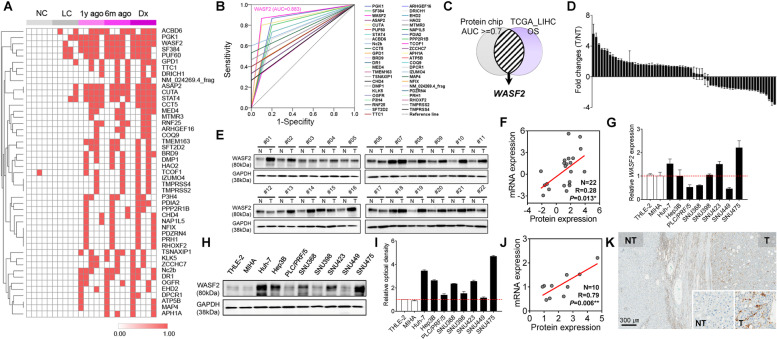
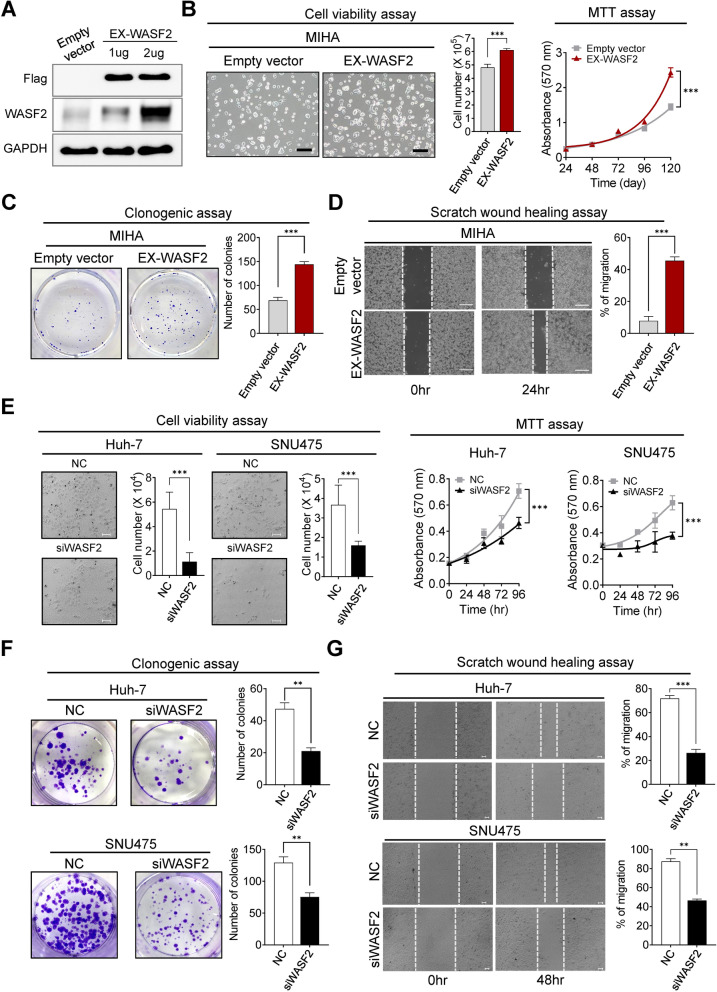
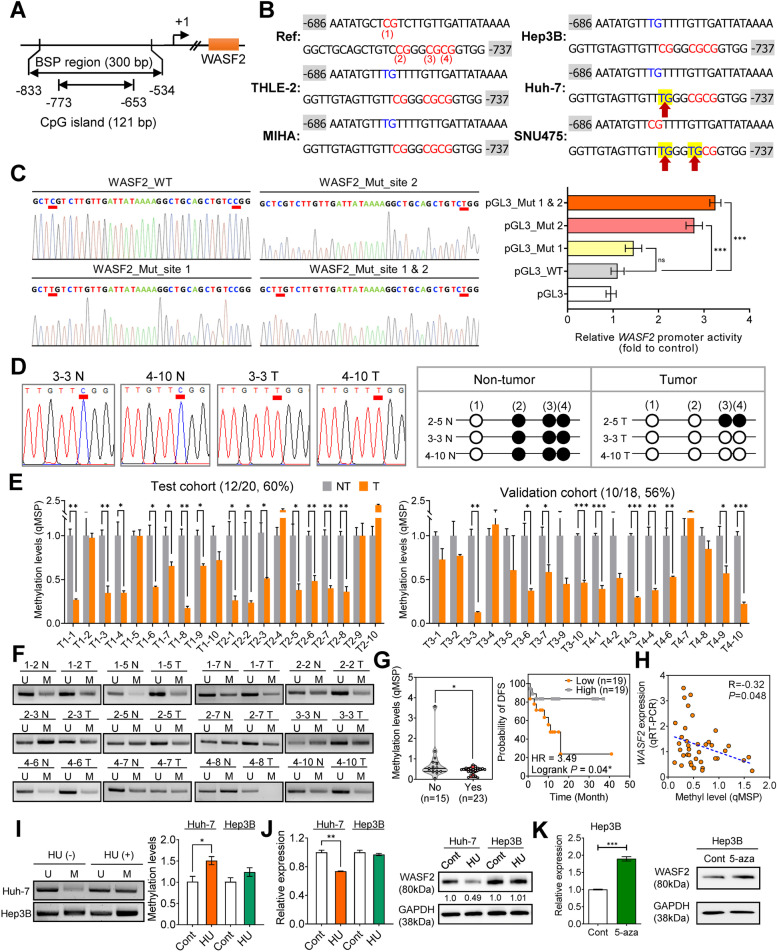
Methods: WASF2 expression in HCC was analyzed using six public RNA-seq datasets and 66 paired tissues from patients with HCC. The role of WASF2 in normal hepatocyte cell phenotypes was evaluated using a WASF2 overexpression vector in vitro; it was evaluated in HCC cell phenotypes using small interfering RNA (siRNA) in vitro and in vivo. Epigenetic regulatory mechanism of WASF2 was assessed in the Cancer Genome Atlas liver hepatocellular carcinoma project (TCGA_LIHC) dataset and also validated in 38 paired HCC tissues. Site mutagenesis, bisulfite sequencing polymerase chain reaction (BSP), methylation-specific polymerase chain reaction (MSP), and quantitative MSP (qMSP) were used for evaluating WASF2 methylation status.

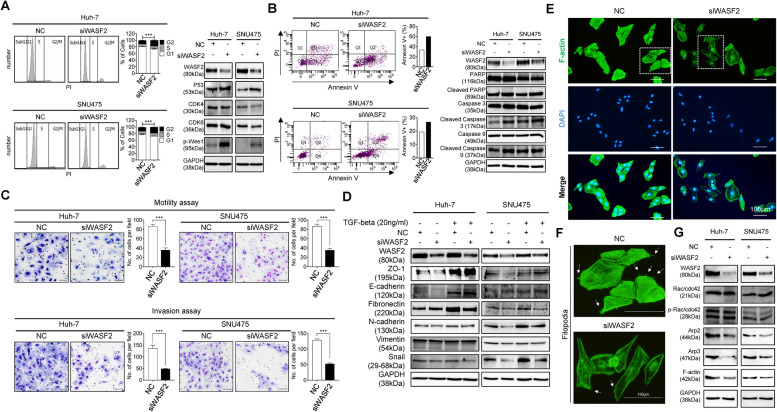
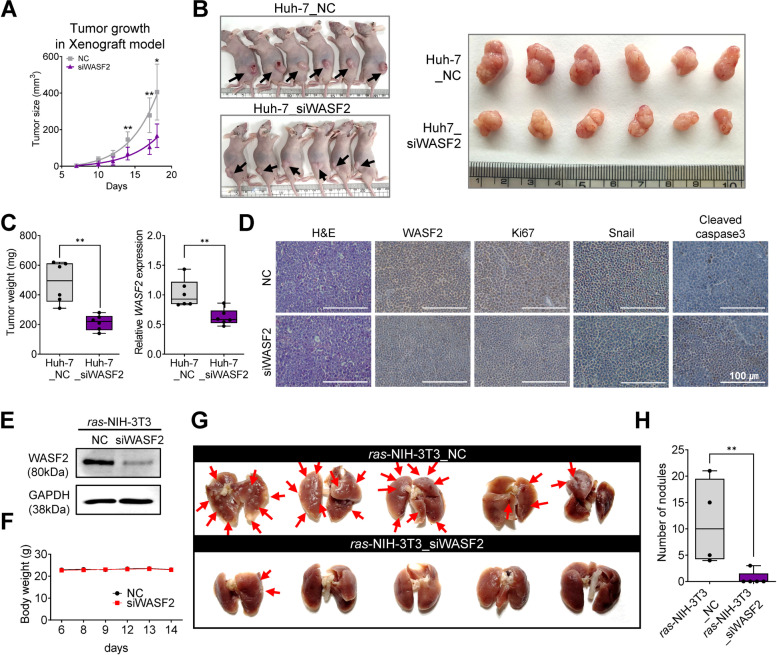
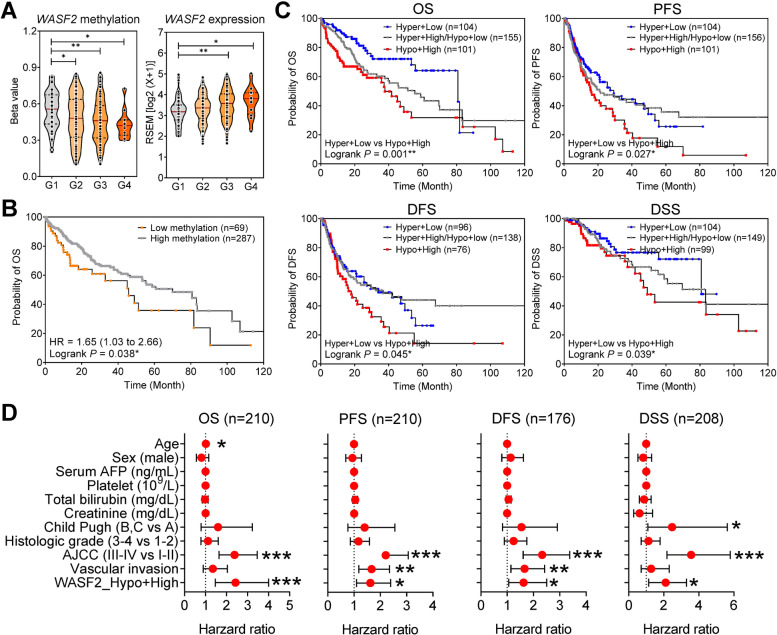
Results: WASF2 is overexpressed in HCC and is clinically correlated with its prognosis. WASF2 overexpression promoted normal hepatocyte proliferation. WASF2 inactivation decreased the viability, growth, proliferation, migration, and invasion of Huh-7 and SNU475 HCC cells by inducing G2/M phase arrest. This induced cell death and inhibited epithelial-mesenchymal transition, hindering actin polymerization. In addition, WASF2 knockdown using siWASF2 in a xenograft mouse model and a lung metastasis model exerted tumor suppressive effect. There was a negative correlation between WASF2 methylation status and mRNA expression. The methylation pattern of CpG site 2 (- 726 bp), located in the WASF2 promoter, plays an important role in the regulation of WASF2 expression. Furthermore, the cg242579 CpG island in the WASF2 5' promoter region was hypomethylated in HCC compared to that in the matched non-tumor samples. Patients with high WASF2 methylation and low WASF2 expression displayed the highest overall survival.

Conclusions: WASF2 is overexpressed and hypomethylated in HCC and correlates with patient prognosis. WASF2 inactivation exerts anti-tumorigenic effects on HCC cells in vitro and in vivo, suggesting that WASF2 could be a potential therapeutic target for HCC.

Keywords: Carcinogenesis; DNA methylation; Liver neoplasms; Prognosis; WASF2.


Conflict of interest statement

The authors declare that they have no competing interests.

Figures

Fig. 1
Fig. 1
Identification of potential HCC driver markers using a 22 K human protein microarray system and clinical relevance of WASF2 overexpression. A Heatmap of 47 differentially expressed autoantibodies from normal and liver cirrhosis to HCC (NC, normal control; LC, liver cirrhosis; 1 y ago, 1 year ago; 6 m ago, 6 months ago; Dx, HCC diagnosis). B ROC analysis of 47 autoantibodies. C Venn diagram analysis of the ROC result for 47 autoantibodies and OS from TCGA_LIHC. D Bar chart shows the fold change in tumor (T) versus non-tumor (NT) WASF2 expression in 66 matched pairs of human HCC tissues and corresponding noncancerous adjacent liver tissues. E Western blot analysis of WASF2 in 22 matched pairs of human HCC tissues with corresponding noncancerous adjacent liver tissues. F Correlation analysis between mRNA and protein expression of WASF2 in HCC tissues (n = 22, Pearson’s correlation coefficient, r = 0.28, P = 0.013). G WASF2 mRNA and protein expression in two immortalized non-transformed hepatocyte cells (THLE-2 and MIHA) and eight HCC cell lines analyzed using qRT-PCR and H western blot analysis. I Graph chart shows the ratio of the relative density of WASF2 protein expression normalized to that GAPDH. J Correlation analysis between WASF2 mRNA and protein expression in normal liver cells and HCC cell lines (n = 10, Pearson’s correlation coefficient, r = 0.79, P = 0.006). K Representative IHC photomicrographs of WASF2 in HCC (T, tumor tissues; NT, non-tumor tissues). Scale bar = 300 μm. *< 0.05; **P < 0.01
Fig. 2
Fig. 2
The oncogenic effect of WASF2 overexpression in normal hepatocytes and the anti-tumorigenic effects of WASF2 knockdown in HCC cells. A Representative western blot of the Flag and WASF2 expression in MIHA cells transfected with Empty vector or different concentrations of EX-WASF2. B Left: Representative morphology and number of MIHA cells transfected with Empty vector or EX-WASF2. Scale bar = 100 μm. Cell number was counted using trypan blue (mean ± SEM, n = 3, unpaired t-test). Right: Cell growth was measured using MTT assay. (mean ± SEM, n = 3, unpaired t-test). C Clonogenic and D scratch wound healing assays were performed in MIHA cells transfected with Empty vector or EX-WASF2. (mean ± SEM; n = 3, unpaired t-test). Scale bar = 100 μm. E Growth analyses. Left: morphology and number of Huh-7 and SNU475 cells transfected with NC or siWASF2. Scale bar = 100 μm. Cell number was counted using trypan blue (mean ± SEM, n = 3, unpaired t-test). Right: MTT assay (mean ± SEM, n = 3, unpaired t-test). F Clonogenic and G scratch wound healing assay in Huh-7 and SNU475 cells. Clonogenic assay: left, representative colony images; right, graphical representation of colony number from three random images (mean ± SEM; n = 3). Wound healing assay: left, representative images; right, graphical representation of the percentage of migrated cells from three random images (mean ± SEM; n = 3, unpaired t-test). Scale bar = 10 μm. **P < 0.01; ***P < 0.001
Fig. 3
Fig. 3
Regulatory effect of WASF2 on cell cycle, apoptosis, EMT, and actin polymerization. A Cell cycle analysis in Huh-7 and SNU475 cells following siWASF2 transfection, using flow cytometry. The percentage of cells in G2/M phase was analyzed using a FACSAria III flow cytometer. Western blot analyses of cell-cycle modulators in two HCC cell lines (mean ± SEM; n = 3, unpaired t-test). B Apoptosis analysis using flow cytometry. Dot plots indicate apoptosis ratios using PI and FITC-annexin V (left). Bar graph shows average percentage of apoptotic cells (right). Western blot analysis of PARP, cleaved PARP, caspase-3, cleaved caspase-3, caspase-9, and cleaved caspase-9. GAPDH was used as the loading control. C Representative cell images and bar charts showing the number of migrating and invading cells transfected with siWASF2 captured in three random fields following modified Boyden chamber motility assay (top) and Transwell invasion assay (bottom; mean ± SEM; n = 3, unpaired t-test). Scale bar = 50 μm. D Western blot analysis of EMT molecules in the presence or absence of TGF-β1 (20 ng/mL) in Huh-7 and SNU475 cells. E IF staining of F-actin and F Filopodia formation (white arrows) in SNU475 cells transfected with negative-control siRNA (NC) or siWASF2. Representative fluorescence images are shown. Scale bar = 100 μm. G Western blot analysis of molecules related to the actin cytoskeleton in Huh-7 and SNU475 cells. ***P < 0.001
Fig. 4
Fig. 4
WASF2 suppression attenuates HCC tumorigenesis and metastatic in vivo. A Tumor growth in mice injected subcutaneously with Huh-7 cells inactivating WASF2 (n = 6 per group; unpaired t-test). B Mouse images (left) and mass images of xenograft mouse model established with Huh-7 cells transfected with negative control siRNA and siWASF2 (right). The arrows indicate tumor mass. C Box plot of tumor weight in two groups (left) and box plot of WASF2 expression in xenograft tumor tissues assayed using qRT-PCR (right, n = 6 per group; unpaired t-test). D Representative images of H&E and IHC staining for WASF2, Ki-67, Snail, and cleaved caspase-3 in xenograft tumors derived from negative-control siRNA (NC) or siWASF2 transfected Huh-7 cells. Scale bar = 100 μm. E The efficiency of siWASF2 in ras-NIH-3 T3 cells and F body weight among the two groups of mice (n = 5 per group; unpaired t-test). G Representative in vivo images of nodules (arrow) 14 days after injection of transfected ras-transformed NIH-3 T3 cells with negative control siRNA (n = 5) or siWASF2 (n = 5) using a lung metastasis mouse model. H The number of nodules on the surface of the mouse lungs was counted. *P < 0.05; **P < 0.01. Data were shown as mean ± SEM
Fig. 5
Fig. 5
Oncogenic WASF2 activation mechanism by methylation in HCC. A The genomic locale of WASF2 and the CpG island in its promoter region. Arrow indicates transcriptional start site. The CpG island region was predicted using MethPrimer and the regions analyzed by BSP are indicated. B Sequence detail of the BSP regions (− 833 to − 534 bp) in the WASF2 gene promoter. CpG dinucleotides (CG) in this region are indicated in red capitals and numbered 1–4. Methylation status of CpGs in the WASF2 promoter region in HCC cell lines. Red arrows: sites specifically unmethylated in HCC cells . C BSP image for four luciferase reporter vectors, containing wild type, site 1 mutation only, site 2 mutation only, and site 1 & 2 mutation, respectively. Red underscore indicates mutation site (left). Promoter activity of wild-type WASF2 (pGL3_WT) and mutated WASF2 (pGL3_Mut 1 and 2), analyzed by luciferase assay (right). D Representative direct sequencing of the BSP image (left) and dot plots of methylation status of CpG site 2 (− 726 bp) in human HCC tissues (right). White and black dots indicate unmethylated and methylated CpGs, respectively. E Bar chart of CpG methylation in the WASF2 promoter in the test cohort (top; n = 20) and validation cohort (bottom; n = 18) determined by MSP in paired tumor (T) and non-tumor (NT) tissues. F Representative gel images of MSP results. Primers are specific for unmethylated (U) or methylated (M) DNA. G Violin plot (left) of WASF2 methylation based on the vascular invasion status of the test and validation cohorts [without invasiveness, No (n = 15); with invasiveness, Yes (n = 23); * P < 0.05]. Disease-free survival of HCC patients with low or high WASF2 DNA methylation (right). P values determined by the log-rank test. H Correlation of WASF2 methylation status and its expression in 66 HCC tissues. I Methylation status (left) and levels (right) of WASF2 in Huh-7 and Hep3B cells with/without HU treatment. J WASF2 mRNA (left) and protein (right) expression in Huh-7 and Hep3B cells with/without HU treatment. K WASF2 mRNA and protein expression in Hep3B cells with/without 5-aza treatment. *P < 0.05; **P < 0.01; ***P < 0.001
Fig. 6
Fig. 6
Clinical association between WASF2 methylation and overexpression. A Differences in cg24162579 CpG site methylation in the WASF2 promoter region according to HCC tumor grade (left). Differences in WASF2 expression according to HCC tumor grade (right). B Overall survival curves according to cg24162579 CpG site methylation in TCGA_LIHC dataset. C Overall survival, progression-free survival, disease-free survival, and disease-specific survival curves according to the level of WASF2 methylation and expression in the TCGA_LIHC dataset. D Forest plot of univariate Cox regression analyses of clinical parameters on overall survival, progression-free survival, disease-free survival, and disease-specific survival *P < 0.05; **P < 0.01; ***P < 0.001. HCC differentiation was defined using the Edmondson grade scale (grade 1, G1; grade 2, G2; grade 3, G3; and grade 4, G4)

Similar articles

Cited by

References

    1. Massarweh NN, El-Serag HB. Epidemiology of hepatocellular carcinoma and intrahepatic cholangiocarcinoma. Cancer Control. 2017;24. 10.1177/1073274817729245. - PMC - PubMed
    1. Global Burden of Disease Liver Cancer Collaboration. Akinyemiju T, Abera S, Ahmed M, Alam N, Alemayohu MA, et al. The burden of primary liver cancer and underlying etiologies from 1990 to 2015 at the global, regional, and national level: results from the global burden of disease study 2015. JAMA Oncol. 2017;3:1683–1691. doi: 10.1001/jamaoncol.2017.3055. - DOI - PMC - PubMed
    1. Heinrich S, Craig AJ, Ma L, Heinrich B, Greten TF, Wang XW. Understanding tumour cell heterogeneity and its implication for immunotherapy in liver cancer using single-cell analysis. J Hepatol. 2021;74:700–715. doi: 10.1016/j.jhep.2020.11.036. - DOI - PubMed
    1. Machesky LM, Mullins RD, Higgs HN, Kaiser DA, Blanchoin L, May RC, et al. Scar, a WASp-related protein, activates nucleation of actin filaments by the Arp2/3 complex. Proc Natl Acad Sci U S A. 1999;96:3739–3744. doi: 10.1073/pnas.96.7.3739. - DOI - PMC - PubMed
    1. Yan C, Martinez-Quiles N, Eden S, Shibata T, Takeshima F, Shinkura R, et al. WAVE2 deficiency reveals distinct roles in embryogenesis and Rac-mediated actin-based motility. EMBO J. 2003;22:3602–3612. doi: 10.1093/emboj/cdg350. - DOI - PMC - PubMed

Substances