. 2022 Apr 27;12(1):48.
doi: 10.1186/s13578-022-00783-w.

Pharmacological activation of ATF6 remodels the proteostasis network to rescue pathogenic GABAA receptors

Affiliations

Pharmacological activation of ATF6 remodels the proteostasis network to rescue pathogenic GABAA receptors

Meng Wang et al. Cell Biosci. .

Abstract

Background: Genetic variants in the subunits of the gamma-aminobutyric acid type A (GABAA) receptors are implicated in the onset of multiple pathologic conditions including genetic epilepsy. Previous work showed that pathogenic GABAA subunits promote misfolding and inefficient assembly of the GABAA receptors, limiting receptor expression and activity at the plasma membrane. However, GABAA receptors containing variant subunits can retain activity, indicating that enhancing the folding, assembly, and trafficking of these variant receptors offers a potential opportunity to mitigate pathology associated with genetic epilepsy.

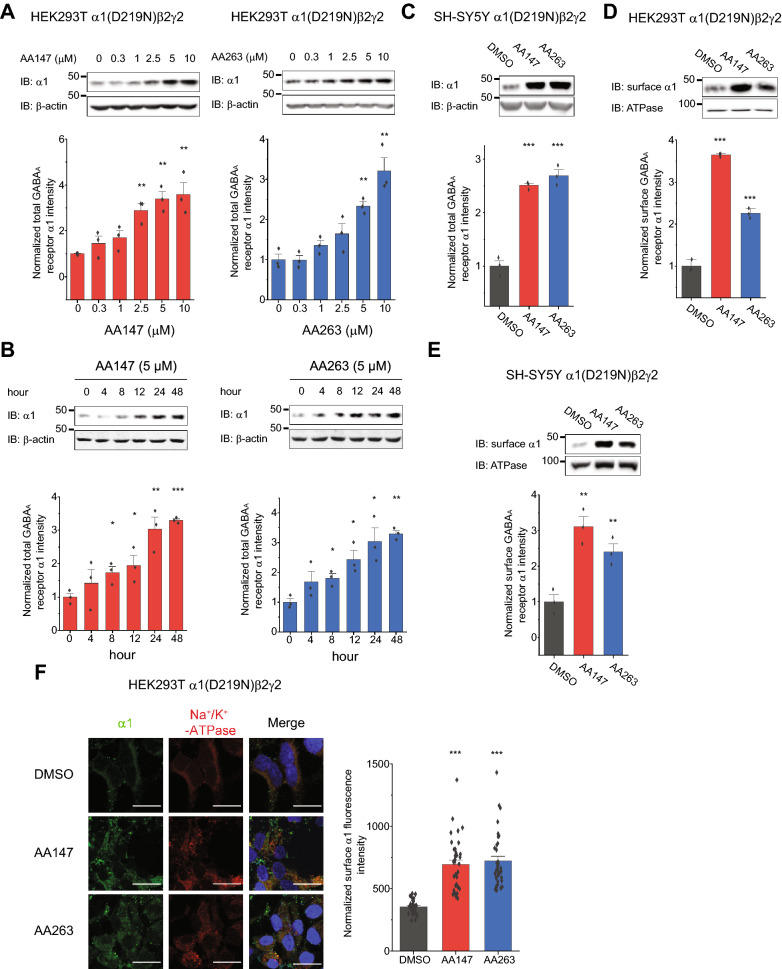
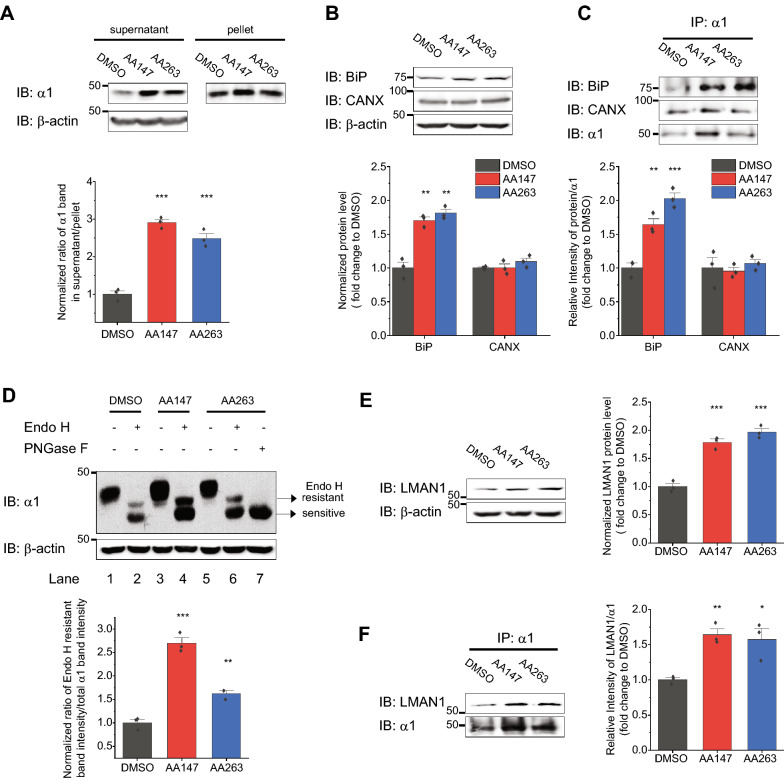
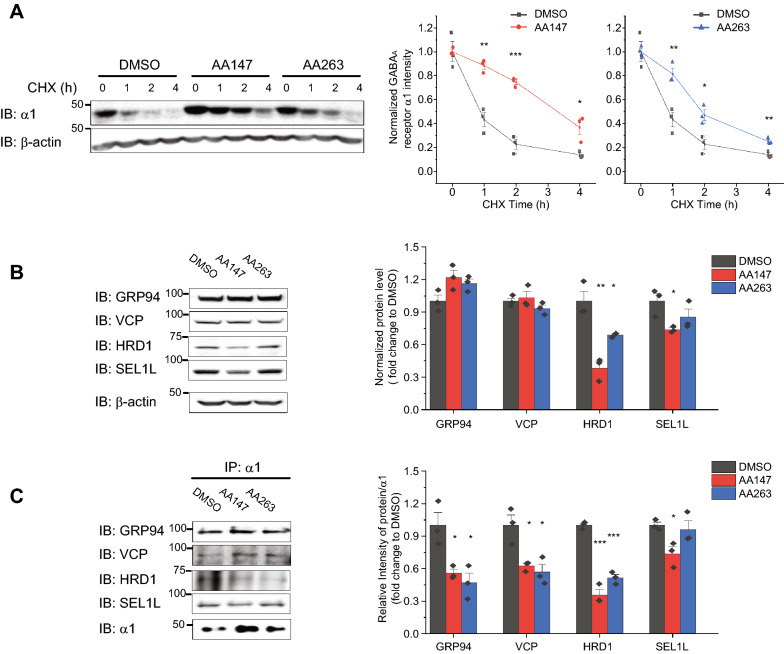
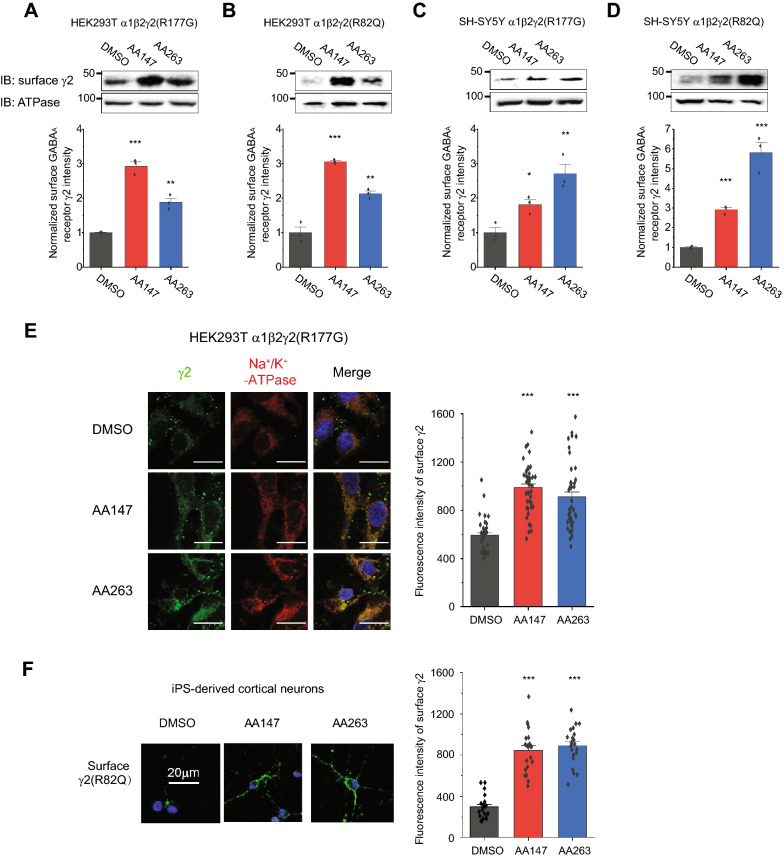
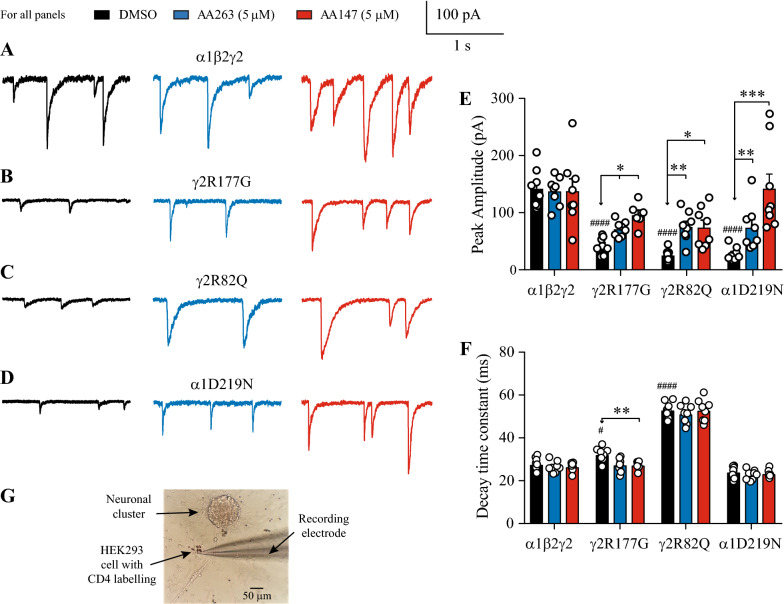
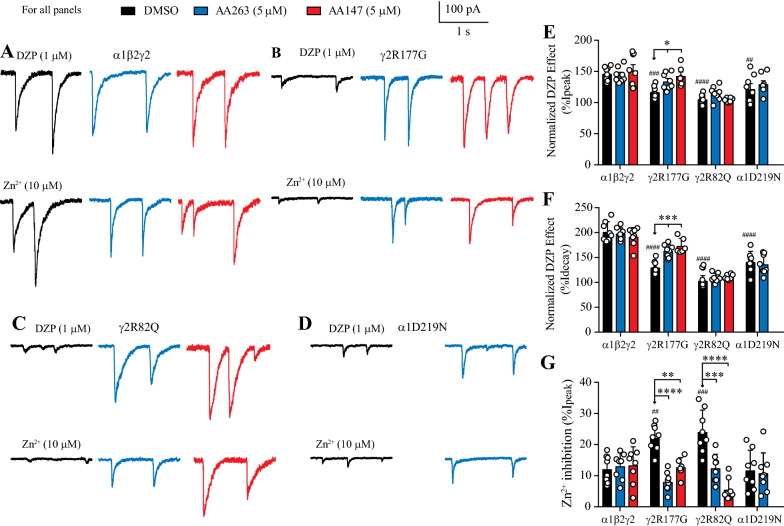
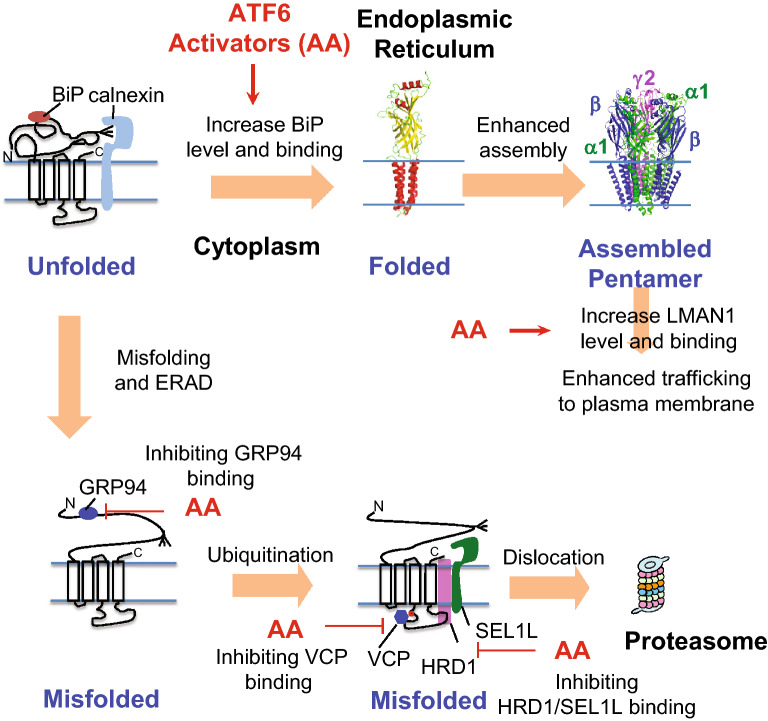
Results: Here, we demonstrate that pharmacologically enhancing endoplasmic reticulum (ER) proteostasis using small molecule activators of the ATF6 (Activating Transcription Factor 6) signaling arm of the unfolded protein response (UPR) increases the assembly, trafficking, and surface expression of variant GABAA receptors. These improvements are attributed to ATF6-dependent remodeling of the ER proteostasis environment, which increases protein levels of pro-folding ER proteostasis factors including the ER chaperone BiP (Immunoglobulin Binding Protein) and trafficking receptors, such as LMAN1 (Lectin Mannose-Binding 1) and enhances their interactions with GABAA receptors. Importantly, we further show that pharmacologic ATF6 activators increase the activity of GABAA receptors at the cell surface, revealing the potential for this strategy to restore receptor activity to levels that could mitigate disease pathogenesis.

Conclusions: These results indicate that pharmacologic ATF6 activators offer an opportunity to restore GABAA receptor activity in diseases including genetic epilepsy and point to the potential for similar pharmacologic enhancement of ER proteostasis to improve trafficking of other disease-associated variant ion channels implicated in etiologically-diverse diseases.


Conflict of interest statement

RLW and JWK are inventors on patents describing ATF6 activator compounds, including AA147 and AA263. RLW and JWK are also shareholders and scientific advisory board members of Protego Biopharma who have licensed the ATF6 activators AA147 and AA263.

Figures

Fig. 1
Fig. 1
Effect of AA147 and AA263 on the total and surface protein levels of trafficking-deficient mutant GABAA receptors. A Dose–response analysis of AA147 and AA263 treatment (24 h) on the total protein levels of α1(D219N) subunits in HEK293T cells expressing α1(D219N)β2γ2 GABAA receptors. B Time-course analysis of AA147 (5 µM) and AA263 (5 µM) treatment on the total protein levels of α1(D219N) subunits in HEK293T cells expressing α1(D219N)β2γ2 GABAA receptors. C Effect of AA147 (2.5 µM, 24 h) and AA263 (2.5 µM, 24 h) on the total protein level of α1(D219N) subunits in neuronal SH-SY5Y cells stably expressing α1(D219N)β2γ2 GABAA receptors. β-actin serves as total protein loading control. D Effect of AA147 (5 µM, 24 h) and AA263 (5 µM, 24 h) on the surface protein expression of the α1(D219N) subunits in HEK293T cells stably expressing α1(D219N)β2γ2 GABAA receptors according to surface biotinylation analysis. E Effect of AA147 (2.5 µM, 24 h) and AA263 (2.5 µM, 24 h) on the surface protein expression of the α1(D219N) subunits in neuronal SH-SY5Y cells stably expressing α1(D219N)β2γ2 GABAA receptors according to surface biotinylation analysis. Na+/K+-ATPase serves as membrane protein loading control. Quantification of the band intensities is shown on the bottom panels (n = 3). F HEK293T cells stably expressing α1(D219N)β2γ2 receptors were treated with DMSO vehicle control, AA147 (5 µM, 24 h) or AA263 (5 µM, 24 h). Surface α1 staining was in green (column 1), and plasma membrane marker Na+/K+-ATPase staining in red (column 2). Merge of these two signals and nucleus staining by DAPI in blue was shown in column 3. Scale bar = 20 μm. Quantification of the fluorescence intensity of the surface subunits from 30–40 cells per condition is shown on the right. IB: immunoblotting. Each data point is reported as mean ± SEM. One-way ANOVA followed by post-hoc Tukey test was used for statistical analysis. *, p < 0.05; **, p < 0.01; ***, p < 0.001
Fig. 2
Fig. 2
AA147 and AA263 enhance the folding and trafficking of the α1(D219N) subunit. A Effect of AA147 (5 µM, 24 h) and AA263 (5 µM, 24 h) on the folding of α1(D219N) subunits in HEK293T cells stably expressing α1(D219N)β2γ2 GABAA receptors. Cells were lysed in Tris-buffered saline with 2 mM n-Dodecyl-β-D-maltoside (DDM) supplemented with Roche protease inhibitor cocktail. The detergent insoluble fractions were re-suspended with SDS sample loading buffer and then subjected to SDS-PAGE and western blot analysis. Quantification of the detergent soluble /insoluble fractions is shown on the bottom panels (n = 3). B Effect of AA147 (5 µM, 24 h) and AA263 (5 µM, 24 h) on steady-state protein levels of BiP and calnexin (CANX) in HEK293T cells stably expressing α1(D219N)β2γ2 GABAA receptors. Quantifications of the normalized band intensities are shown on the bottom (n = 3). C Effect of AA147 (5 µM, 24 h) and AA263 (5 µM, 24 h) on the interactions between α1(D219N) subunits and BiP and calnexin in HEK293T cells expressing α1(D219N)β2γ2 receptors (n = 3). Apyrase (10 units / mL), which hydrolyzes ATP, was added to the co-immunoprecipitation buffer during the co-immunoprecipitation experiments to enhance the detection of the interactions between BiP and α1(D219N). Quantification of the ratio of the target proteins and α1(D219N) post immunoprecipitation (IP) is shown in the bottom panels. D AA147 (5 µM, 24 h) and AA263 (5 µM, 24 h) increases the Endo H-resistant post-ER glycoform of the α1(D219N) subunit in HEK293T cells stably expressing α1(D219N)β2γ2 GABAA receptors. PNGase F, which cleaves all glycans from a glycoprotein, is included to indicate the unglycosylated α1 subunits. Quantification of the Endo H resistant/total α1 band intensities is shown on the bottom panels (n = 3). E Effect of AA147 (5 µM, 24 h) and AA263 (5 µM, 24 h) on steady-state protein levels of LMAN1 in HEK293T cells stably expressing α1(D219N)β2γ2 GABAA receptors. Quantifications of the normalized band intensities are shown on the right (n = 3). F Effect of AA147 (5 µM, 24 h) and AA263 (5 µM, 24 h) on the interactions between α1(D219N) subunits and LMAN1 in HEK293T cells expressing α1(D219N)β2γ2 receptors (n = 3). Quantification of the ratio of the target proteins and α1(D219N) post immunoprecipitation is shown on the right. Each data point is reported as mean ± SEM. One-way ANOVA followed by post-hoc Tukey test was used for statistical analysis. *, p < 0.05; **, p < 0.01; ***, p < 0.001
Fig. 3
Fig. 3
AA147 and AA263 reduce the degradation of the α1(D219N) subunit. A Effect of AA147 (5 µM, 24 h) and AA263 (5 µM, 24 h) on the degradation of the α1(D219N) subunit in HEK293T cells stably expressing α1(D219N)β2γ2 GABAA receptors using cycloheximide (CHX)-chase analysis. B Effect of AA147 (5 µM, 24 h) and AA263 (5 µM, 24 h) on steady-state protein levels of ERAD factors, including GRP94, VCP, HRD1, and SEL1L in HEK293T cells stably expressing α1(D219N)β2γ2 GABAA receptors. Quantification of the normalized band intensities is shown on the right (n = 3). C Effect of AA147 (5 µM, 24 h) and AA263 (5 µM, 24 h) on the interactions between α1(D219N) subunits and ERAD factors in HEK293T cells expressing α1(D219N)β2γ2 receptors. Quantification of the ratio of the target proteins and α1(D219N) post immunoprecipitation (IP) is on the right (n = 3). Each data point is reported as mean ± SEM. For statistical analysis, two-tailed Student’s t-test was used in (A), whereas one-way ANOVA followed by post-hoc Tukey test was used in B and C. *, p < 0.05; **, p < 0.01; ***, p < 0.001
Fig. 4
Fig. 4
Both AA147 and AA263 promote the surface expression of a variety of trafficking-deficient mutant GABAA receptors. AA147 (5 µM, 24 h) and AA263 (5 µM, 24 h) increase the surface protein expression of the variant γ2 subunits in HEK293T cells stably expressing α1β2γ2(R177G) (A) and α1β2γ2(R82Q) (B) GABAA receptors. AA147 (2.5 µM, 24 h) and AA263 (2.5 µM, 24 h) increase the surface protein expression of the variant γ2 subunit in neuronal SH-SY5Y cells expressing α1β2γ2(R177G) (C) and α1β2γ2(R82Q) (D) GABAA receptors according to surface biotinylation analysis. Na+/K+-ATPase serves as membrane protein loading control. Quantification of the band intensities is shown on the bottom panels (n = 3). E HEK293T cells stably expressing α1β2γ2(R177G) receptors were treated with DMSO vehicle control, AA147 (5 µM, 24 h) or AA263 (5 µM, 24 h). Surface γ2 staining was in green (column 1), and plasma membrane marker Na+/K+-ATPase staining in red (column 2). Merge of these two signals and nucleus staining by DAPI in blue was shown in column 3. Scale bar = 20 μm. Quantification of the fluorescence intensity of the surface subunits from 35–45 cells per condition is shown on the right. F Human-induced pluripotent stem cells (hiPS)-derived cortical neurons carrying the γ2(R82Q) variant were treated with DMSO vehicle control, AA147 (2.5 µM, 24 h) or AA263 (2.5 µM, 24 h). Surface γ2 staining was in green and nucleus staining by DAPI was in blue. Quantification of the fluorescence intensity of the surface subunits from 20–30 cells per condition is shown on the right. Each data point is reported as mean ± SEM. One-way ANOVA followed by post-hoc Tukey test was used for statistical analysis. *, p < 0.05; **, p < 0.01; ***, p < 0.001
Fig. 5
Fig. 5
ATF6 activators-induced changes to sIPSC peak current and decay times. A sIPSCs mediated by wild-type α1β2γ2 GABAA receptors. B sIPSCs mediated by cells transfected with α1, β2 and γ2(R177G) subunits. C sIPSCs mediated by cells transfected with α1, β2 and γ2(R82Q) subunits. D sIPSCs mediated by cells transfected with α1(D219D), β2 and γ2 subunits. E Group bar plots showing changes in sIPSC peak amplitude for the indicated GABAA receptors. F Group bar plots showing changes in sIPSC decay times for the indicated GABAA receptors. For all panels, cells were incubated with DMSO (black, left), AA263 (5 μM, 24 h, blue, middle), or AA147 (5 μM, 24 h, red, right). Event frequency was ~ 0.2 Hz in control and drug treated cells. G Image of co-culture showing a cluster of primary neurons, axonal extensions and a nearby recorded HEK293 cell that is labelled with CD4 antibody beads. Asterisks represent p values for the post-hoc comparisons of a two-way ANOVA with and without AFT6 activators exposure, where * p < 0.05, ** p < 0.01, *** p < 0.005. Number signs represent the p values for a one-way ANOVA without ATF6 activators exposure, where # p < 0.05 and #### p < 0.0001. ANOVAs are always compared to α1β2γ2 GABAA receptors
Fig. 6
Fig. 6
ATF6 activators-induced changes in sIPSC pharmacology. A sIPSCs mediated by wild-type α1β2γ2 GABAA receptors. B sIPSCs mediated by cells transfected with α1, β2 and γ2(R177G) subunits. (C) sIPSCs mediated by cells transfected with α1, β2 and γ2(R82Q) subunits. D sIPSCs mediated by cells transfected with α1(D219N), β2 and γ2 subunits. E Group bar plots showing the effect of DZP treatment on sIPSC peak amplitude for the indicated GABAA receptors. Normalized DZP effect (%Ipeak) = Ipeak (DZP) / Ipeak (control) * 100. The control Ipeak values were obtained from Fig. 5E. F Group bar plots showing the effect of DZP enhancement on sIPSC decay times for the indicated GABAA receptors. Normalized DZP effect (%Idecay) = decay time constant (DZP) / decay time constant (control) * 100. The control decay time constant values were obtained from Fig. 5F. G Group bar plots showing Zn2+ inhibition of sIPSC peak amplitude for the indicated GABAA receptors. Zn2+ inhibition (%Ipeak) = (Ipeak (control)—Ipeak (Zn2+)) / Ipeak (control) * 100. The control Ipeak values were obtained from Fig. 5E. For all panels, cells were incubated with DMSO (black, left), AA263 (5 μM, 24 h, blue, middle), or AA147 (5 μM, 24 h, red, right). Event frequency was ~ 0.2 Hz in control and drug treated cells. Asterisks represent p values for the post-hoc comparisons of a two-way ANOVA with and without AFT6 activators exposure, where * p < 0.05, ** p < 0.01, *** p < 0.005, **** p < 0.001. Number signs represent the p values for a one-way ANOVA without ATF6 activators exposure, where ##p < 0.01, ###p < 0.005 and ####p < 0.0001. ANOVAs are always compared to α1β2γ2 GABAA receptors
Fig. 7
Fig. 7
Mechanism of action of AA147 and AA263 on GABAA receptor proteostasis. AA147 and AA263 activate the ATF6 pathway to adapt the proteostasis network. They promote the folding of variant subunits by increasing BiP chaperone protein level and binding and enhance their forward trafficking by increasing LMAN1 protein level and binding. In addition, they attenuate the ERAD of variant subunits by inhibiting GRP94-HRD1/VCP-mediated degradation pathway. As a result, pharmacological activation of ATF6 increases the functional surface expression of variant GABAA receptors

Similar articles

Cited by

References

    1. Germann L, Pierce SR, Senneff TC, Burbridge AB, Steinbach JH, Akk G. Steady-state activation and modulation of the synaptic-type α1β2γ2L GABA(A) receptor by combinations of physiological and clinical ligands. Physiol Rep. 2019;7:e14230. doi: 10.14814/phy2.14230. - DOI - PMC - PubMed
    1. Lorenz-Guertin JM, Jacob TC. GABA type a receptor trafficking and the architecture of synaptic inhibition. Dev Neurobiol. 2018;78:238–270. doi: 10.1002/dneu.22536. - DOI - PMC - PubMed
    1. Braat S, Kooy RF. The GABAA receptor as a therapeutic target for neurodevelopmental disorders. Neuron. 2015;86:1119–1130. doi: 10.1016/j.neuron.2015.03.042. - DOI - PubMed
    1. X. Fu, Y. J. Wang, J. Q. Kang and T. W. Mu GABAA Receptor Variants in Epilepsy, In: Czuczwar SJ, editor. Epilepsy. Brisbane (AU): Exon Publications. Doi: 10.36255/exon-publications-epilepsy-gaba-receptor - PubMed
    1. Fu YL, Wang YJ, Mu TW. Proteostasis maintenance of cys-loop receptors. Adv Protein Chem Struct Biol. 2016;103:1–23. doi: 10.1016/bs.apcsb.2015.11.002. - DOI - PubMed

LinkOut - more resources