. 2022 Dec;71(12):2502-2517.
doi: 10.1136/gutjnl-2021-326183. Epub 2022 Apr 27.

Activation of innate-adaptive immune machinery by poly(I:C) exposes a therapeutic vulnerability to prevent relapse in stroma-rich colon cancer

Affiliations

Activation of innate-adaptive immune machinery by poly(I:C) exposes a therapeutic vulnerability to prevent relapse in stroma-rich colon cancer

Shania M Corry et al. Gut. 2022 Dec.

Abstract

Objective: Stroma-rich tumours represent a poor prognostic subtype in stage II/III colon cancer (CC), with high relapse rates and limited response to standard adjuvant chemotherapy.

Design: To address the lack of efficacious therapeutic options for patients with stroma-rich CC, we stratified our human tumour cohorts according to stromal content, enabling identification of the biology underpinning relapse and potential therapeutic vulnerabilities specifically within stroma-rich tumours that could be exploited clinically. Following human tumour-based discovery and independent clinical validation, we use a series of in vitro and stroma-rich in vivo models to test and validate the therapeutic potential of elevating the biology associated with reduced relapse in human tumours.

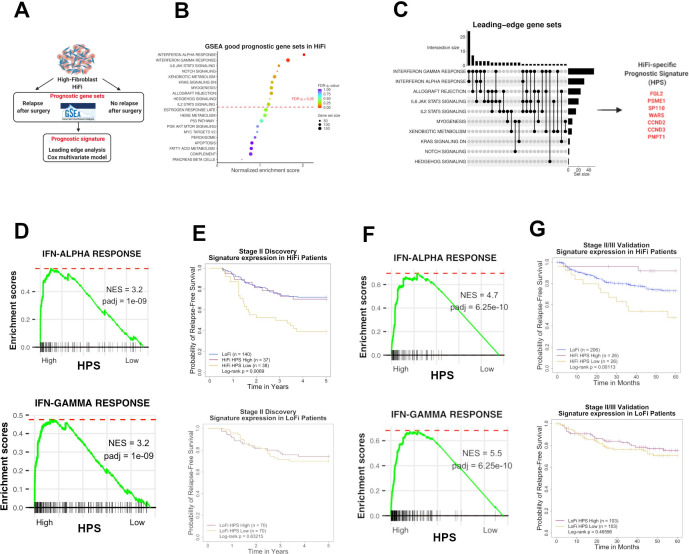
Results: By performing our analyses specifically within the stroma-rich/high-fibroblast (HiFi) subtype of CC, we identify and validate the clinical value of a HiFi-specific prognostic signature (HPS), which stratifies tumours based on STAT1-related signalling (High-HPS v Low-HPS=HR 0.093, CI 0.019 to 0.466). Using in silico, in vitro and in vivo models, we demonstrate that the HPS is associated with antigen processing and presentation within discrete immune lineages in stroma-rich CC, downstream of double-stranded RNA and viral response signalling. Treatment with the TLR3 agonist poly(I:C) elevated the HPS signalling and antigen processing phenotype across in vitro and in vivo models. In an in vivo model of stroma-rich CC, poly(I:C) treatment significantly increased systemic cytotoxic T cell activity (p<0.05) and reduced liver metastases (p<0.0002).

Conclusion: This study reveals new biological insight that offers a novel therapeutic option to reduce relapse rates in patients with the worst prognosis CC.

Keywords: ADJUVANT TREATMENT; CANCER; COLON CARCINOGENESIS; COLORECTAL CANCER.


Conflict of interest statement

Competing interests: ML has received honoraria from Pfizer, EMF Serono and Roche for presentations unrelated to this work; ML has received an unrestricted educational grant from Pfizer for research unrelated to this work. PT has received honoraria and travel expenses from BMS, Merck, Roche, Lilly and Sanofi-Aventis for contributions that are not related to the present work. The authors declare no other potential conflicts of interest.

Figures

Figure 1
Figure 1
Development and validation of our transcriptional fibroblast score. (A) Schematic of correlation between stromal/fibroblasts scores via histology and transcriptomics. (B) H&E slide with the digital pathology stromal classifier applied to a sample with a high/low percentage stroma from the focus cohort. (C) Correlation matrix with histological stroma and transcriptional classifiers (Pearson’s correlation). (D) CMS classification according to our fibroblast score. (UNK=unknown/mixed CMS classification) (t-test). (E) Waterfall plot of fibroblast scores indicating CMS classification. High-fibroblast (HiFi) n=75 and low-fibroblast (LoFi) n=140. (F) HiFi tumours have a worse prognosis than LoFi in discovery cohort (log-rank p=0.00779) (G). Comparison of HiFi and LoFi samples revealed that previously published stromal signatures and gene sets have significantly higher expression in the HiFi samples than the LoFi (adjusted p<0.15). CC, colon cancer; CMS, consensus molecular subtypes. **** denotes p<0.0001.
Figure 2
Figure 2
Identification of HiFi-specific prognostic biology (A) workflow summary of our supervised analyses. (B) Significant gene sets associated with good prognosis specifically within HiFi tumours from supervised GSEA analysis. (C) Leading-edge analysis (LEA) of the 10 gene sets demonstrating that, of the 71 genes, many of them overlap between the interferon response gene sets leading to identification of a seven gene HPS. (D) High expression of the HPS in HiFi tumours is associated with enriched IFN alpha and gamma response signalling in discovery cohort. (E) HPS has a strong prognostic value in HiFi tumours based on a median split in discovery cohort (log-rank p=0.0069; top). HPS has no prognostic value in the LoFi samples in discovery cohort (log-rank p=0.63215; bottom). (F) High expression of the HPS (n=26) in HIFI tumours is associated with enriched IFN alpha and gamma response signalling. (G) HPS can stratify HiFi samples into two groups in the validation cohort, one with significantly poorer RFS and another with RFS even better than the LoFi patients (log-rank p=0.00113; top). HPS has no prognostic value in the LoFi samples (log-rank p=0.46596; bottom). HiFi, high-fibroblast; LOFI, low-fibroblast; RFS, relapse-free survival.
Figure 3
Figure 3
Validation of HiFi-specific prognostic biology and association with STAT1 (A) Heatmap displaying upregulated and downregulated genes shared by the differential comparisons between HPS expression groups in the discovery and validation cohorts (n=26 in each subgroup; 30 upregulated and 11 downregulated genes (adjusted p<0.05; table 2)). (B) String network formed by the upregulated genes form a cluster around STAT1. (C) Cumulative gene expression of STAT1 and three of its target genes (PSMB9, IRF1 and TAP1) correlated with expression of the HPS in the discovery (left) and validation cohort (right; t-test both p<0.00001). (D) Boxplots of STAT1 gene expression (left) and protein levels (right) in HiFi patients in the CPTAC cohort according to HPS groups (high n=9 and low n=9; t-tests both p<0.05). (E) Schematic depicting the STAT1, IFN and relapse characteristics associated with the HiFi-specific prognostic signature within HiFi tumours. CPTAC, Clinical Proteomic Tumour Analysis Consortium; HiFi, high-fibroblast; HPS, HiFi-specific prognostic signature.
Figure 4
Figure 4
CRC tumour single-cell data confirms immune-specific nature of signature. (A) Gene expression of individual genes within the HPS according to a public dataset of CRC cell lineages purified by fluorescence-activated cell sorting (FACS) (n=4 populations from n=6 patients; total n=24). (B) Enrichment for APP, adaptive and innate signalling in HPS high group compared with low in HiFi tumours from the discovery cohort (left) (red=adjusted p<0.05). Correlation between ssGSEA scores for APP and HPS gene expression in the discovery cohort (Pearson’s correlation r=0.5, p=1.4e-06; right). (C) Enrichment for APP, adaptive and innate signalling in HPS high group compared with low in HiFi tumours from the validation cohort (left). Correlation between ssGSEA scores for APP and HPS gene expression in the validation cohort (Pearson’s correlation r=0.6, p=1.5e-05; right). (D) Enrichment for APP using pairwise GSEA in HPS high group compared with low in HIFI tumours from both the discovery and validation cohorts. (E, F) Immune cell populations have significantly higher expression of the HPS (E) and GO APP ssGSEA scores (F) than epithelial cells and fibroblasts (t-test both p<2.2e-16). (G) Expression levels of HPS genes and STAT1-related targets and (H) APP ssGSEA scores in bone-marrow derived macrophages with either wild-type (WT), mutant (Y701F mut) or knockout (KO) STAT1 (n=3 for each genotype) (t-test). (I) Pairwise GSEA for GO APP, interferon alpha and gamma response in WT V STAT1 KO mouse macrophages. (n=3 per genotype). APP, antigen processing and presentation; CRC, colorectal cancer; GSEA, gene set enrichment analysis; HiFi, high-fibroblast; HPS, HiFi-specific prognostic signature; ssGSEA, single-sample GSEA.
Figure 5
Figure 5
IFN and APP signalling cascades are associated with a STAT1-mediated viral/dsRNA response. (A) Activity status of key TF regulons according to HPS groups in the validation cohort (n=26 in each subgroup). (B) Top upstream regulators from an ingenuity pathway analysis (IPA) of the HPS differentially expressed genes in both the discovery and validation cohorts (table 2). (C) Enrichment for multiple viral response gene sets and dsRNA response in HPS high group compared with low in HiFi tumours in the discovery cohort (red=adjusted p<0.05; left). Correlation between ssGSEA scores for viral response and HPS gene expression in the discovery cohort (Pearson’s correlation r=0.6, p=1.1e-08; right). (D) Enrichment for multiple viral response gene sets and dsRNA response in HPS high group compared with low in HiFi tumours in the validation cohort (left) (red=adjusted p<0.05). Correlation between ssGSEA scores for viral response and HPS gene expression in the validation cohort (Pearson’s correlation r=0.7, p=2.4e-08; right). (E) Enrichment for viral response using pair-wise GSEA in non-relapse versus relapse HiFi tumours from both the discovery and validation cohorts. (F) viral response ssGSEA scores in bone-marrow derived macrophages with either wild-type (WT), mutant (Y701F mut) or knockout (KO) STAT1. (n=3 for each genotype) (t-test p<0.05). (G) Schematic detailing role for viral response/dsRNA signalling in regulating STAT1-mediated signalling cascades, HPS, APP and IFN signalling in immune lineages results in a good prognosis HiFi tumour. APP, antigen processing and presentation; CRC, colorectal cancer; ds RNA, double stranded RNA; HiFi, high-fibroblast; HPS, HiFi-specific prognostic signature; ssGSEA, single-sample GSEA; TF, transcription factor.
Figure 6
Figure 6
The TLR3 agonist poly(I:C) could be a potential treatment for HiFi (A) gene expression of HPS and STAT1 targets in human macrophages from different datasets treated with interferon (IFN) alpha (left) (n=3), IFN gamma (middle) (n=6) and poly(I:C) (right) (n=4) compared with untreated control samples (n=>3). (B) gene expression of HPS and STAT1 targets (left) and TF activity (right) in dendritic cells from mice treated with poly(I:C) (n=14) or untreated. (C) pair-wise GSEA of IFN alpha and gamma response, alongside APP gene sets in dendritic cells from mice treated with poly(I:C) or untreated. (D) Gene expression of HPS and STAT1 targets (left) and TF activity (right) in raw macrophage cells treated with poly(I:C) (n=12) or untreated. (E) Pair-wise GSEA of IFN alpha and gamma response, alongside APP gene sets in RAW macrophage cells treated with poly(I:C) or untreated. (F) Flow cytometry analysis of antigen processing in a co-culture comprised of primary mouse mesenchymal stromal cells (MSCs) and the mouse macrophage cell line RAW264.7, incubated with fluorescently labelled ovalbumin protein (DQ-Ova) and treated with either poly(I:C) or control (n=3) (t-test p<0.05). (G). differentially expressed genes (logFC >2 and adjusted p<0.001) in Poly(I:C) treated vs non-treated dendritic cells creating the ‘Poly(I:C) Signature’. (H) Enrichment for Poly(I:C) Signature using pair-wise GSEA in HPS high group compared with low in HiFi tumours from both the discovery and validation cohorts. APP, antigen processing and presentation; HiFi, high-fibroblast; HPS, HiFi-specific prognostic signature; TF, transcription factor.
Figure 7
Figure 7
In vivo validation of poly(I:C) in HiFi model (A) CMS classification according to fibroblast score of GEMM genotypes. (A=Apc fl/fl, K=Kras G12D/+, p=p53 fl/fl and n=Notch1Tg/+) (t-test p<0.01). (B) Stromal scores from H&E slides using digital pathology applied to GEMM tissue. (C) Waterfall plot of fibroblast scores indicating CMS classification in GEMMs. (D) comparison of HiFi (n=10) and LoFi (n=10) GEMMs using previously published stromal signatures and gene sets as assessed in figure 1G. (E) Pairwise GSEA of the APP gene set in CMS4 KP compared with CMS4 KPN. (F) Intrasplenic metastasis assay with KPN models in vivo treated with poly(I:C) compared with saline control. (G) Digital pathology assessment of H&E from in vivo studies demonstrates reduced liver metastasis in mice treated with poly(I:C) (n=16) compared with saline control (n=13) (Mann-Whitney U test). (H) Flow cytometry assessment of CD3 +cell populations from liver metastases in treatment groups highlight significant elevation of CD8 +T cells alongside significant reduction in CD4 +T cells in poly(I:C) arm (n=6) compared with saline (n=5) (Mann-Whitney U test; both p<0.05). APP, antigen processing and presentation; CMS, consensus molecular subtypes; GEMM, genetically engineered mouse model; HiFi, high fibroblast; LoFi, low fibroblast. *** denotes p<0.0002, ** denotes p<0.05.
Figure 8
Figure 8
Graphical summary

References

    1. Ferlay J, Soerjomataram I, Dikshit R, et al. . Cancer incidence and mortality worldwide: sources, methods and major patterns in GLOBOCAN 2012. Int J Cancer 2015;136:E359–86. 10.1002/ijc.29210 - DOI - PubMed
    1. Böckelman C, Engelmann BE, Kaprio T, et al. . Risk of recurrence in patients with colon cancer stage II and III: a systematic review and meta-analysis of recent literature. Acta Oncol 2015;54:5–16. 10.3109/0284186X.2014.975839 - DOI - PubMed
    1. Guinney J, Dienstmann R, Wang X, et al. . The consensus molecular subtypes of colorectal cancer. Nat Med 2015;21:1350–6. 10.1038/nm.3967 - DOI - PMC - PubMed
    1. Jass JR, Love SB, Northover JM. A new prognostic classification of rectal cancer. Lancet 1987;1:1303–6. 10.1016/S0140-6736(87)90552-6 - DOI - PubMed
    1. Jass JR, Morson BC. Reporting colorectal cancer. J Clin Pathol 1987;40:1016–23. 10.1136/jcp.40.9.1016 - DOI - PMC - PubMed

Publication types

MeSH terms

Substances