. 2022 May 15;208(10):2403-2424.
doi: 10.4049/jimmunol.2200098. Epub 2022 Apr 27.

Lupus Susceptibility Loci Predispose Mice to Clonal Lymphocytic Responses and Myeloid Expansion

Affiliations

Lupus Susceptibility Loci Predispose Mice to Clonal Lymphocytic Responses and Myeloid Expansion

Elliot H Akama-Garren et al. J Immunol. .

Abstract

Lupus susceptibility results from the combined effects of numerous genetic loci, but the contribution of these loci to disease pathogenesis has been difficult to study due to the large cellular heterogeneity of the autoimmune immune response. We performed single-cell RNA, BCR, and TCR sequencing of splenocytes from mice with multiple polymorphic lupus susceptibility loci. We not only observed lymphocyte and myeloid expansion, but we also characterized changes in subset frequencies and gene expression, such as decreased CD8 and marginal zone B cells and increased Fcrl5- and Cd5l-expressing macrophages. Clonotypic analyses revealed expansion of B and CD4 clones, and TCR repertoires from lupus-prone mice were distinguishable by algorithmic specificity prediction and unsupervised machine learning classification. Myeloid differential gene expression, metabolism, and altered ligand-receptor interaction were associated with decreased Ag presentation. This dataset provides novel mechanistic insight into the pathophysiology of a spontaneous model of lupus, highlighting potential therapeutic targets for autoantibody-mediated disease.


Conflict of interest statement

Competing Interests

The authors declare no competing interests.

Figures
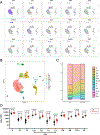
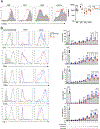
Figure 1.
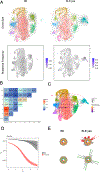
Figure 1.. Lupus prone mice have expanded splenic lymphocyte and myeloid populations
(A) Gene expression of cluster defining genes projected onto UMAP of CD45 cells isolated from the spleens of B6 and SLE.yaa mice. (B) UMAP visualization of CD45 cells colored by unbiased cluster assignment. Mac, macrophages; PMN, polymorphonuclear cells; DC, dendritic cells; PC, plasma cells; NK, natural killer cells; pDC, plasmacytoid dendritic cells; Baso, basophils. (C) Stacked bar graph of percent of CD45 cells belonging to each cluster between B6 and SLE.yaa mice. (D) Flow cytometric quantification of B (CD19+B220+), germinal center (GC; CD19+B220+GL7+Fas+), plasma cell (PC; CD138+), TCON (CD4+FoxP3), TREG (CD4+FOXP3+), TFH (CD4+CXCR5+PD1+FoxP3ICOS+), TFR (CD4+CXCR5+PD1+FoxP3+ICOS+), CD8, macrophage (Mϕ; F4/80+CD68+), CD11c, and natural killer (NK; CD49b+) cells from the spleens of B6 (black) or SLE.yaa (red) mice.
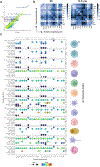
Figure 2.
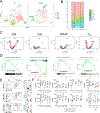
Figure 2.. Macrophages from lupus prone mice are less metabolically active
(A) Biplot of COMPASS principal component scores of CD45+ cells (dots) colored by scRNA-seq based cluster assignment and top variable loadings (vectors). (B) COMPASS principal component plot of CD45+ cells colored according to genotype (B6, black; SLE.yaa, red) with marginal histogram of PC1 and PC2 scores. (C) Heatmap of spearman correlation of KEGG transcriptome signatures with top five COMPASS principal components. Only significant correlations (p < 0.05) are shown in color and non-significant correlation coefficients are greyed out. (D) Volcano plots of differential COMPASS score activity between B, CD4, CD8, or macrophages from SLE.yaa and B6 mice. COMPASS metareactions are colored by their Recon2 pathways (outlined box). (E) Dot plots of differential COMPASS score activity of metabolic reactions in B, CD4, CD8, or macrophages from SLE.yaa and B6 mice. Reactions (dots) are partitioned by Recon2 pathways (rows), and significant reactions (adjusted P-value <0.05) are colored by the sign of their Cohen’s d statistic. Non-significant reactions are greyed out.
Figure 3.
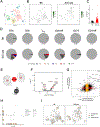
Figure 3.. Marginal zone B cells are decreased in lupus prone mice
(A) UMAP visualization of B cells from B6 (left) or SLE.yaa (right) mice colored by unbiased cluster assignment. Fo, follicular; MZ, marginal zone; T2-B, transitional stage 2; PC, plasma cell; T1-B, transitional stage 1. (B) Stacked bar graph of percent of B cells belonging to each cluster between B6 and SLE.yaa mice. (C) Pseudotime scores of B cells calculated from gene expression data projected onto UMAP embeddings. (D) RNA velocity of B cells projected onto UMAP colored by cluster assignment. Velocity vector field is represented by streamlines that indicate speed and direction of cells. (E) Trajectory inference computed using partition-based graph abstraction of paths between B cell clusters. Data topology is represented by weighted edges whose thickness correspond to the connectivity between two clusters. (F) Volcano plots of differentially expressed genes between SLE.yaa versus B6 mice within indicated B cell clusters. Adjusted P-value <0.01 and absolute log2FC >0.2 shown in red. (G) Dot plot of gene ontology analysis of differentially expressed genes between follicular (left) or activated (right) B cells from SLE.yaa versus B6 mice. Size represents gene ratio and color represents adjusted P-value. (H) Network plot of gene ontology analysis of differentially expressed genes between follicular B cells from SLE.yaa versus B6 mice. Tan circles represent gene sets and colored dots represent genes colored by log2FC in SLE.yaa compared to B6 mice. (I) Flow cytometry contour plots (left) and quantification (right) of marginal zone frequency amongst CD19+ cells from B6 (black) and SLE.yaa (red) mice. (J) Flow cytometric quantification of indicated proteins in B (CD19+B220+), germinal center (GC; CD19+B220+GL7+Fas+), plasma (PC; CD138+), or marginal zone (MZ; CD19+B220+CD21/35+CD1d+) cells from B6 (black) and SLE.yaa (red) mice.
Figure 4.
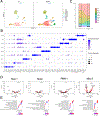
Figure 4.. B cells are clonally expanded and mutated in lupus prone mice
(A) Clone size topography (top) or mutational frequency (bottom) mapped onto UMAP visualization of B cells from B6 (left) or SLE.yaa (right) mice. Clonotypes defined by VDJC gene and size was calculated by the number of cells belonging to each clonotype. Mutational frequency was calculated by comparison with germline sequences. (B) Clonal overlap between B cell clusters represented by Morisita index of clones between two clusters. (C) Network interaction plot of clonotype sharing between clusters mapped onto UMAP visualization of B cells. Edge color represents proportion of clones shared between two clusters. Node sizes represents the number of unique clones in the underlying cluster. (D) Diversity curve of B cells from B6 (black) or SLE.yaa (red) mice representing the Hill diversity index (qD) over uniform resampling across diversity orders (q). Shading represents 95% confidence interval. (E) Hedgehog plot of somatic hypermutation mutability model for C (top) or A (bottom) nucleotides in B cells from B6 (left) or SLE.yaa (right) mice. Bar length represents the likelihood of a mutation in the given 5-mer. Bar colors represent known hot or cold spot motifs (WRC/GYW, red; WA/TW, green; SYC/GRS, blue; neutral, gray).
Figure 5.
Figure 5.. T cells from lupus prone mice express markers of exhaustion
(A) UMAP visualization of T cells from B6 (left) or SLE.yaa (right) mice colored by unbiased cluster assignment. (B) Stacked bar graph of percent of T cells belonging to each cluster between B6 and SLE.yaa mice. (C) Volcano plots of differentially expressed genes between T cells from SLE.yaa versus B6 mice within indicated clusters. Adjusted P-value <0.01 and absolute log2FC >0.2 shown in red. (D) Gene set enrichment plot of indicated gene module against genes ranked by fold enrichment in SLE.yaa versus B6 cells within indicated T cell cluster. (E) Flow cytometry contour plots (left) and quantification (right) of indicated population amongst CD4 or CD8 cells from B6 (black) and SLE.yaa (red) mice. Flow cytometry plots are gated on total CD4 cells. (F) Flow cytometric quantification of indicated proteins in TCON (CD4+FoxP3), TREG (CD4+FOXP3+), TFH (CD4+CXCR5+PD1+FoxP3ICOS+), TFR (CD4+CXCR5+PD1+FoxP3+ICOS+), extrafollicular (EFO; CD4+CD62LPSGL1), or CD8 cells from B6 (black) and SLE.yaa (red) mice.
Figure 6.
Figure 6.. CD4 clonal expansion is associated with differential gene expression in lupus prone mice
(A) UMAP visualization of T cells from B6 and SLE.yaa mice colored by cluster assignment. (B) Clone size mapped onto UMAP visualization of transcriptomic data of individual T cells from B6 (left) or SLE.yaa (right) mice. Clonotypes are defined by paired full length TCRα and TCRβ sequences and clone sizes are number of individual cells within a given clonotype. (C) Bar plot of number of individual cells belonging to each clonotype in B6 (black) or SLE.yaa (red) mice. (D) Pie charts of clonal expansion of T cell clusters identified by scRNA-seq (columns) in B6 (top) or SLE.yaa (bottom) mice. Number of cells with both TCRα and TCRβ successfully identified is shown below each pie chart. For clonotypes expressed by two or more cells, the number of cells expressing that clone is shown by a distinct color. (E) Unweighted network analysis of expanded clonotypes (>1 individual cells) from B6 (black) and SLE.yaa (red) mice. Clonotypes are defined by paired full length TCRα and TCRβ sequences. Individual samples (m232, m233, m234, m235) are depicted as colored circles, clonotypes are depicted as gray circles and sized according to number of cells belonging to given clonotype. Edges represent clonotype membership to individual samples. (F) Volcano plot of differentially expressed genes between expanded CD4 clonotypes from SLE.yaa versus B6 mice. Adjusted P-value <0.01 and absolute log2FC >0.2 shown in red. (G) Scatter plot comparing log fold change of gene expression between expanded versus unexpanded CD4 clones in B6 and SLE.yaa mice. Log2FC >0.1 are indicated in black (correlated in both conditions), red (correlated in SLE.yaa mice only), or red (correlated in B6 only). (H) Scatter plot comparing GLIPH2 specificity group size between B6 and SLE.yaa mice and colored according to disease class of predicted antigen. Size of specificity groups represents total number of samples in which the given specificity group is observed. (I) Mapping of predicted disease class onto UMAP visualization of T cell transcriptomic data from B6 (left) or SLE.yaa (right) mice. Cells for which disease class prediction was not possible are left grey.
Figure 7.
Figure 7.. Myeloid subset distribution is altered in lupus prone mice
(A) UMAP visualization of myeloid cells from B6 (left) or SLE.yaa (right) mice colored by unbiased cluster assignment. (B) Dot plot of averaged log-normalized expression of top six differentially expressed genes (columns) for each myeloid subcluster (row). Size represents percentage of cells in cluster expressing gene and color represents expression level. (C) Stacked bar graph of percent of myeloid cells belonging to each cluster between B6 and SLE.yaa mice. (D) Volcano plots of differentially expressed genes between myeloid cells from SLE.yaa versus B6 mice within indicated clusters. Adjusted P-value <0.01 and absolute log2FC >0.2 shown in red. (E) Dot plot of gene ontology analysis of differentially expressed genes between myeloid cells from SLE.yaa versus B6 mice within indicated clusters. Size represents gene count and color represents adjusted P-value.
Figure 8.
Figure 8.. Myeloid cell differential gene expression is validated by flow cytometry and histology
(A) Flow cytometry contour plots of gating strategy to identify DP1 (CD11chiCD11b+), DP2 (CD11cmedCD11b+), and CD11c (CD11c+CD11b) in B6 (left) and SLE.yaa (right) mice. (B) Flow cytometric quantification of indicated proteins in macrophage (Mϕ; F4/80+CD68+), DP1, DP2, or CD11c cells from B6 (black) and SLE.yaa (red) mice. (C) Confocal microscopy of spleens from B6 (top) or SLE.yaa (bottom) mice stained for indicated markers. Insets (below) show higher magnification. White arrows indicate myeloid cells that are positive for CD5L, CD74, CD16/32, or CD16.2. Hollow arrowhead indicates CD5L expression by follicular dendritic cells (FDC).
Figure 9.
Figure 9.. Myeloid cells from lupus prone mice are less capable of presenting antigen to CD4 cells
(A) Flow cytometry histograms (left) and quantification (right) of I-A/I-E expression in macrophage (Mϕ; F4/80+CD68+), DP1 (CD11chiCD11b+), DP2 (CD11cmedCD11b+), and CD11c (CD11c+CD11b) cells from B6 (black) or SLE.yaa (red) mice. (B) Flow cytometry histograms (left) and quantification (right) of CellTrace Violet (CTV), CD44, CD69, ICOS, or PD-1 expression in OT-II CD45.1+ CD4 cells following co-culture with splenocytes isolated from B6 (blue) or SLE.yaa (red) mice with or without ovalbumin (OVA). Data are representative of four independent experiments.
Figure 10.
Figure 10.. Lymphocytes and myeloid cells have differential ligand-receptor interactions in lupus prone mice
(A) Scatter plot comparing CellPhoneDB ligand-receptor interaction scores between B6 and SLE.yaa mice. Interactions are colored according to the absolute difference in scores between B6 and SLE.yaa mice. (B) Heatmaps of CellPhoneDB composite interaction scores between cell type clusters in B6 (left) or SLE.yaa (right) mice. (C) Dot plot of CellPhoneDB ligand-receptor interaction scores of selected ligand-receptor pairs (rows) between cell type clusters in B6 (left) or SLE.yaa (right) mice. Color represents interaction score and size represents adjusted P-value.

Similar articles

Cited by

References

    1. Tsokos GC 2020. Autoimmunity and organ damage in systemic lupus erythematosus. Nat. Immunol. 21: 605–614. - PMC - PubMed
    1. Tsokos GC, Lo MS, Reis PC, and Sullivan KE. 2016. New insights into the immunopathogenesis of systemic lupus erythematosus. Nat. Rev. Rheumatol. 12: 716–730. - PubMed
    1. Basta F, Fasola F, Triantafyllias K, and Schwarting A. 2020. Systemic Lupus Erythematosus (SLE) Therapy: The Old and the New. Rheumatol. Ther. 7: 433–446. - PMC - PubMed
    1. Lo MS, and Tsokos GC. 2018. Recent developments in SLE pathogenesis and applications for therapy. Curr. Opin. Rheumatol. 30: 222–228. - PMC - PubMed
    1. Moore E, Reynolds JA, Davidson A, Gallucci S, Morel L, Rao DA, Young HA, and Putterman C. 2021. Promise and complexity of lupus mouse models. Nat. Immunol. 22: 683–686. - PMC - PubMed

Publication types

Substances