. 2022 Apr 27;13(1):2267.
doi: 10.1038/s41467-022-29910-4.

EWSR1-ATF1 dependent 3D connectivity regulates oncogenic and differentiation programs in Clear Cell Sarcoma

Affiliations

EWSR1-ATF1 dependent 3D connectivity regulates oncogenic and differentiation programs in Clear Cell Sarcoma

Emely Möller et al. Nat Commun. .

Abstract

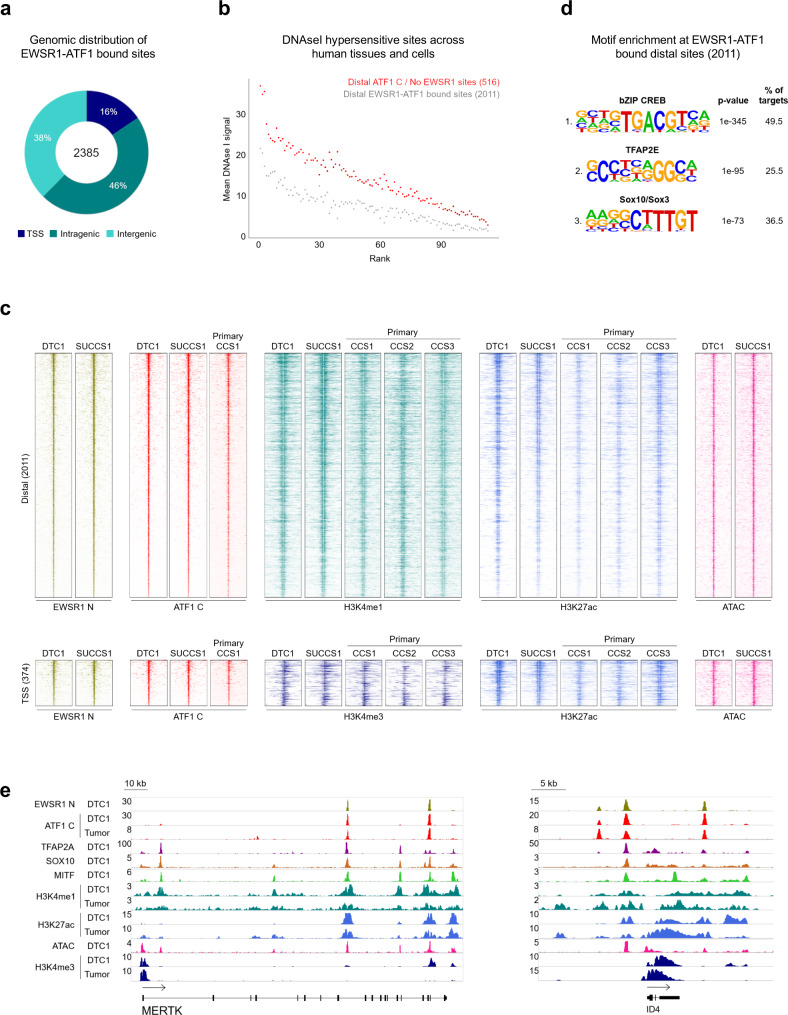
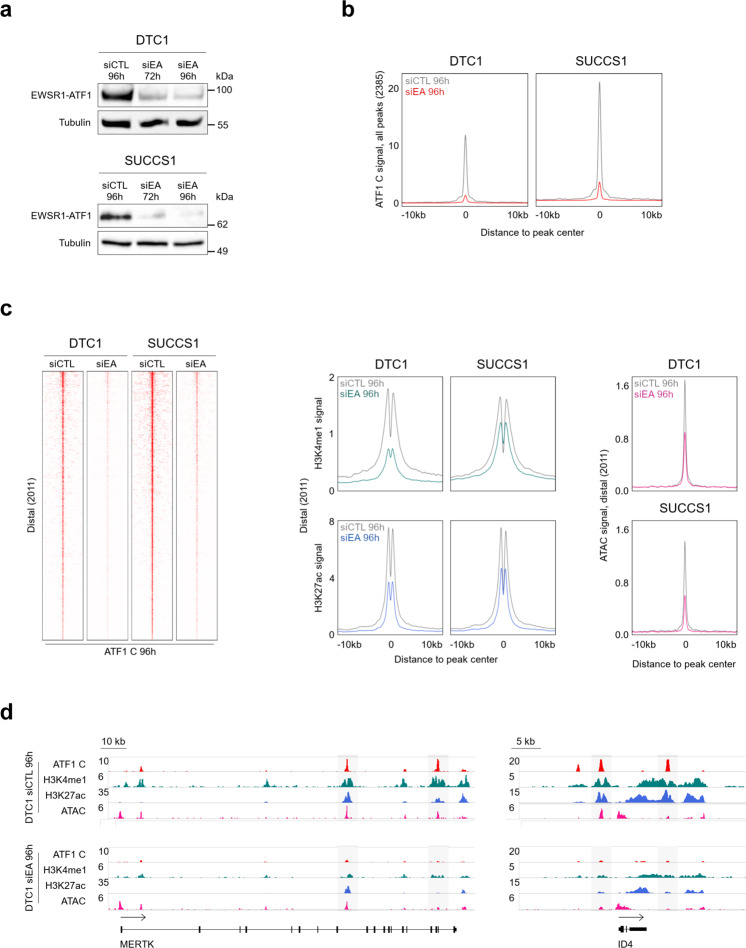
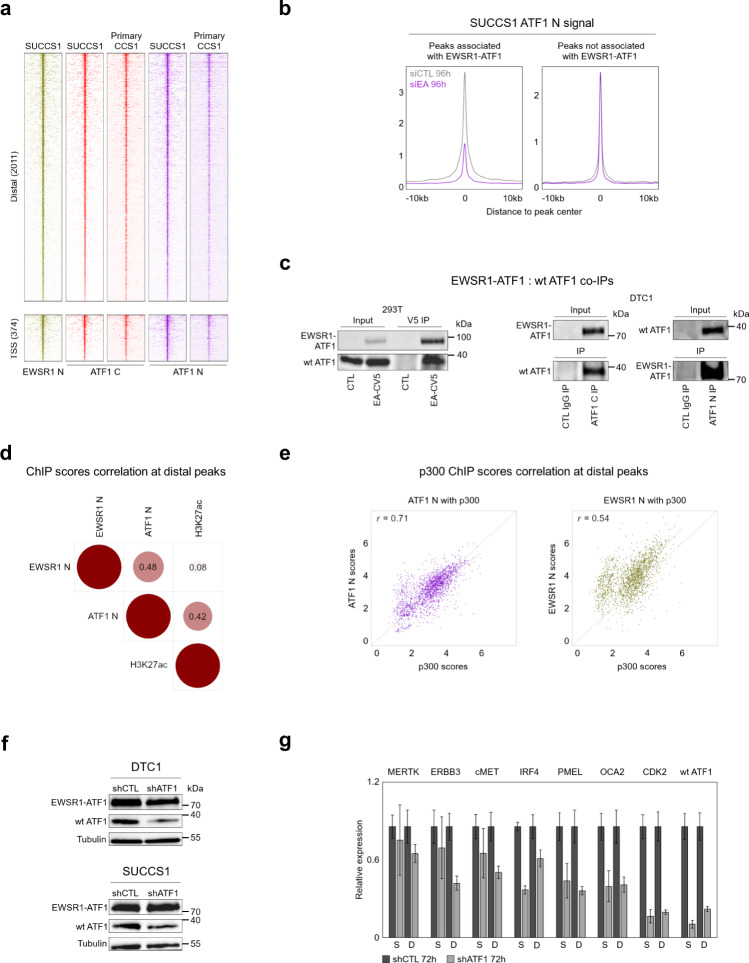
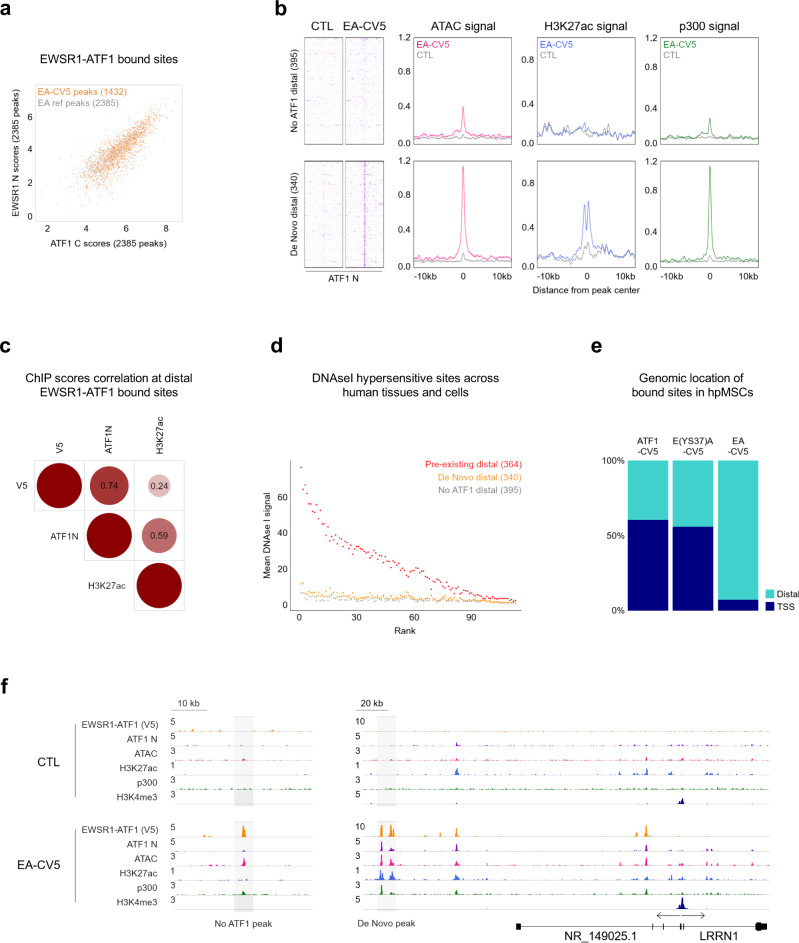
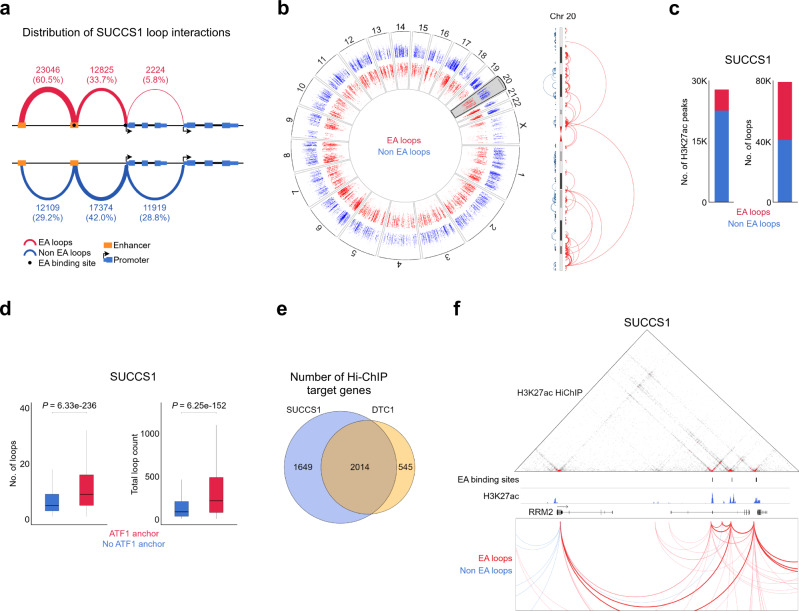
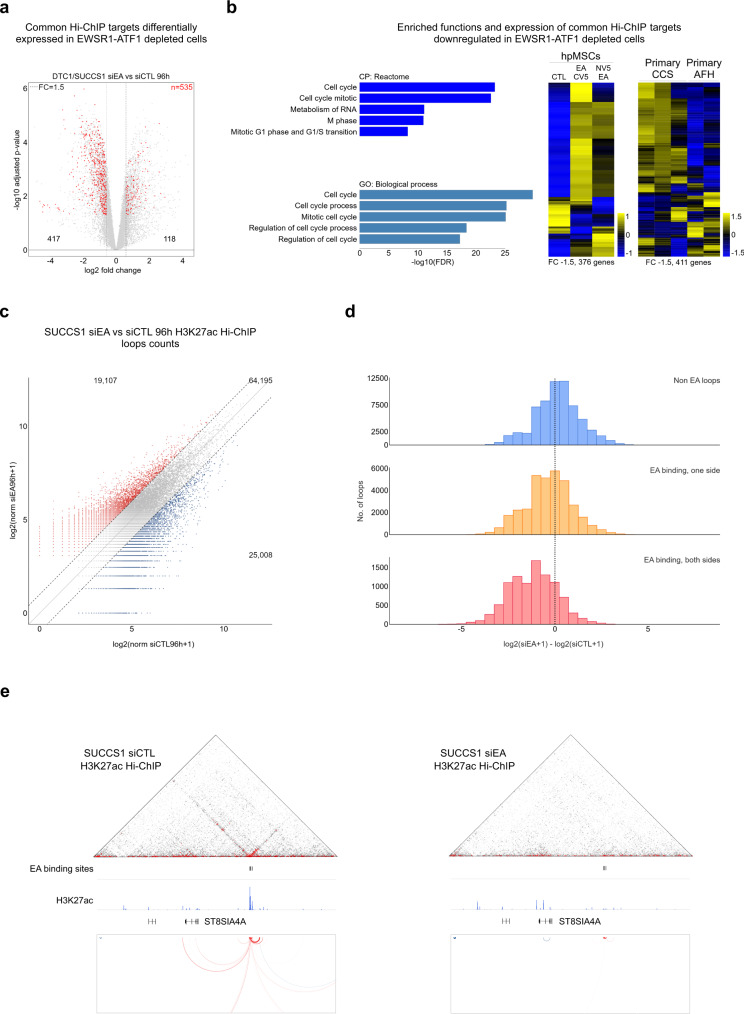
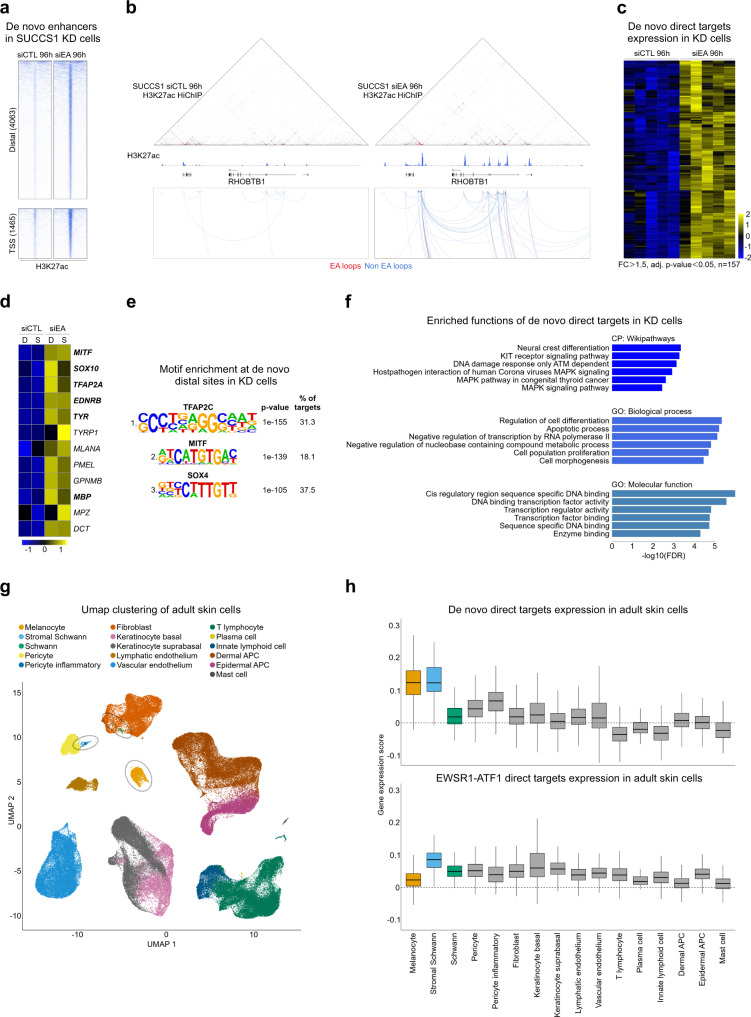
Oncogenic fusion proteins generated by chromosomal translocations play major roles in cancer. Among them, fusions between EWSR1 and transcription factors generate oncogenes with powerful chromatin regulatory activities, capable of establishing complex gene expression programs in permissive precursor cells. Here we define the epigenetic and 3D connectivity landscape of Clear Cell Sarcoma, an aggressive cancer driven by the EWSR1-ATF1 fusion gene. We find that EWSR1-ATF1 displays a distinct DNA binding pattern that requires the EWSR1 domain and promotes ATF1 retargeting to new distal sites, leading to chromatin activation and the establishment of a 3D network that controls oncogenic and differentiation signatures observed in primary CCS tumors. Conversely, EWSR1-ATF1 depletion results in a marked reconfiguration of 3D connectivity, including the emergence of regulatory circuits that promote neural crest-related developmental programs. Taken together, our study elucidates the epigenetic mechanisms utilized by EWSR1-ATF1 to establish regulatory networks in CCS, and points to precursor cells in the neural crest lineage as candidate cells of origin for these tumors.


Conflict of interest statement

M.N.R. receives support from ACD (Advanced Cell Diagnostics) and Merck-Serono for research unrelated to this study. The other authors declare no competing interests.

Figures

Fig. 1
Fig. 1. EWSR1-ATF1 displays a distinct binding pattern compared to wt ATF1.
a Genomic distribution of 2385 consensus EWSR1-ATF1 binding sites shared between DTC1 and SU-CCS-1 cell lines, illustrating preferential EWSR1-ATF1 binding to distal genomic regions. b DNAse I hypersensitivity profile comparison between 2011 distal EWSR1-ATF1 sites and 516 wt ATF1 bound distal sites across 113 different cell types, showing a more restricted DNA accessibility pattern for the fusion protein binding sites in other cell types. c Top panel: heatmaps depicting EWSR1 N, ATF1 C, H3K4me1, H3K27ac, and ATAC signal intensities at 2011 EWSR1-ATF1 bound distal sites in DTC1 and SU-CCS-1 cell lines, as well as three primary CCS tumors. Bottom panel: EWSR1 N, ATF1 C, H3K4me3, H3K27ac, and ATAC signal intensities at 374 TSS-associated EWSR1-ATF1 binding sites. For each heatmap 20 kb regions centered on the EWSR1-ATF1 peaks are shown. Signals are ranked by ATF1 C intensity. d De novo motif enrichment analysis for 2011 distal EWSR1-ATF1 binding regions. The top three motifs identified are shown. Binomial p-values are given by the motif enrichment software HOMER. e, ChIP-seq track at MERTK and ID4 genomic loci, illustrating similar EWSR1-ATF1 binding and chromatin activity profiles between DTC1 and primary CCS tumor cells, and the presence of TFAP2A, SOX10, and MITF at EWR1-ATF1 sites.
Fig. 2
Fig. 2. EWSR1-ATF1 depletion reduces chromatin activation and DNA accessibility.
a Western blot analysis of EWSR1-ATF1 protein levels in DTC1 and SU-CCS-1 cell lines transfected with a siRNA targeting the fusion gene (siEA 72 h and 96 h) or an unrelated sequence (siCTL 96 h). Tubulin protein levels were used as loading control. The experiment was independently repeated twice with similar results. Source images are provided in the Source Data file. b Composite plots showing the marked reduction in ATF1 C ChIP-seq signal at 2385 EWSR1-ATF1 bound sites in DTC1 and SU-CCS-1 cells transfected with either siEA or siCTL siRNAs for 96 h. c Left panel: Heatmaps depicting the distribution of ATF1 C ChIP-seq signal across 2011 EWSR1-ATF1 bound distal sites in siEA or siCTL-treated DTC1 and SU-CCS-1 cells at 96 h. Heatmaps show 20 kb genomic regions centered on EWSR1-ATF1 peaks ranked by ATF1 C signal intensity. Middle panel: composite plots of H3K4me1 (upper panels) and H3K27ac (lower panels) signal at 2011 EWSR1-ATF1 bound distal sites in siEA or siCTL-treated DTC1 and SU-CCS-1 cells at 96 h, showing a reduction in both enhancer marks upon EWSR1-ATF1 depletion. Right panel: composite plots of ATAC signal in siEA or siCTL-transfected DTC1 and SU-CCS-1 cells at 96 h, showing the reduction in chromatin accessibility associated with the loss of the fusion protein. d ChIP-seq and ATAC-seq tracks at the MERTK and ID4 genomic loci (as in Fig. 1e) in siEA or siCTL-treated DTC1 cells at 96 h, showing the decrease in chromatin activity and accessibility induced by the loss of EWSR1-ATF1. EWSR1-ATF1 binding regions are highlighted in gray.
Fig. 3
Fig. 3. wt ATF1 is present at a majority of EWSR1-ATF1 binding sites.
a Heatmaps depicting EWSR1 N, ATF1 C and ATF1 N ChIP-seq signal intensities at 2011 distal and 374 proximal EWSR1-ATF1 binding sites in SU-CCS-1 and primary CCS1 tumor cells, illustrating genomic co-occupancy by the wt ATF1 TF at the fusion protein binding sites. For each heatmap 20 kb regions centered on the EWSR1-ATF1 peaks are shown. Signals are ranked by ATF1 C intensity. b Composite plots showing changes in ChIP-seq signal for ATF1 N peaks associated (left) or not (right) with EWSR1-ATF1 binding in SU-CCS-1 cells transfected with a siRNA targeting the fusion gene (siEA) or control (siCTL) siRNAs. The loss of the fusion protein is associated with a decrease in ATF1 N signal only at EWSR1-ATF1 bound sites, suggesting wt ATF1 recruitment by the fusion protein. c Co-immunoprecipitation (Co-IP) assay showing the direct interaction between the EWSR1-ATF1 and wt ATF1 proteins in 293 T (left) and DTC1 cells (right). 293 T cells were transfected with either a V5-tagged EWSR1-ATF1 (EA-CV5) or empty vector (CTL) constructs. The IP was performed using an anti-V5 tag antibody, and the western blot revealed using anti-V5 (top) or anti-ATF1 C (bottom) antibodies. DTC1 IPs were performed using anti-ATF1 C or -ATF1 N antibodies, compared to control (CTL) IgG, and the western blot revealed using an anti-ATF1 C antibody. The experiment was independently repeated twice with similar results. d Correlation plot of EWSR1 N, ATF1 N, and H3K27ac ChIP-seq scores at the 2011 distal regions, showing stronger correlation between H3K27ac deposition and wt ATF1 presence, than with EWSR1-ATF1 presence (represented by ATF1 N and EWSR1 N signals, respectively). e Scatter plots of ATF1 N and p300 (left), or EWSR1 N and p300 (right) ChIP-seq scores, illustrating that wt ATF1 presence correlates better with p300 occupancy than EWSR1-ATF1. f Western blot analysis of EWSR1-ATF1 and wt ATF1 protein levels in DTC1 and SU-CCS-1 cell lines infected with a shRNA targeting the wt ATF1 transcript (shATF1) or an unrelated sequence (shCTL) at 72 h post-lentiviral infection. Tubulin protein levels were used as loading control. The experiment was independently repeated twice with similar results. g qPCR analysis showing reduction of wt ATF1 transcripts, as well as a panel of EWSR1-ATF1 / wt ATF1 co-regulated target transcripts, in shATF1- vs shCTL-infected SU-CCS-1 (S) and DTC1 (D) cells at 72 h post-lentiviral infection. Three replicates of each condition were used to calculate mean Ct values, mean relative expression values were then calculated according to the 2-ΔΔCt method relative to the shCTL sample values, and normalized to the endogenous control gene GAPDH. Error bars show standard deviation of mean values (n = 3 sample replicates). The experiment was independently repeated twice with similar results. Source data are provided in the Source Data file.
Fig. 4
Fig. 4. EWSR1-ATF1 distal binding and wt ATF1 recruitment depend on EWSR1 prion-like domain.
a Scatter plot of EWSR1 N and ATF1 C ChIP-seq scores for the 1432 EWSR1-ATF1-V5 peaks (EA-CV5) shared between hpMSCs and CCS cell lines, showing an even distribution of V5 signal across all sites (EA ref peaks). b Heatmaps (left) depicting ATF1 N signal intensity at 395 and 340 No ATF1 and De Novo, respectively, EWSR1-ATF1-V5 bound distal sites in hpMSCs (EA-CV5) vs control (CTL) cells, illustrating the de novo recruitment of wt ATF1. 20 kb regions centered on the EWSR1-ATF1 peaks are shown. Composite plots depicting ATAC, H3K27ac, and p300 signal intensity at No ATF1 and De Novo distal sites, showing that the wt ATF1 recruitment by the fusion protein enhances its chromatin activation properties. c Correlation plot of V5, ATF1 N, and H3K27ac ChIP-seq scores at the 1174 distal EWSR1-ATF1-V5 bound sites in hpMSCs, confirming that H3K27ac deposition correlates better with wt ATF1 (ATF1 N) presence than with EWSR1-ATF1 (V5) presence, at the fusion protein binding sites observed in CCS cell lines. d DNAse I hypersensitivity profile comparison between No ATF1, De Novo, and Pre-existing hpMSCs EWSR1-ATF1-V5 distal bound sites across 113 different cell types, showing the restricted DNA accessibility pattern of genomic regions initially devoid of wt ATF1 occupancy. e Bar plots depicting the genomic distribution of EWSR1-ATF1 (EA-CV5), EWSR1(YS37)-ATF1 (E(YS37)A-CV5), and wt ATF1 (ATF1-CV5) binding sites in MSCs, as assessed by ChIP-seq using an anti-V5 antibody. f ChIP-seq, and ATAC-seq tracks showing distinct patterns of wt ATF1 recruitment, DNA accessibility, and chromatin activity changes at No ATF1 (left) and De Novo (right) EWSR1-ATF1-V5 binding sites in hpMSCs (highlighted in grey).
Fig. 5
Fig. 5. EWSR1-ATF1-associated connectivity dominates the 3D landscape of CCS tumor cells.
a Three-dimensional connectivity of EWSR1-ATF1-associated (EA loops, red) or –independent (Non EA loops, blue) chromatin loops in SU-CCS-1 tumor cells, showing a more distal-to-distal interaction pattern for fusion protein-connected loops. b Left: circos plot depicting all EWSR1-ATF1-associated or -independent chromatin loops genome-wide. The height of the blue and red signals inside the circos corresponds to the loop’s length depicted in log10 scale. Right: higher magnification of chromosome 20 illustrating increased length for EWSR1-ATF1-associated loops, as compared to all other loops. c Bar plots showing the association of H3K27ac peaks (left) and chromatin loops (right) with EA loops (5121 and 38095, respectively) or Non-EA loops (22654 and 41402, respectively). d Box plots depicting the median number (left) and intensity (right) of chromatin loops associated (n = 38095) or not (n = 41402) with EWSR1-ATF1 binding sites. The lower and upper hinges correspond to the first and third quartiles (the 25th and 75th percentiles). The upper whisker extends from the hinge to the largest value no further than 1.5 * IQR from the hinge (where IQR is the inter-quartile range). The lower whisker extends from the hinge to the smallest value at most 1.5 * IQR of the hinge. Statistical significance was calculated by two-sided t-test (n = 4181 forATF1 anchors, n = 16756 for No ATF1 anchors). e Venn diagram presenting the number of direct target genes identified by Hi-ChIP as connected to the 2385 EWSR1-ATF1 binding sites in SU-CCS-1 and DTC1 tumor cells. f Hi-ChIP interaction map (top) and chromatin looping profile (bottom) for the RRM2 genomic locus in SU-CCS-1 tumor cells. EWSR1-ATF1 (EA) binding sites and H3K27ac ChIP-seq signal are also shown (middle). Chromatin loops in the bottom panel are color-coded depending on their association (EA loops, red) or not (Non EA loops, blue) with the fusion protein binding sites.
Fig. 6
Fig. 6. EWSR1-ATF1-connected loops regulate cellular proliferation programs.
a Volcano plot showing gene expression changes in cells with EWSR1-ATF1 depletion (siEA) vs control (siCTL) cells at FC = 1.5 (dashed lines) and adjusted p-value = 0.05 (3693 genes). EWSR1-ATF1 direct target genes from Fig. 5e that are differentially expressed at FC = 1.5 (n = 535) are marked in red. Two-sided p-values are given by lmFit multiple linear fitting models and adjusted for multiple testing by Benjamini & Hochberg correction. b left: Functional analysis of the 417 genes downregulated upon EWSR1-ATF1 depletion as in (a) for Biological Process (GO: BP) and Canonical Pathways (CP: Reactome) showing their involvement in cell cycle regulation. Right: Heatmaps depicting z-score expression levels of the downregulated genes from (a), in hpMSCs expressing the fusion protein (EA-CV5 and NV5-EA) vs control (CTL), or in primary CCS and AFH tumors. c Scatter plot showing the changes in H3K27ac-associated loops between siCTL and siEA transfected SU-CCS-1 cells. The number of loops displaying a more than two-fold change is shown in red (induced) and blue (repressed). d Bar plots showing the changes in loop number for EWSR1-ATF1-associated (EA binding, orange and red) or -independent (Non EA, blue) loops. e Hi-ChIP and ChIP-seq signal tracks at the ST8SIA4A genomic locus in control (siCTL, left) or EWSR1-ATF1-depleted (siEA, right) SU-CCS-1 cells.
Fig. 7
Fig. 7. Changes in 3D connectivity upon EWSR1-ATF1 depletion point to candidate CCS precursor cells.
a Heatmaps depicting H3K27ac signal at Distal (top panels) and Proximal (bottom panels) sites in SU-CCS-1 cells, transfected with either control (siCTL, left) or EWSR1-ATF1 targeting (siEA, right) siRNAs, illustrating the induction of “de novo” sites in EWSR1-ATF1-depleted cells. For each heatmap 20 kb regions centered on the H3K27ac signal are shown. Signals are ranked by H3K27ac intensity in siEA-transfected SU-CCS-1 cells. b Hi-ChIP interaction map (top) and chromatin looping profile (bottom) for the RHOBTB1 genomic locus in siCTL or siEA – treated SU-CCS-1 tumor cells. H3K27ac ChIP-seq signal are also shown (bottom). Chromatin loops in the bottom panel are color-coded depending on their association (EA loops, red) or not (Non-EA loops, blue) with the fusion protein binding sites. c Gene expression z-scores heatmaps in DTC1 and SU-CCS-1 cells for the 157 transcripts identified as targets of “de novo” regulatory sites as in (a), showing upregulation at FC > 1.5 and p-value<0.05 in both cell lines upon EWSR1-ATF1 depletion. d Expression z-scores of genes involved in melanocytic differentiation, showing a higher expression in siEA-transfected DTC1 (D) and SU-CCS-1 (S) cells. Genes marked in bold were among the de novo targets in (c). e Homer motif analysis of the 4063 “de novo” distal sites shown in (a). Binomial p-values are given by the motif enrichment software HOMER. f Functional analysis of the same 157 genes for the Wiki-Pathways (WP), Biological Processes (GO: BP), and Molecular Function (GO: MF), showing the involvement of this gene repertoire in the NCSC differentiation and chromatin remodeling. g UMAP representation for the expression profiles of 168,103 single cells derived from five healthy human skin samples (including both epidermis and dermis layers). Normalized log2 scores were used for UMAP generation. Melanocyte, Schwann and Stromal Schwann cells are marked with dashed circles. h Boxplots depicting the enrichment score for the downregulated EWSR1-ATF1 target genes (bottom, n = 393) or the upregulated “de novo” gene signature (top, n = 154) expressed across 16 different cell groups. Following the removal of the fusion protein the tumor cells acquire a more differentiated phenotype, reminiscent of melanocytes and stromal Schwann cells. Box plots show the 1st to 3rd quartiles (25–75%) of the data with median values indicated.

References

    1. Nacev BA, et al. The epigenomics of sarcoma. Nat. Rev. Cancer. 2020;20:608–623. doi: 10.1038/s41568-020-0288-4. - DOI - PMC - PubMed
    1. Riggi N, et al. EWS-FLI1 utilizes divergent chromatin remodeling mechanisms to directly activate or repress enhancer elements in Ewing sarcoma. Cancer Cell. 2014;26:668–681. doi: 10.1016/j.ccell.2014.10.004. - DOI - PMC - PubMed
    1. Tomazou EM, et al. Epigenome mapping reveals distinct modes of gene regulation and widespread enhancer reprogramming by the oncogenic fusion protein EWS-FLI1. Cell Rep. 2015;10:1082–1095. doi: 10.1016/j.celrep.2015.01.042. - DOI - PMC - PubMed
    1. Gonzaga MI, et al. The epidemiology and survivorship of clear cell sarcoma: a National Cancer Database (NCDB) review. J. Cancer Res Clin. Oncol. 2018;144:1711–1716. doi: 10.1007/s00432-018-2693-6. - DOI - PMC - PubMed
    1. Cornillie J, van Cann T, Wozniak A, Hompes D, Schoffski P. Biology and management of clear cell sarcoma: state of the art and future perspectives. Expert Rev. Anticancer Ther. 2016;16:839–845. doi: 10.1080/14737140.2016.1197122. - DOI - PubMed

Publication types

MeSH terms