. 2022 Apr 27;12(1):6872.
doi: 10.1038/s41598-022-10734-7.

Changes to the gut microbiota of a wild juvenile passerine in a multidimensional urban mosaic

Affiliations

Changes to the gut microbiota of a wild juvenile passerine in a multidimensional urban mosaic

Öncü Maraci et al. Sci Rep. .

Abstract

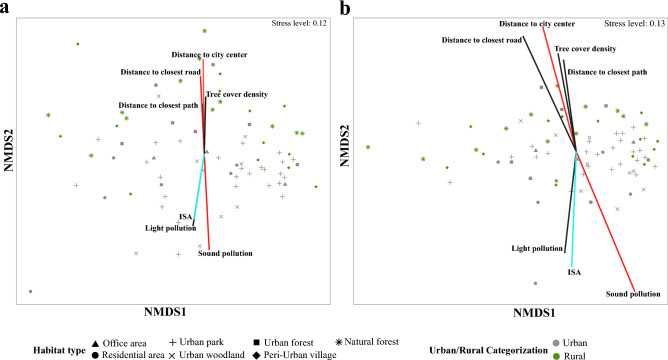
Urbanisation is a major anthropogenic perturbation presenting novel ecological and evolutionary challenges to wild populations. Symbiotic microorganisms residing in the gastrointestinal tracts (gut) of vertebrates have mutual connections with host physiology and respond quickly to environmental alterations. However, the impact of anthropogenic changes and urbanisation on the gut microbiota remains poorly understood, especially in early development. To address this knowledge gap, we characterised the gut microbiota of juvenile great tits (Parus major) reared in artificial nestboxes and in natural cavities in an urban mosaic, employing two distinct frameworks characterising the urban space. Microbial diversity was influenced by cavity type. Alpha diversity was affected by the amount of impervious surface surrounding the breeding location, and positively correlated with tree cover density. Community composition differed between urban and rural sites: these alterations covaried with sound pollution and distance to the city centre. Overall, the microbial communities reflect and are possibly influenced by the heterogeneous environmental modifications that are typical of the urban space. Strikingly, the choice of framework and environmental variables characterising the urban space can influence the outcomes of such ecological studies. Our results open new perspectives to investigate the impact of microbial symbionts on the adaptive capacity of their hosts.


Conflict of interest statement

The authors declare no competing interests.

Figures

Figure 1
Figure 1
Study site locations in the urban mosaic of the capital city of Warsaw, Poland. The locations include an office area, two residential areas, an urban park, two urban woodlands, an urban forest, a peri-urban village and a natural forest. The impervious surface area (ISA, in %), shown here as the original map layer, is further described and used for analysis in Section 2.2.3. A zoom on each study site visualizes the locations of nestboxes (dots) and natural cavities (triangles). The figure was generated using the QGIS software (v. 3.10).
Figure 2
Figure 2
Microbiota alpha-diversity based on Shannon’s diversity collected from nestlings reared in nestboxes and natural cavities. The figure was generated in R version 4.0.0.
Figure 3
Figure 3
(a) Violin plots with embedded box plots comparing the distribution of ISA percentages in urban and rural sites. The line within the box plots indicates the median and the lower and upper boundary of the boxes indicates the 25th and 75th percentile, respectively. Whiskers above and below the boxes correspond to 1.5 times the inter-quartile range (IQR) above and below the 25th and 75th percentile, respectively. (b) Correlation between ISA and environmental variables. The significance was determined based on Pearson’s correlation tests, at p-values ≤ 0.05 (*), p ≤ 0.01 (**), and p ≤ 0.001 (***). The sizes of the circles are proportional to Pearson’s correlation coefficients. The figure was generated in R version 4.0.0.
Figure 4
Figure 4
Alpha diversity across the urban mosaic. (a) Boxplot of Faith's phylogenetic diversity of nestlings originating from urban and rural sites. Scatter plots report the relationship between ISA and (b) Shannon’s diversity index (c) The number of observed OTUs, and (d) Faith's phylogenetic diversity. The figure was generated in R version 4.0.0.
Figure 5
Figure 5
nMDS plots of microbial dissimilarities based on (a) Bray–Curtis and (b) Weighted UniFrac distances among samples collected from different sampling sites located in urban and rural areas. The lengths of vectors are proportional to their predictive strength, determined based on Envfit. All variables that were significant based on at least one test are represented (The significance was determined based on being included in the best BIOENV model or at p-values ≤ 0.05 in Envfit or partial Mantel test). The parameters considered significant in all tests are coloured in red. The figure was generated in R version 4.0.0.
Figure 6
Figure 6
(a) The relative abundances of microbial families in gut samples from different sampling sites located in urban and rural territories. Only the 20 families with the highest relative abundances are reported. (b) Differentially abundant OTUs between urban and rural samples. OTUs with a log2-fold change larger than zero are more abundant in urban territories (grey bars), while OTUs with a log2-fold change smaller than zero are more abundant in rural territories (green bars). The family level taxonomy of each OTU is indicated. The figure was generated in R version 4.0.0.
Figure 7
Figure 7
Scatter plots reporting the relationship between tree cover density and (a) Shannon’s diversity index and (b) the number of observed OTUs, (c) Faith’s phylogenetic diversity. The figure was generated in R version 4.0.0.

References

    1. Szulkin M, et al. How to quantify urbanization when testing for urban evolution? Urban Evol. Biol. 2020 doi: 10.1093/oso/9780198836841.003.0002. - DOI
    1. Slabbekoorn H. Songs of the city: Noise-dependent spectral plasticity in the acoustic phenotype of urban birds. Anim. Behav. 2013 doi: 10.1016/j.anbehav.2013.01.021. - DOI
    1. Christiansen NA, Fryirs KA, Green TJ, Hose GC. The impact of urbanisation on community structure, gene abundance and transcription rates of microbes in upland swamps of Eastern Australia. PLoS ONE. 2019 doi: 10.1371/journal.pone.0213275. - DOI - PMC - PubMed
    1. Alberti M, et al. Global urban signatures of phenotypic change in animal and plant populations. Proc. Natl. Acad. Sci. USA. 2017 doi: 10.1073/pnas.1606034114. - DOI - PMC - PubMed
    1. McFall-Ngai MM, et al. Animals in a bacterial world, a new imperative for the life sciences. Proc. Natl. Acad. Sci. 2013 doi: 10.1073/pnas.1218525110. - DOI - PMC - PubMed

Publication types