. 2022 Apr 27;12(1):6875.
doi: 10.1038/s41598-022-10869-7.

Comprehensive human amniotic fluid metagenomics supports the sterile womb hypothesis

Affiliations

Comprehensive human amniotic fluid metagenomics supports the sterile womb hypothesis

HanChen Wang et al. Sci Rep. .

Abstract

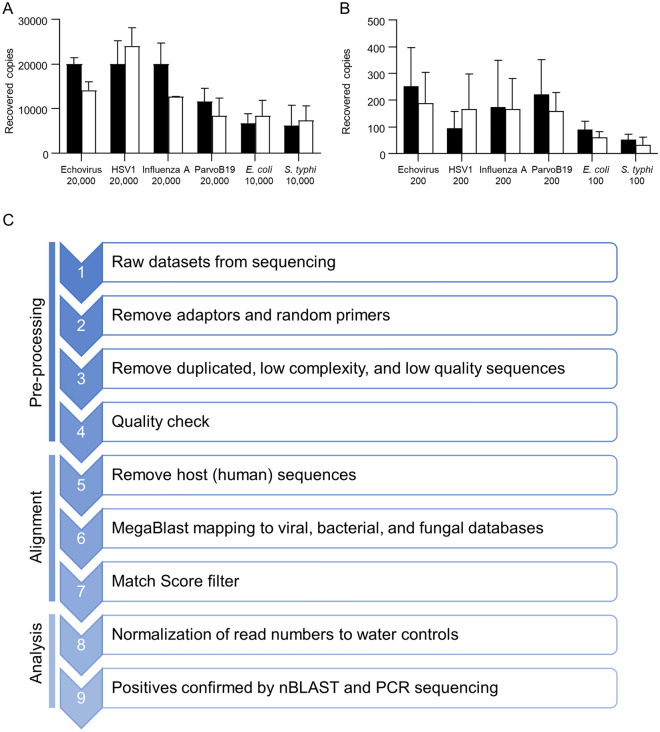
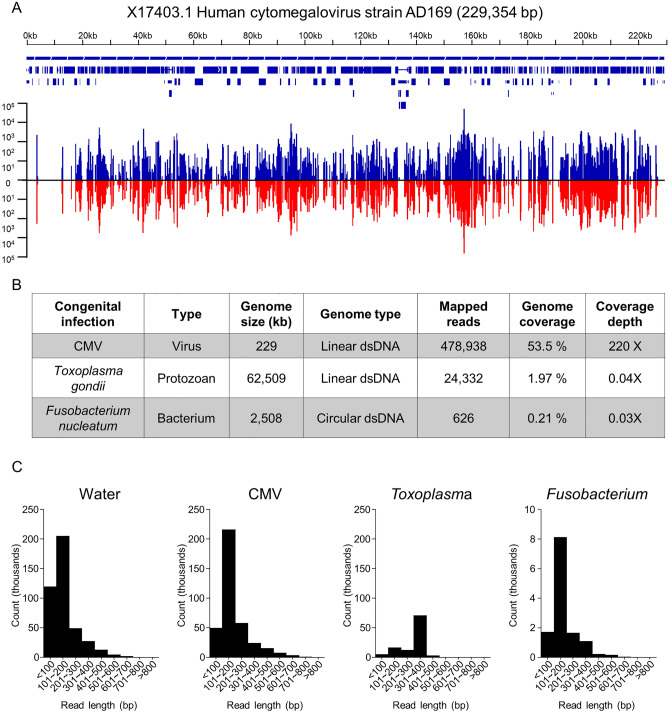
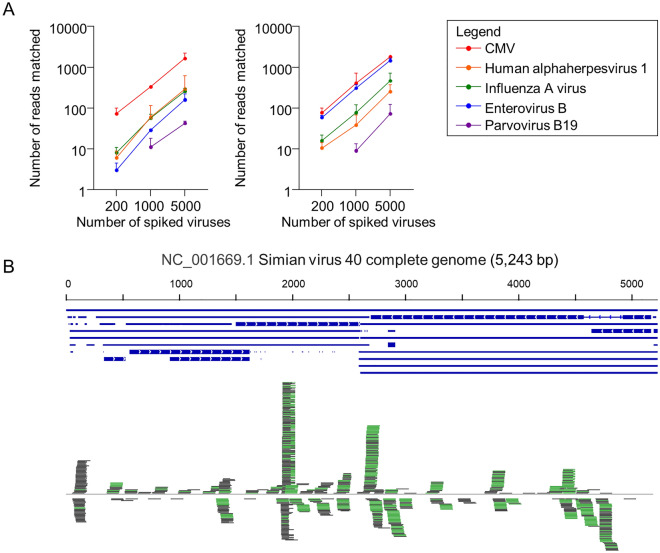
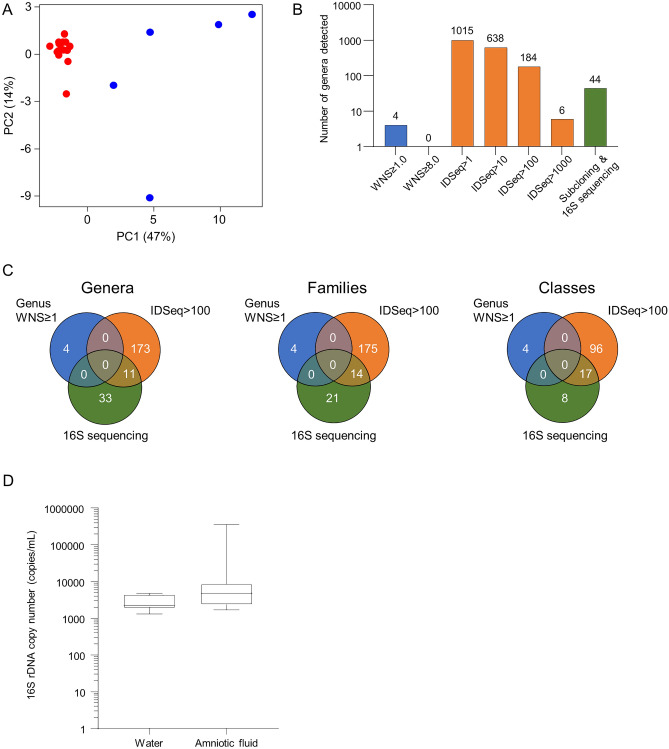
As metagenomic approaches for detecting infectious agents have improved, each tissue that was once thought to be sterile has been found to harbor a variety of microorganisms. Controversy still exists over the status of amniotic fluid, which is part of an immunologically privileged zone that is required to prevent maternal immune system rejection of the fetus. Due to this privilege, the exclusion of microbes has been proposed to be mandatory, leading to the sterile womb hypothesis. Since nucleic acid yields from amniotic fluid are very low, contaminating nucleic acid found in water, reagents and the laboratory environment frequently confound attempts to address this hypothesis. Here we present metagenomic criteria for microorganism detection and a metagenomic method able to be performed with small volumes of starting material, while controlling for exogenous contamination, to circumvent these and other pitfalls. We use this method to show that human mid-gestational amniotic fluid has no detectable virome or microbiome, supporting the sterile womb hypothesis.


Conflict of interest statement

The authors declare no competing interests.

Figures

Figure 1
Figure 1
Viral and bacterial genome copy yield from human amniotic fluid by extraction method. (A,B) Recovered copies for various pathogens and spike levels as indicated on the x axis for the MinElute (black bars) and PureLink (white bars) columns. Error bars represent SD for 3 experiments. (C) Overview of the metagenomic method used.
Figure 2
Figure 2
Detection of known infections. (A) Genomic graph illustrating the coverage and depth of CMV in the CMV-positive amniotic fluid sample (against reference CMV genome NC_006273.2). Top: gene location and genomic feature annotations from RefSeq. Bottom: number of reads mapped to genome. Blue lines above and red lines below the horizontal line indicate forward and reverse reads, respectively. The graph is generated using Bedfile and genomic snapshots from IGV. (B) Table showing genome coverage statistics for CMV, F. nucleatum, and T. gondii. (C) Histograms showing insert lengths (specifically, mapped paired end read separation distance) in water (left), CMV infection (middle left) and F. nucleatum infection (middle right) and T. gondii infection (right).
Figure 3
Figure 3
Detection of spiked viruses in human amniotic fluid. (A) Dot plot comparing number of reads identified from five spiked viruses at 3 different levels using our method (left panel) and IDSeq (right panel). (B) The 5.2 kb SV40 genome backbone is illustrated horizontally, with forward reads only shown above and below in green and grey.
Figure 4
Figure 4
Microbial detection varies by method used. (A) Principal component analysis illustrating sample variance between water (blue) and amniotic fluid (red). (B) Bar graph showing the number of genera detected using our method (blue), IDSeq at different thresholds (orange), and 16S sequencing (green). (C) Venn diagrams comparing the number of genera, families, and classes detected in amniotic fluid samples using our method (blue), IDSeq (orange), and 16S sequencing (green). (D) EvaGreen 16S rDNA droplet digital PCR box plot comparing total volume of bacterial rDNA signatures in water controls and amniotic fluid (p > 0.05 for difference).
Figure 5
Figure 5
Profiles of all species detected using our method, IDSeq, and 16S sequencing. (A–C) Blot plots show the percentages of reads mapped to top 10 most abundant species using (A) our method, (B) IDSeq, and (C) 16S PCR subcloning and sequencing. Species were inferred from 16S sequence data by 100% sequence matches to the organisms indicated.

References

    1. Yoon BH, et al. Clinical significance of intra-amniotic inflammation in patients with preterm labor and intact membranes. Am. J. Obstet. Gynecol. 2001;185:1130–1136. doi: 10.1067/mob.2001.117680. - DOI - PubMed
    1. Goncalves LF, Chaiworapongsa T, Romero R. Intrauterine infection and prematurity. Ment. Retard. Dev. Disabil. Res. Rev. 2002;8:3–13. doi: 10.1002/mrdd.10008. - DOI - PubMed
    1. Remington, J. S., Klein, J. O., Nizet, V., Maldonado, Y. & Wilson, C. B. Infectious Diseases of the Fetus and Newborn Infant. (Saunders/Elsevier, 2011).
    1. Romero R, et al. Sterile and microbial-associated intra-amniotic inflammation in preterm prelabor rupture of membranes. J. Matern. Fetal Neonatal Med. 2015;28:1394–1409. doi: 10.3109/14767058.2014.958463. - DOI - PMC - PubMed
    1. Yockey LJ, Lucas C, Iwasaki A. Contributions of maternal and fetal antiviral immunity in congenital disease. Science. 2020;368:608–612. doi: 10.1126/science.aaz1960. - DOI - PubMed

Publication types

Grants and funding