. 2022 May;605(7908):160-165.
doi: 10.1038/s41586-022-04649-6. Epub 2022 Apr 27.

β-Hydroxybutyrate suppresses colorectal cancer

Affiliations

β-Hydroxybutyrate suppresses colorectal cancer

Oxana Dmitrieva-Posocco et al. Nature. 2022 May.

Abstract

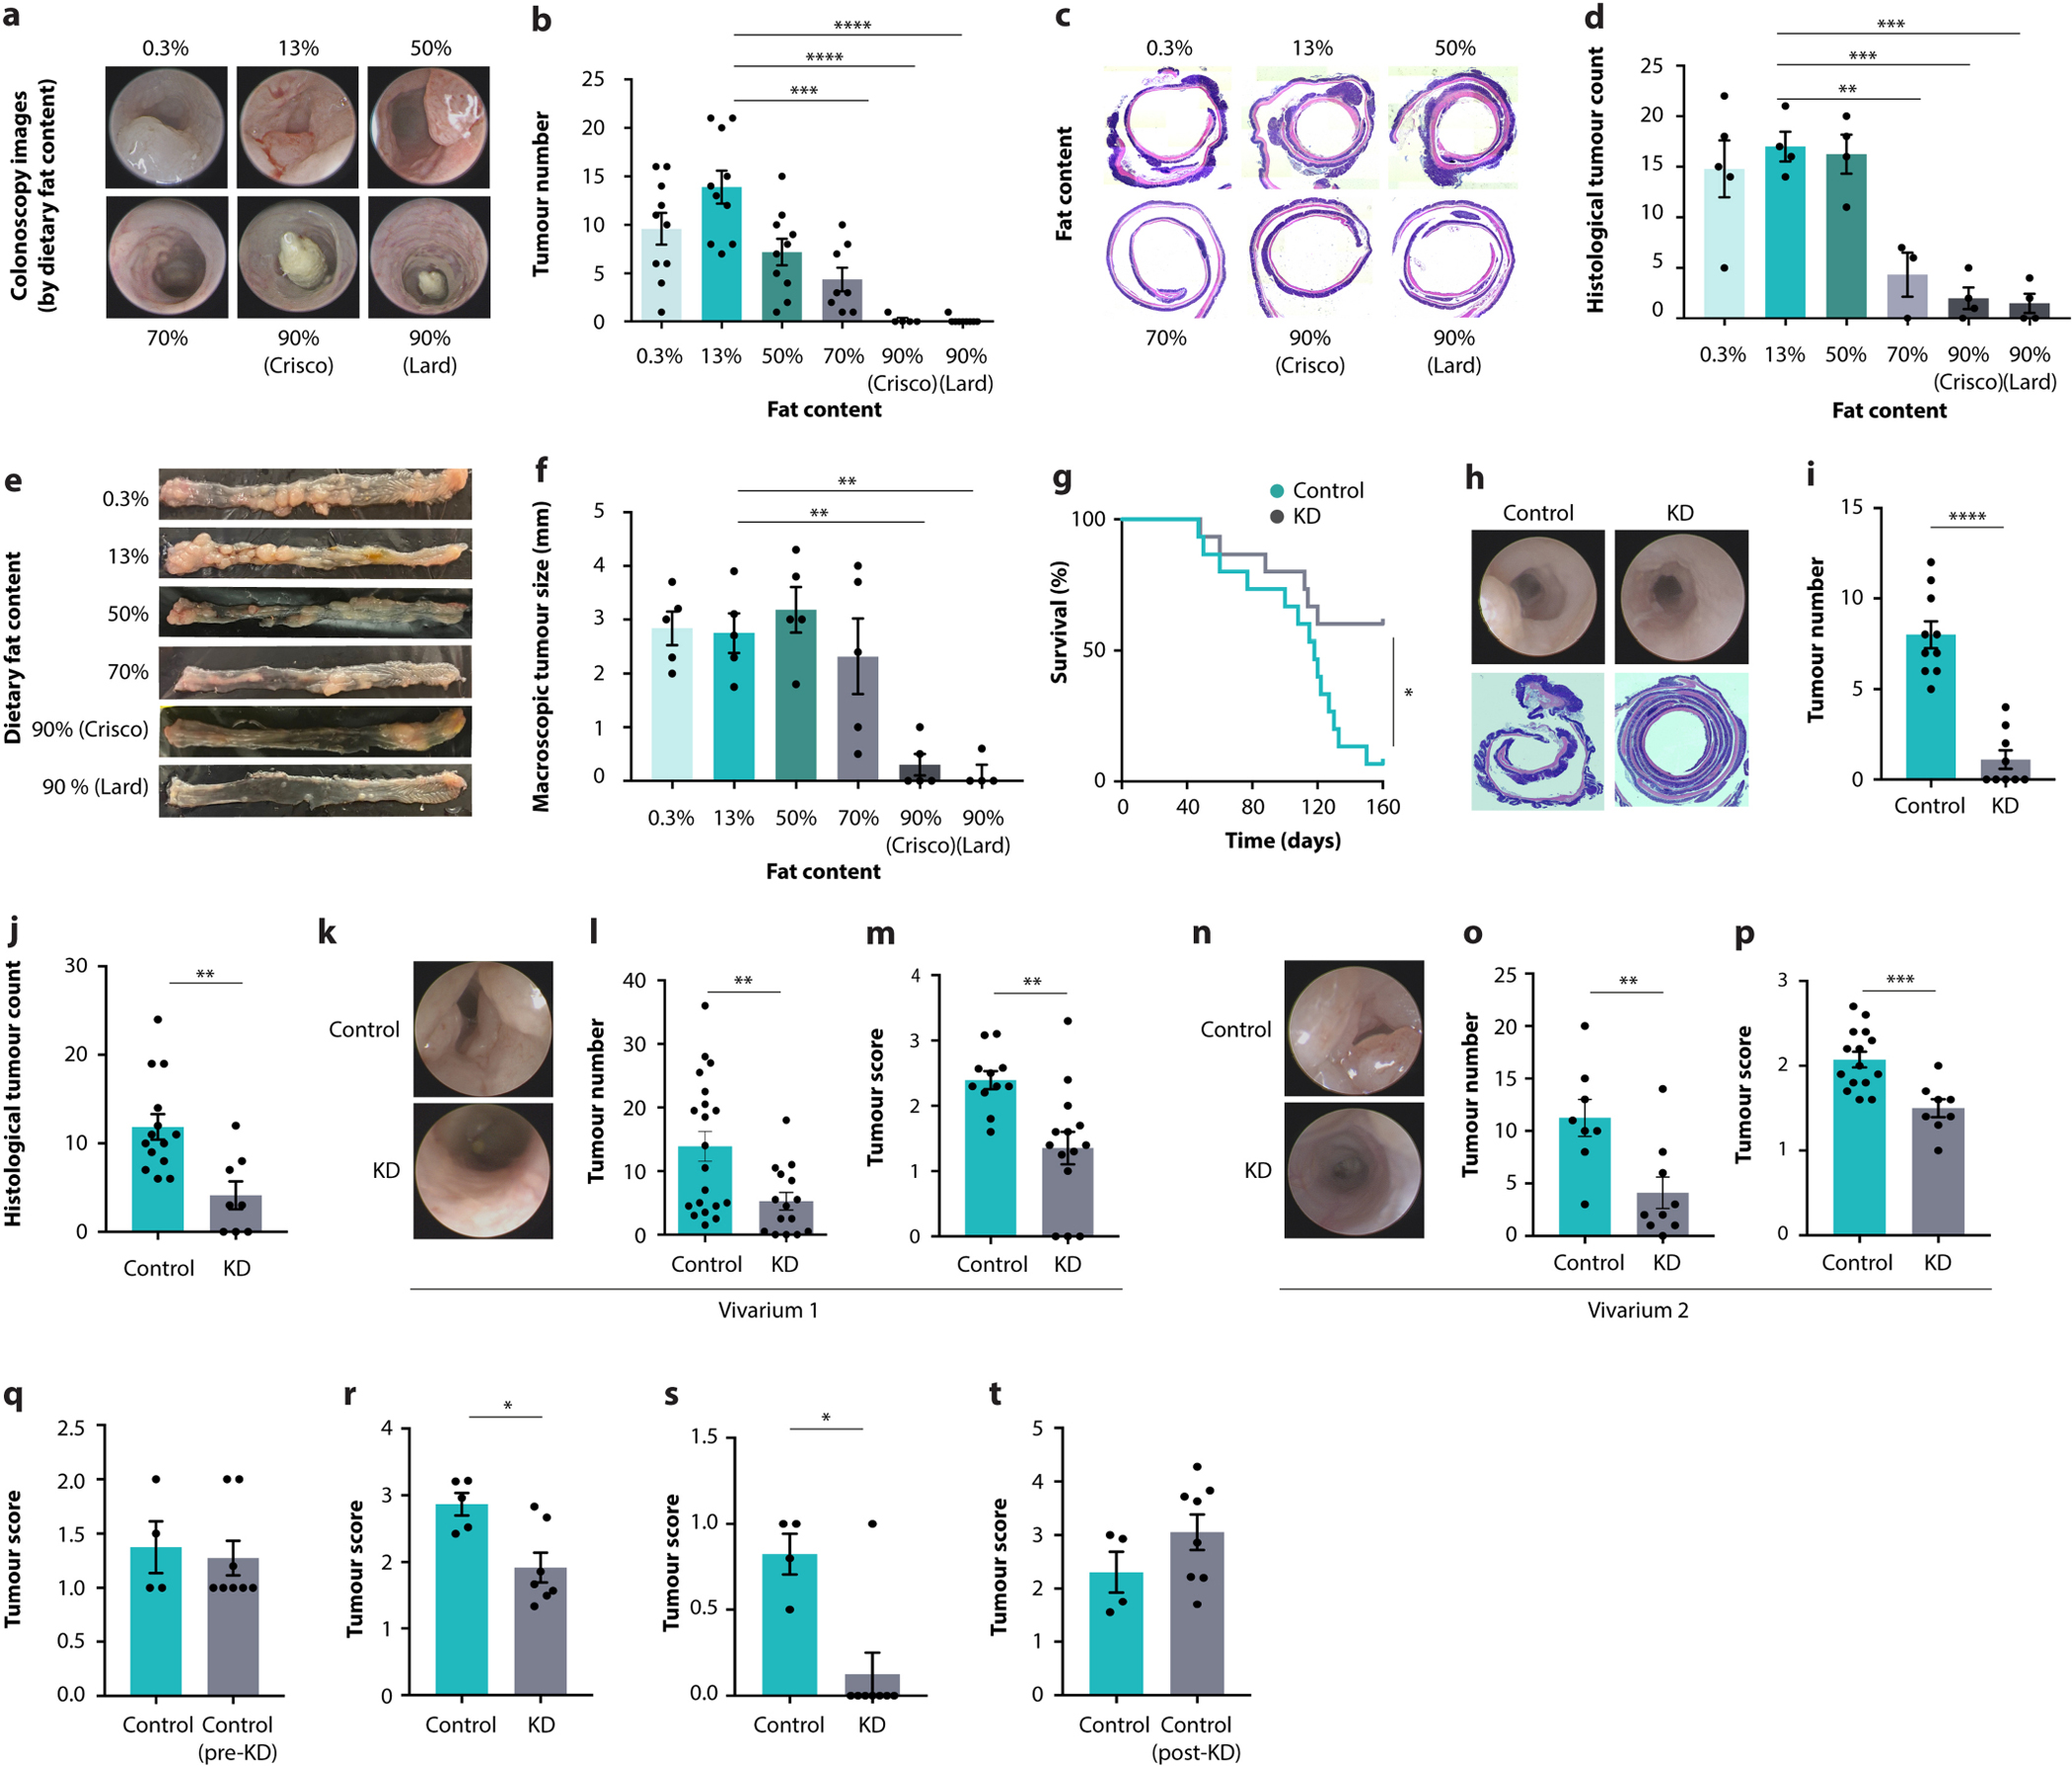
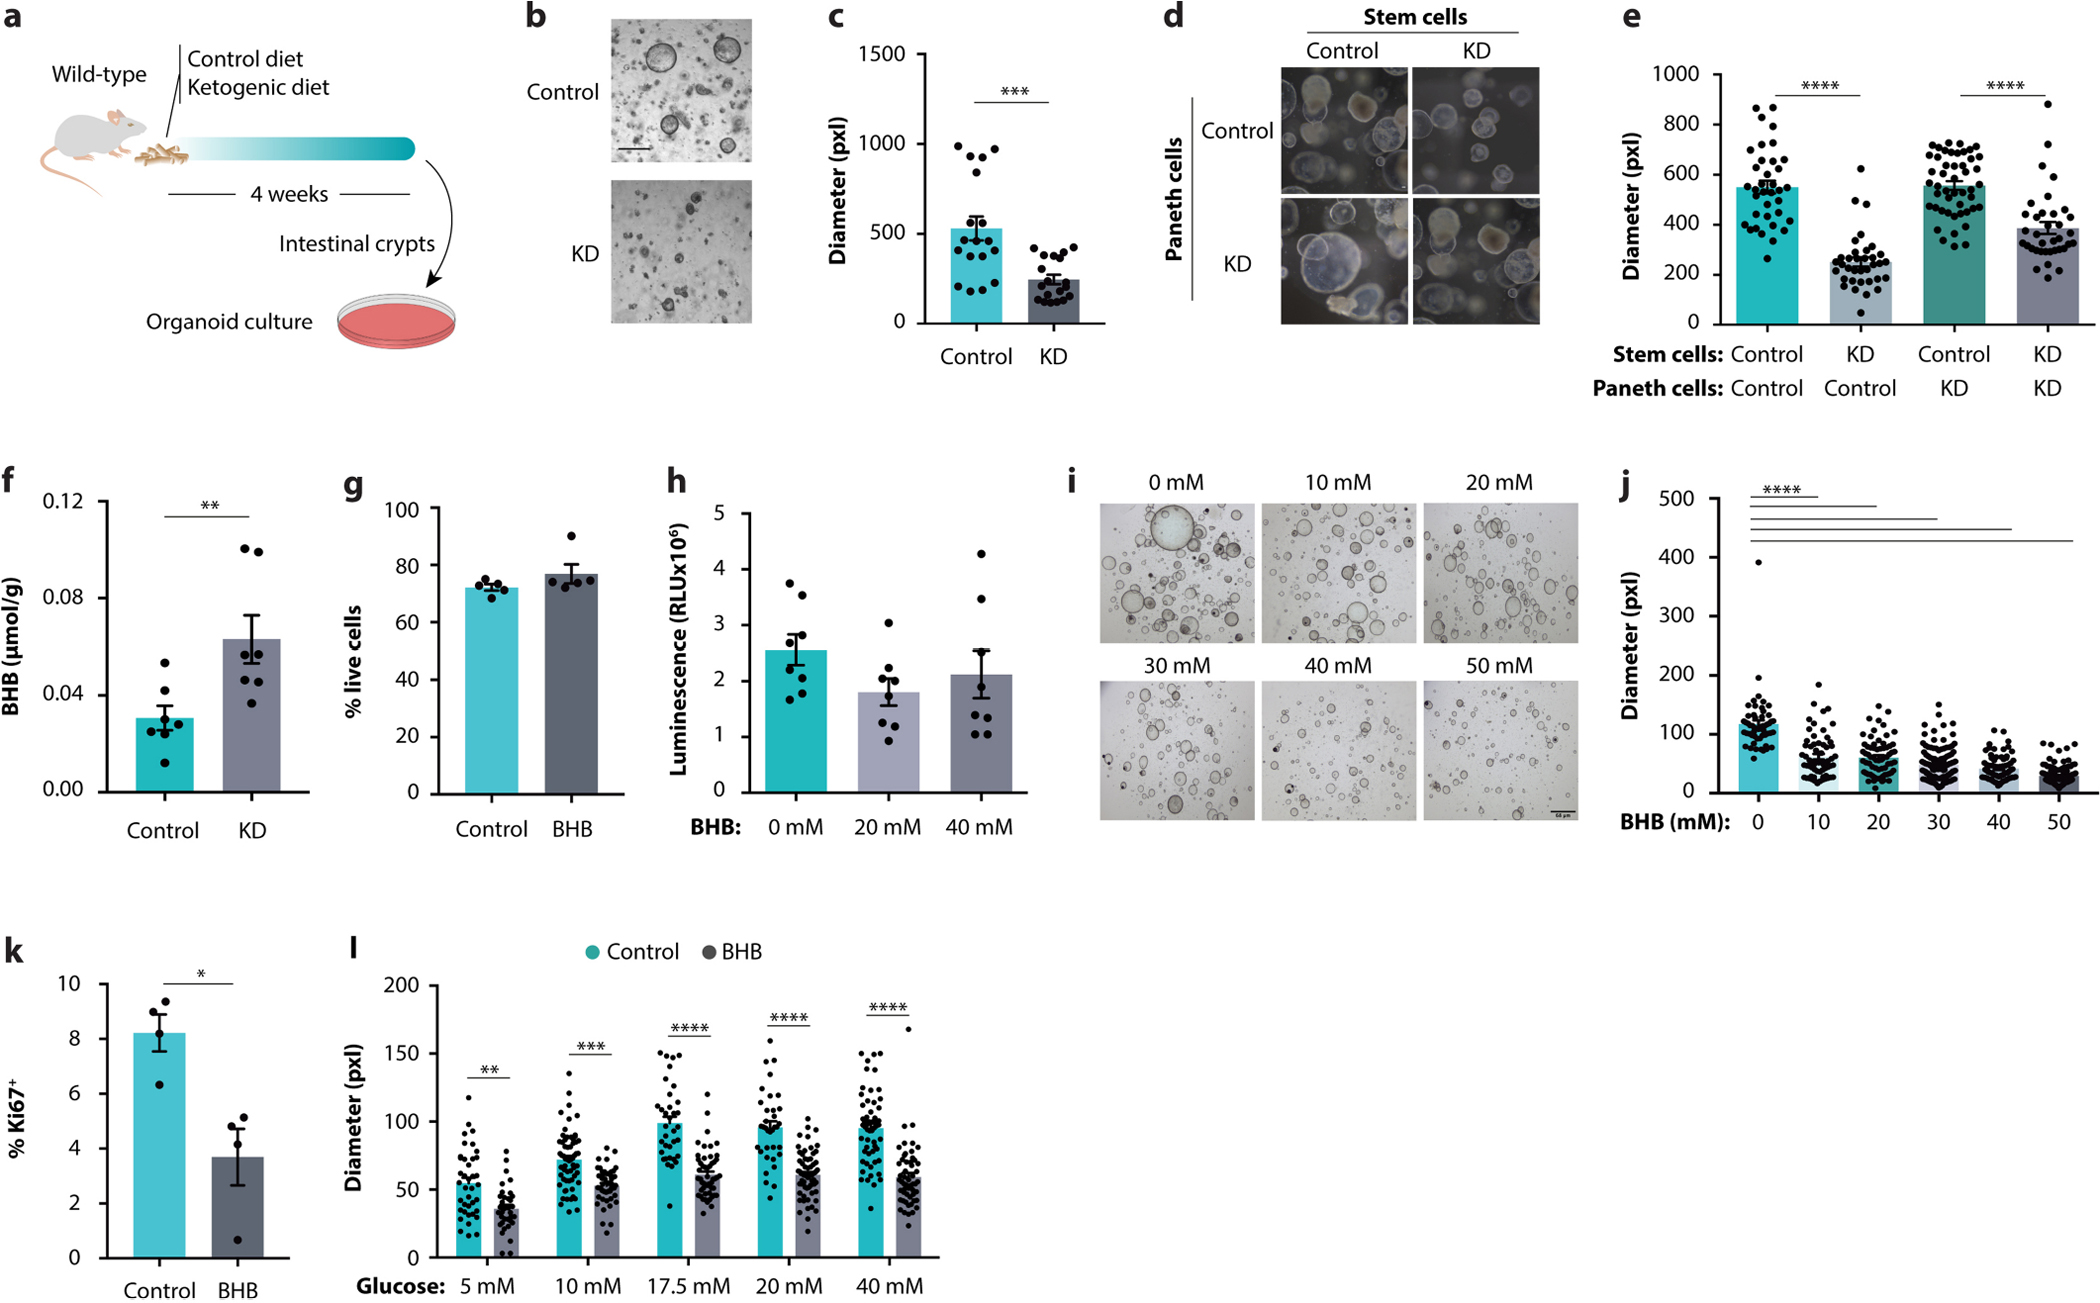
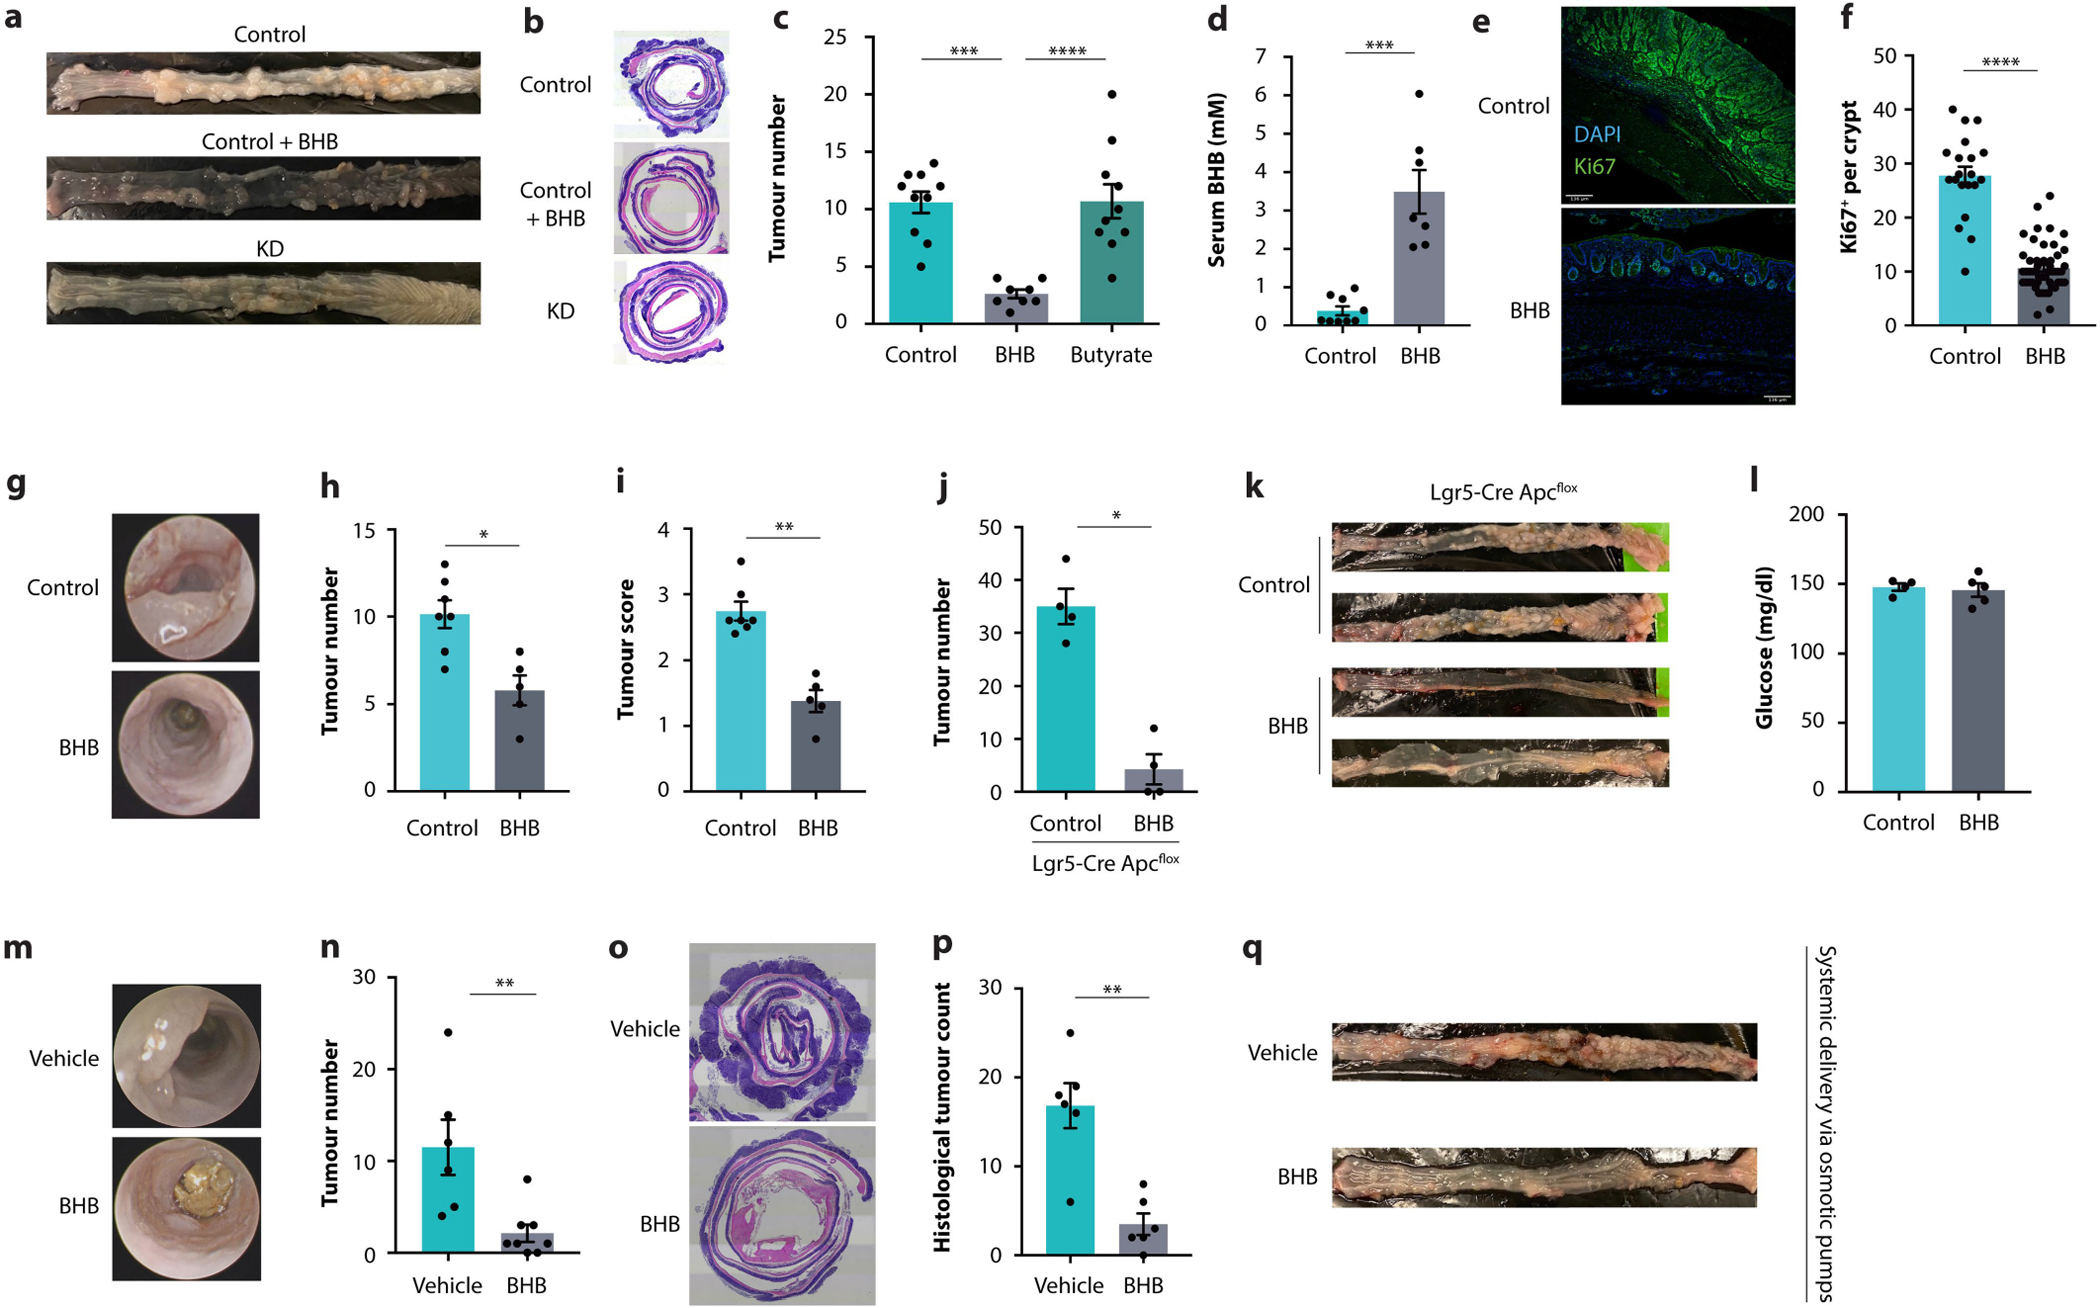
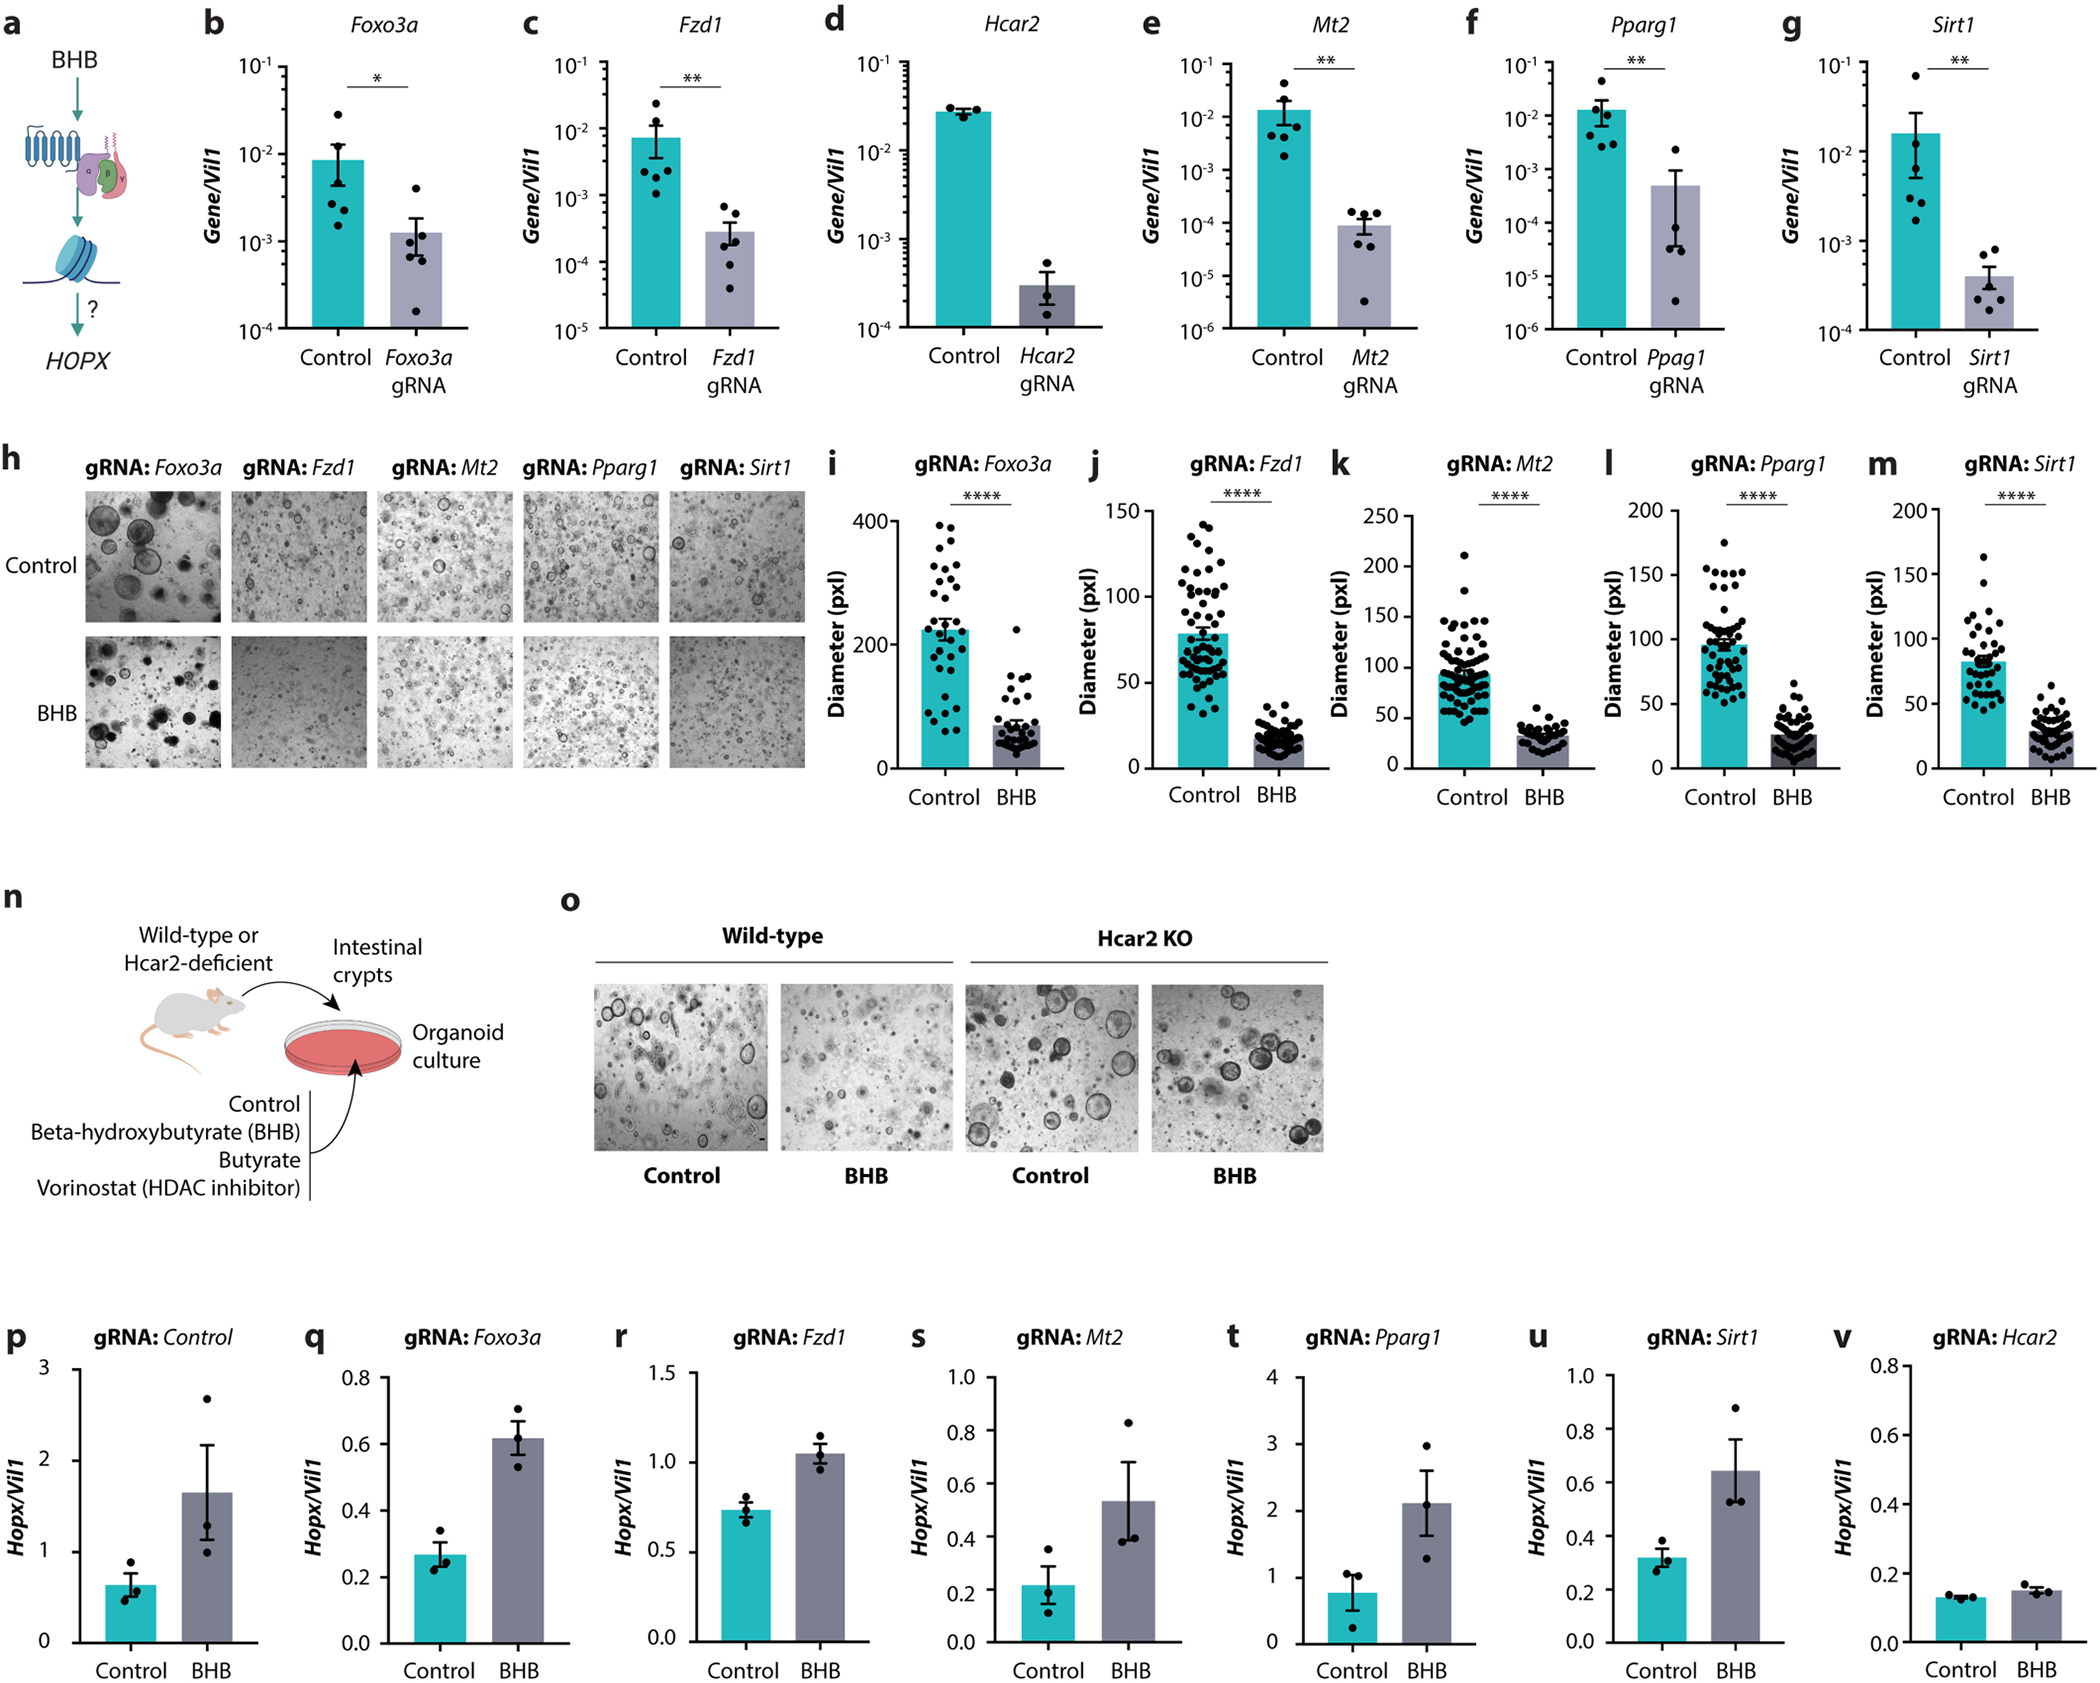
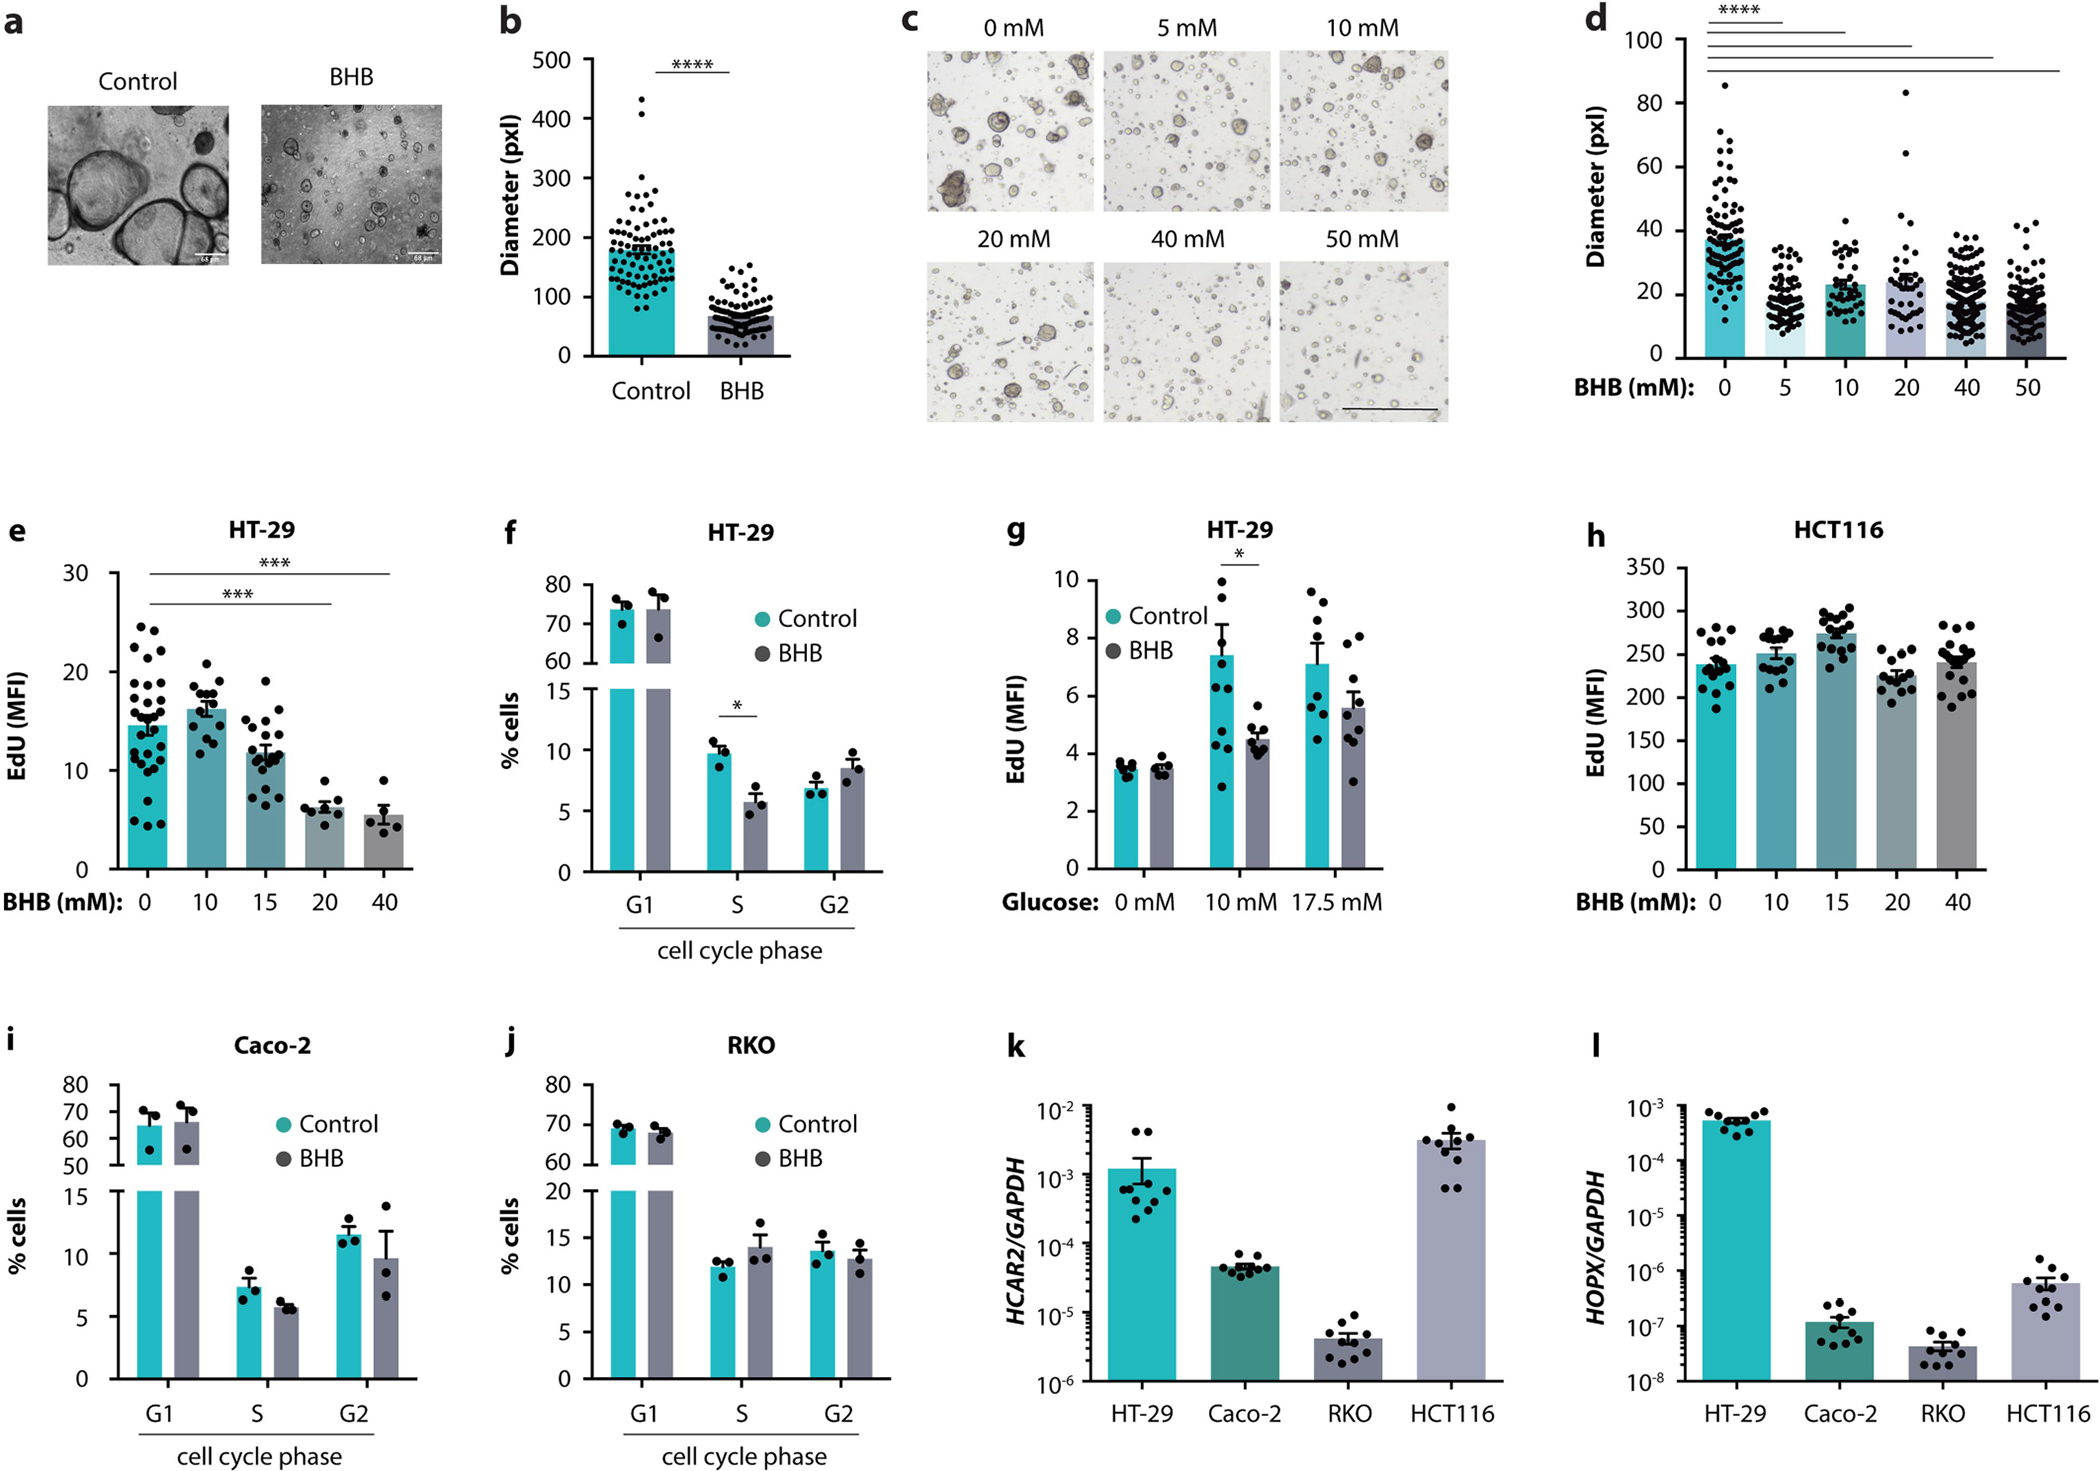
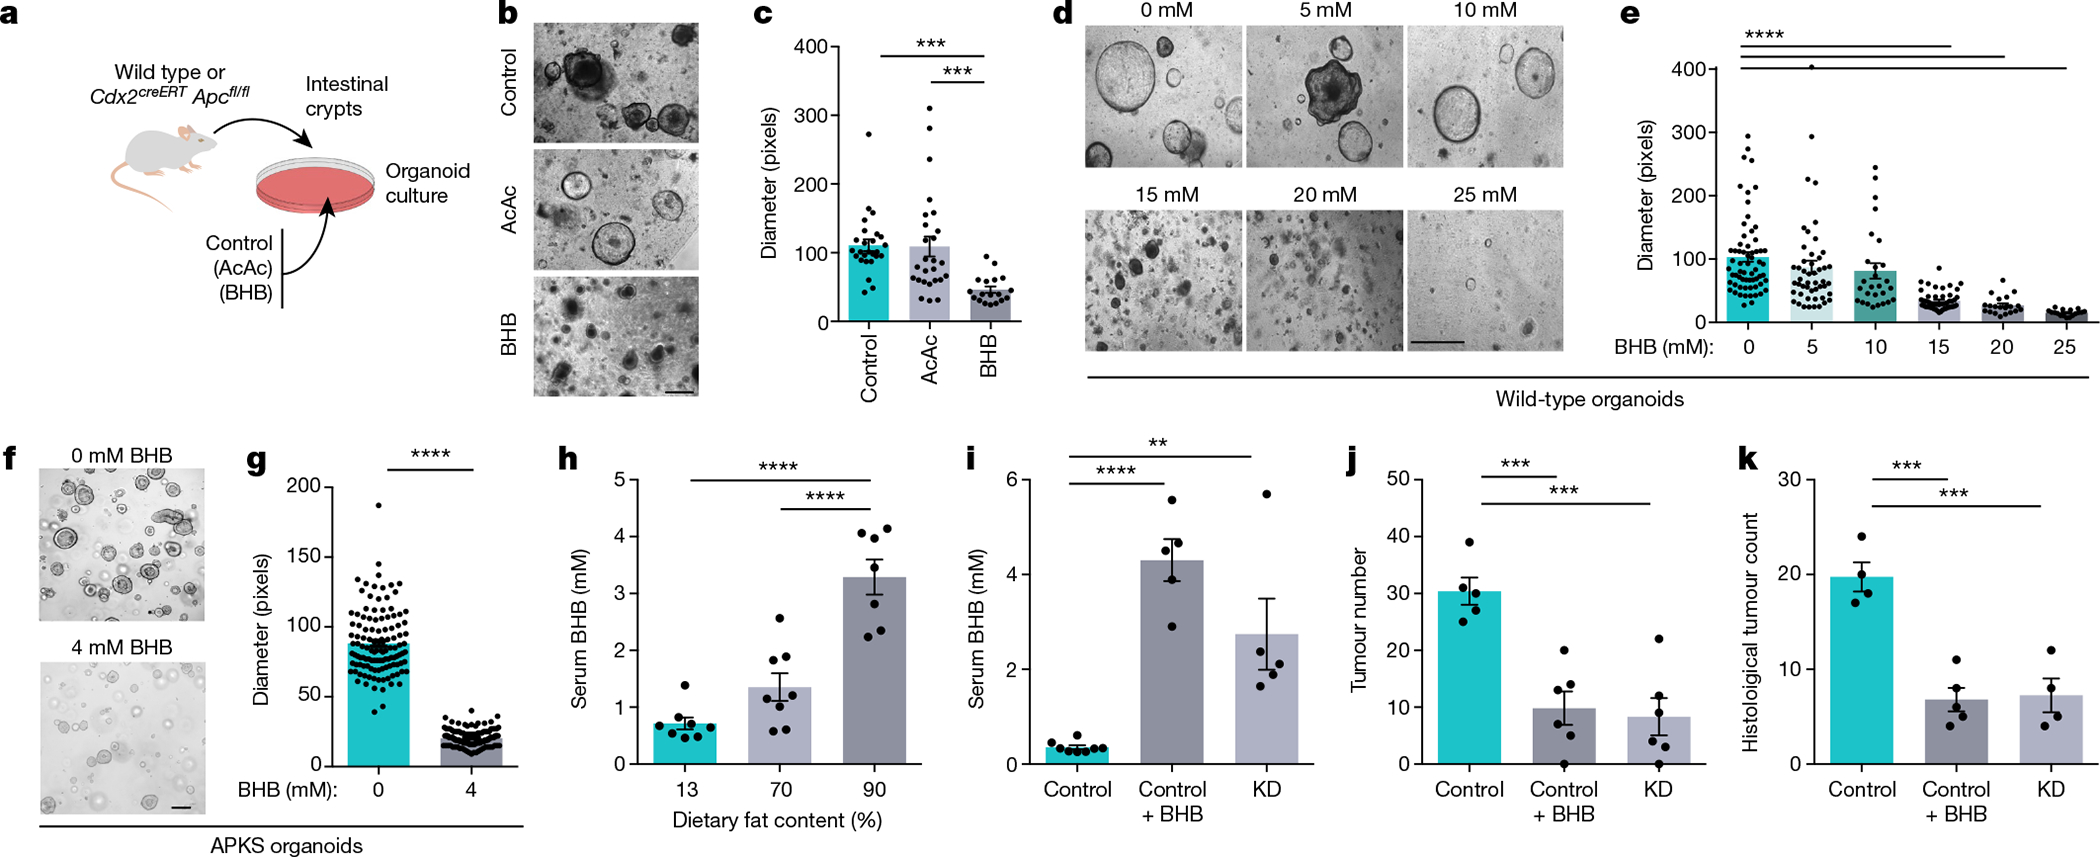
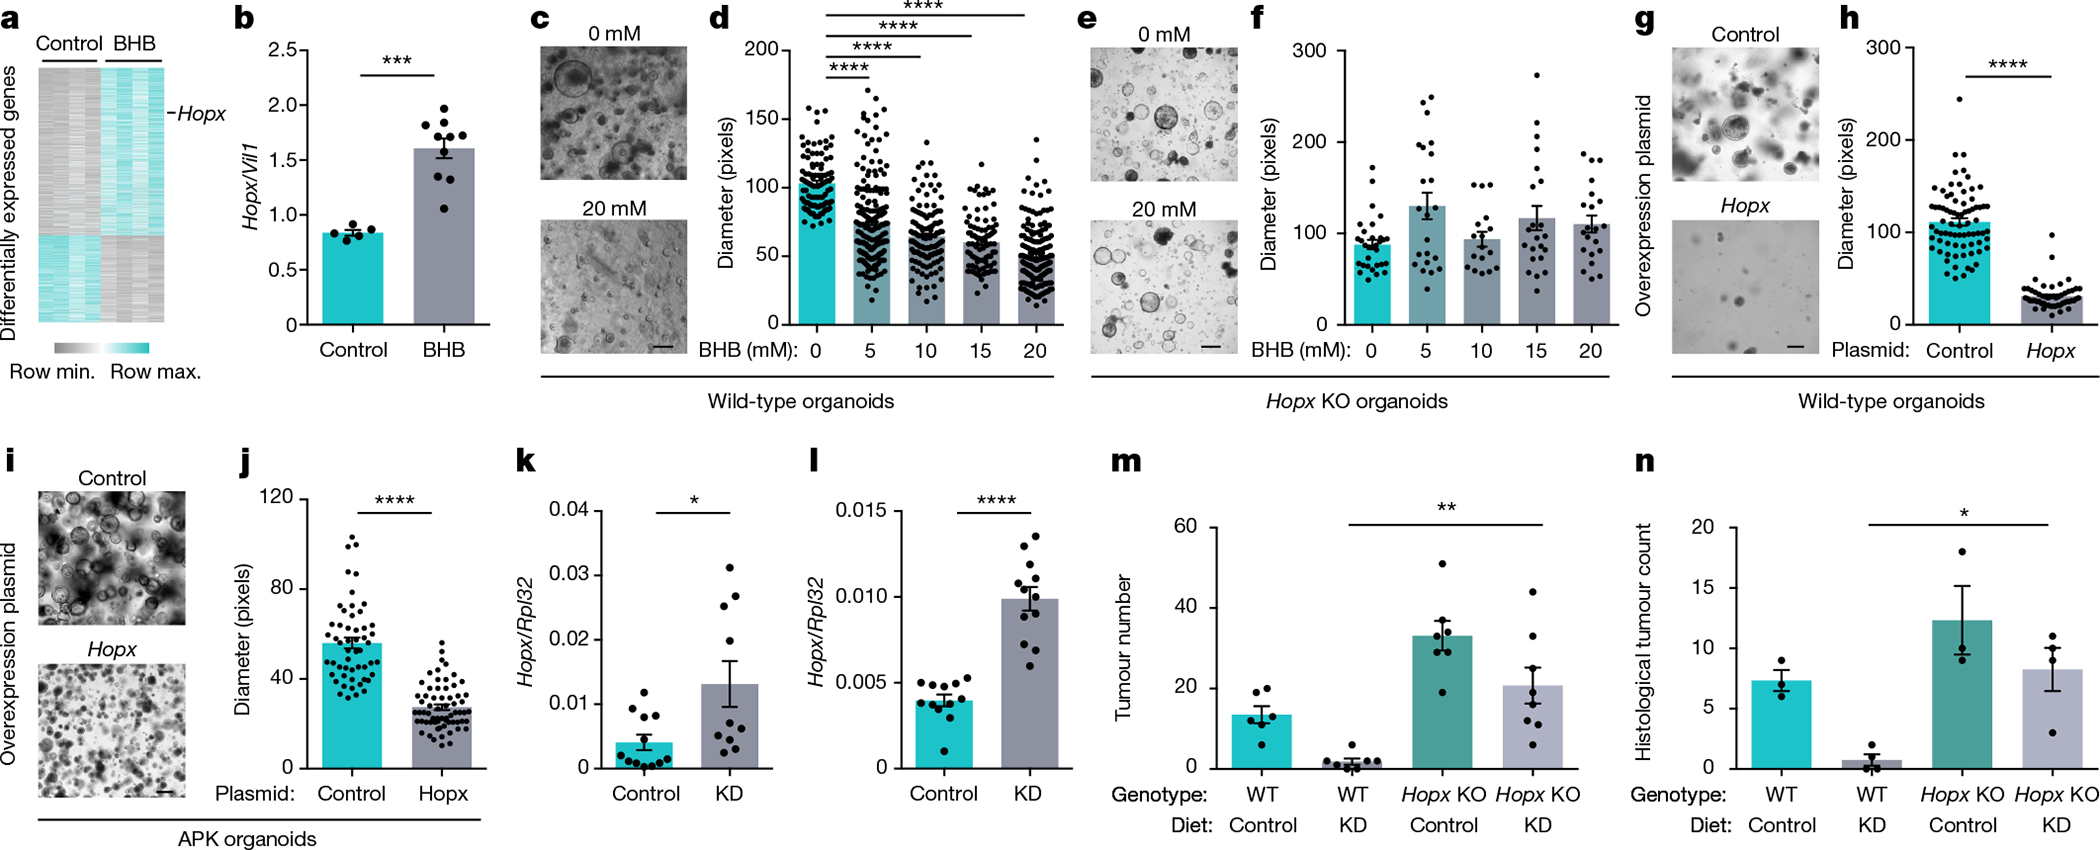
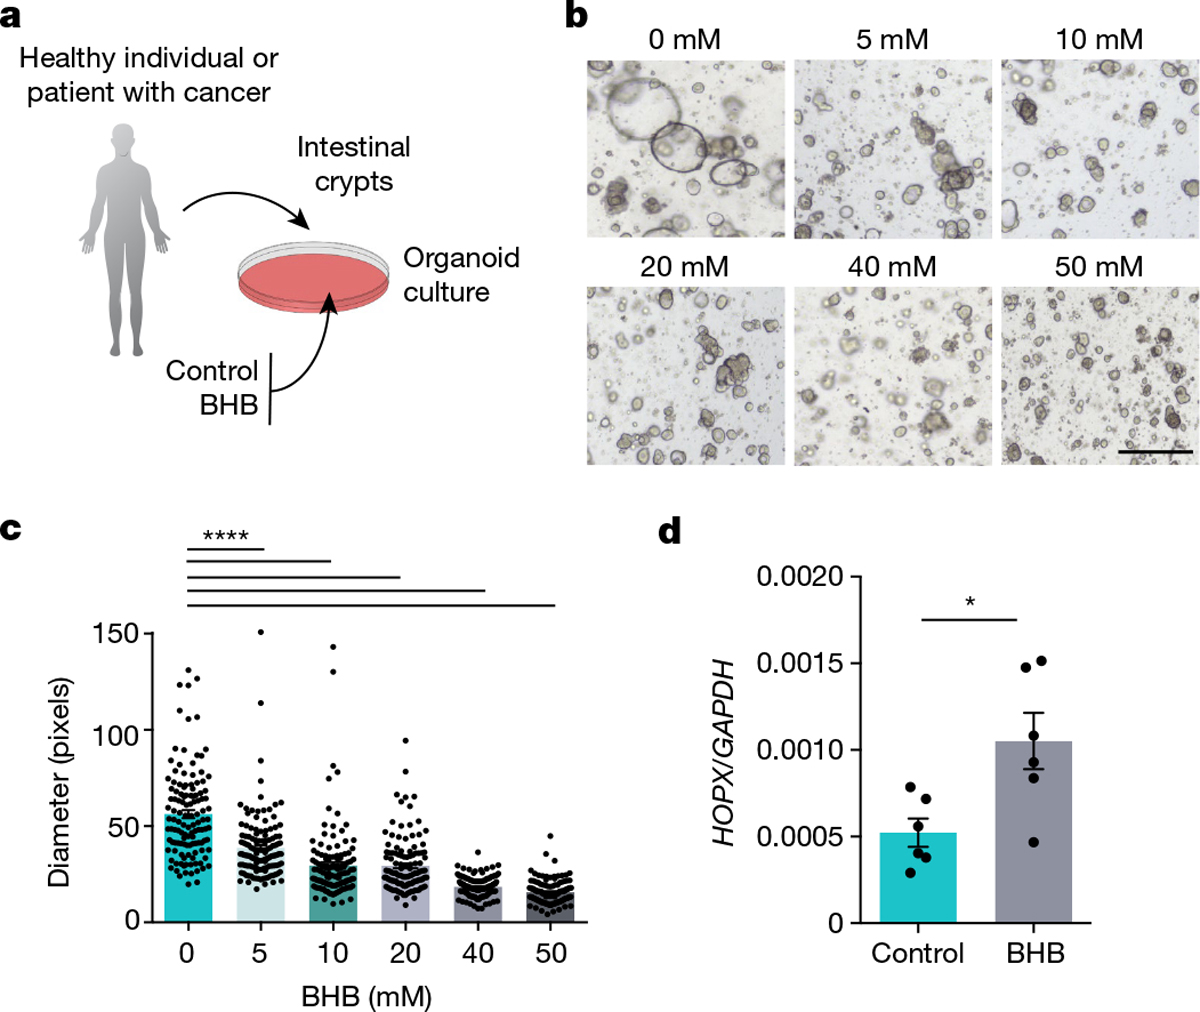
Colorectal cancer (CRC) is among the most frequent forms of cancer, and new strategies for its prevention and therapy are urgently needed1. Here we identify a metabolite signalling pathway that provides actionable insights towards this goal. We perform a dietary screen in autochthonous animal models of CRC and find that ketogenic diets exhibit a strong tumour-inhibitory effect. These properties of ketogenic diets are recapitulated by the ketone body β-hydroxybutyrate (BHB), which reduces the proliferation of colonic crypt cells and potently suppresses intestinal tumour growth. We find that BHB acts through the surface receptor Hcar2 and induces the transcriptional regulator Hopx, thereby altering gene expression and inhibiting cell proliferation. Cancer organoid assays and single-cell RNA sequencing of biopsies from patients with CRC provide evidence that elevated BHB levels and active HOPX are associated with reduced intestinal epithelial proliferation in humans. This study thus identifies a BHB-triggered pathway regulating intestinal tumorigenesis and indicates that oral or systemic interventions with a single metabolite may complement current prevention and treatment strategies for CRC.


Conflict of interest statement

Competing interests The authors declare no competing interests.

Figures

Extended Data Fig. 1 |
Extended Data Fig. 1 |. The impact of ketogenic diets on intestinal tumour growth.
a–f, Representative colonoscopy images (a), colonoscopy-based tumour counts (b), representative histological images (c), histological tumour counts (d), representative macroscopic images (e), and tumour size quantification (f) of AOM/DSS-treated mice fed six different diets. g, Survival of AOM/DSS-treated mice fed a KD or control diet. h–j, Representative colonoscopy and histology images (h), colonoscopy-based tumour numbers (i) and histological tumour count (j) in CDX2CreERT-Apcfl/fl mice fed a KD or control diet. k–p, Representative colonoscopy images (k, n), colonoscopy-based tumour quantification (l, o), and tumour scores (m, p) from CDX2CreERT-Apcfl/fl mice fed a KD or control diet housed in different animal vivaria. q–t, Colonoscopy-based tumour scores of AOM/DSS-treated KD-fed mice in a treatment model initiated after tumorigenesis (q, r) and a cessation model with discontinued diet (s, t). Error bars indicate means ± SEM. * p < 0.05, ** p < 0.01, *** p < 0.001, **** p < 0.0001. Exact n and p-values are presented in Supplementary Table 3.
Extended Data Fig. 2 |
Extended Data Fig. 2 |. The immunological and epithelial impact of ketogenic diets.
a, b, Continuous recording (a) and quantification (b) of energy intake in mice fed six different diets with the indicated fat content. Grey areas indicate the dark phase. c, Transcript levels of Il17a in colonic tumours of AOM/DSS-treated mice on KD and control diet. d–g, Representative colonoscopy and histology images (d), colonoscopy-based tumour quantification (e), tumour score by colonoscopy (f), and histological tumour counts (g) in Rag1−/− mice fed a KD or control diet. h–j, Representative colonoscopy images (h), colonoscopy-based tumour quantification (i) and tumour score (j) in CDX2CreERT-Apcfl/fl mice reconstituted with Nlrp3-deficient or -sufficient bone marrow. k–n, Representative images (k, m) and quantification (l, n) of Ki67-stained colons in healthy (k, l) and AOM/DSS-treated (m, n) KD-fed mice and controls. o, p, Representative immunohistochemistry images (o) and quantification (p) of Mcl1 staining of tumours from AOM/DSS-treated KD-fed mice and controls. Error bars indicate means ± SEM. * p < 0.05, ** p < 0.01, *** p < 0.001, **** p < 0.0001. Exact n and p-values are presented in Supplementary Table 3.
Extended Data Fig. 3 |
Extended Data Fig. 3 |. Inhibition of intestinal epithelial growth by beta-hydroxybutyrate.
a–c, Schematic (a), representative images (b), and growth quantification (c) of intestinal organoids obtained from KD-fed mice and controls. d, e, Representative images (d) and growth quantification (e) of intestinal organoids after isolation of stem cells and Paneth cells from KD-fed mice and controls. f, Colonic concentrations of BHB in mice fed the indicated diets. g, h Viability assessments by flow cytometry (g) or luminescent ATP detection (h) of BHB-treated organoids and controls. i, j, Representative images (i) and size quantification (j) of organoids from CDX2CreERT-Apcfl/fl mice after culturing with the indicated concentrations of BHB. k, Ki67 quantification by flow cytometry in organoids treated with BHB. l, Size quantification of organoids grown in media containing different glucose concentrations, with or without BHB supplementation. Error bars indicate means ± SEM. Scale bars represent 68 μm. * p < 0.05, ** p < 0.01, *** p < 0.001, **** p < 0.0001. Exact n and p-values are presented in Supplementary Table 3.
Extended Data Fig. 4 |
Extended Data Fig. 4 |. Inhibition of intestinal tumour growth by beta-hydroxybutyrate.
a, b, Representative macroscopic images (a) and representative histology images (b) of CDX2CreERT-Apcfl/fl mice fed either KD or control diet, with or without daily oral supplementation with BHB esters as indicated. c, Colonoscopy-based tumour quantification in AOM/DSS-treated mice receiving oral supplementation with either BHB or butyrate. d, BHB concentrations in the blood of AOM/DSS-treated mice on standard rodent diet receiving daily oral supplementation with BHB esters. e, f, Representative images (e) and quantification (f) of Ki67-stained tumours in AOM/DSS-treated mice supplemented with BHB. g–i, Representative colonoscopy images (g), colonoscopy-based tumour quantification (h), and tumour score by colonoscopy (i) in AOM/DSS-treated mice receiving daily oral supplementation with BHB esters. j, k, Macroscopic tumour counts (j) and representative macroscopic images (k) of Lgr5CreERT-Apcfl/fl mice receiving daily oral supplementation with BHB esters. l, Glucose concentrations in the blood of AOM/DSS-treated mice on standard chow receiving daily oral supplementation with BHB esters. m–q, Representative colonoscopy images (m), colonoscopy-based tumour quantification (n), representative histology images (o), histological tumour counts (p), and representative macroscopic images (q) of CDX2CreERT-Apcfl/fl mice supplemented with BHB salts by osmotic mini-pumps. Error bars indicate means ± SEM. Scale bars represent 135 μm. * p < 0.05, ** p < 0.01, *** p < 0.001, **** p < 0.0001. Exact n and p-values are presented in Supplementary Table 3.
Extended Data Fig. 5 |
Extended Data Fig. 5 |. The role of Hopx in BHB-mediated tumour suppression.
a, PCA plot of global gene expression of BHB-treated and control organoids. b, Ki67 expression in organoids from wild-type and Hopx-deficient mice treated with BHB. c, Transcript levels of Hopx in organoids treated with 2-deoxyglucose (2-DG) or BHB. d, Size quantification of APKS organoids treated with 2-DG or BHB. e, Size quantification of organoids from wild-type or Hopx-deficient mice cultured at the indicated glucose concentrations, with or without BHB supplementation. f, Transcript levels of Hopx in the indicated tissues from KD-fed mice and controls. g, h, Representative images (g) and quantification (h) of GFP in the colons of Hopx-GFP reporter mice fed a KD or control diet. i–l, Representative colonoscopy images (i), macroscopic images (j), histological images (k), and colonoscopy-based tumour score (l) of AOM/DSS-treated Hopx-deficient and wild-type mice fed a KD or control diet. m–p, Blood glucose (m), circulating BHB (n), tumour number by colonoscopy (o), and colonoscopy-based tumour score (p) of Hopx-deficient mice and controls receiving BHB supplementation or 30% caloric restriction (CR). Error bars indicate means ± SEM. Scale bar represents 160 μm. * p < 0.05, ** p < 0.01, *** p < 0.001, **** p<0.0001. Exact n and p-values are presented in Supplementary Table 3.
Extended Data Fig. 6 |
Extended Data Fig. 6 |. Regulation of epithelial proliferation by Hopx.
a, b, Heatmap (a) and KEGG pathway analysis (b) of differentially expressed genes determined by RNA-sequencing of AOM/DSS-treated Hopx-deficient mice and wild-type littermates on KD. c–f, Examples of genes upregulated in KD-fed AOM/DSS-treated Hopx-deficient mice compared to wild-type littermates. Error bars indicate means ± SEM. * p < 0.05, ** p < 0.01. Exact n and p-values are presented in Supplementary Table 3.
Extended Data Fig. 7 |
Extended Data Fig. 7 |. The impact of BHB on intestinal epithelial histone acetylation.
a, Model by which HOPX is induced through the HDAC-inhibitory activity of BHB. b, HDAC activity in organoids treated with BHB, with or without the pharmacological HDAC inhibitor vorinostat. c–e, Representative flow cytometry plot (c), relative proportion of H3K9ac (d), and normalized MFI of H3K9ac (e) in intestinal organoids treated with BHB. f, HDAC activity in intestinal epithelial cells from mice treated with BHB esters. g–i, Representative flow cytometry plot (g), relative proportion of H3K9ac (h), and normalized MFI of H3K9ac (i) in intestinal epithelial cells from KD-fed mice and controls. j, k, Representative immunofluorescence staining (j) and quantification (k) of pan-acetylation levels in colons from KD-fed mice and controls. l, Size of wild-type organoids treated with BHB and/or vorinostat. m, n, Size quantification of wild-type (m) and APKS organoids (n) exposed to BHB or butyrate. o, p, PCA plot (o) and k-means clustering (p) of global gene expression in organoids treated with BHB or the HDAC inhibitor (HDACi) vorinostat. q, Transcript abundance of Hopx determined by RNA-sequencing of organoids treated with BHB or vorinostat. r, Normalized profiles of H3K9ac in the Hopx locus from ChIP-sequencing of intestinal epithelial cells from mice treated with BHB or fed a 90% fat diet. s, Size of Hopx-deficient organoids after treatment with BHB and/or vorinostat. t, Size quantification of organoids from Hopx-deficient mice exposed to BHB or butyrate. u, Quantification of HDAC activity in wild-type and Hopx-deficient organoids treated with BHB and/or vorinostat. v, w, Tumour numbers (v) and representative colonoscopy images (w) in AOM/DSS-treated mice on KD and treated with the HDAC inhibitor vorinostat. Error bars indicate means ± SEM. * p < 0.05, ** p < 0.01, *** p < 0.001, **** p < 0.0001. Exact n and p-values are presented in Supplementary Table 3.
Extended Data Fig. 8 |
Extended Data Fig. 8 |. The impact of BHB on intestinal epithelial DNA methylation.
a, Hypothetical model by which HOPX is induced through BHB-mediated methylation changes. b–d, PCA plots (b, c) and scatter plot (d) of bisulphite sequencing of intestinal epithelial cells from mice treated with BHB or fed a KD compared to controls. e, Heatmap of CpG methylation status in the Hopx locus determined by bisulphite sequencing of intestinal epithelial cells from mice treated with BHB or fed a 90% fat diet. f, Transcript abundance of Hopx in organoids treated with BHB and/or 5-azacitidine (5-Aza). g, h, Size of wild-type (g) and Hopx-deficient organoids (h) after treatment with BHB and/or 5-Aza. i, j, Images of wild-type (i) and Hopx-deficient (j) organoids treated with BHB and 5-Aza. Error bars indicate means ± SEM. * p < 0.05, ** p < 0.01, *** p < 0.001, **** p < 0.0001. Exact n and p-values are presented in Supplementary Table 3.
Extended Data Fig. 9 |
Extended Data Fig. 9 |. A CRISPR-based approach to identify mediators of Hopx induction by BHB.
a, Hypothetical model by which HOPX is induced through BHB-mediated G protein-coupled receptor signalling. b–g, Expression of the indicated genes in organoids after CRISPR-mediated targeting thereof. h–m, Representative images (h) and size quantitation (i-m) of organoids treated with BHB after CRISPR-mediated targeting of the indicated genes. n, Schematic of organoid growth from Hcar2-deficient mice, cultured with BHB, butyrate, or vorinostat. o, Representative images of organoids from wild-type and Hcar2-deficient mice treated with BHB. p–v, Transcript levels of Hopx in organoids treated with BHB after CRISPR-mediated targeting of the indicated genes. Error bars indicate means ± SEM. **** p < 0.0001. Exact n and p-values are presented in Supplementary Table 3.
Extended Data Fig. 10 |
Extended Data Fig. 10 |. The impact of BHB on human organoids and colorectal cancer cell lines.
a, b, Representative images (a) and quantification (b) of organoids from a healthy paediatric donor after culturing with BHB. c, d, Representative images (c) and quantification (d) of organoids from a CRC patient after culturing with the indicated concentrations of BHB. e, EdU staining of HT-29 cells treated with the indicated concentrations of BHB. f, Cell cycle analysis of HT-29 cells treated with BHB. g, EdU staining of HT-29 cells cultured at the indicated concentrations of glucose, with or without addition of BHB. h, EdU staining of HCT116 cells treated with the indicated concentrations of BHB. i, j, Cell cycle analysis of Caco-2 cells (i) and RKO cells (j) treated with BHB. k, l, Expression of HCAR2 (g), and HOPX (h) by the indicated cell lines. Error bars indicate means ± SEM. * p < 0.05, *** p < 0.001, **** p < 0.0001. Exact n and p-values are presented in Supplementary Table 3.
Extended Data Fig. 11 |
Extended Data Fig. 11 |. The impact of BHB and HOPX on colorectal cancer biopsies.
a, Workflow of analysis of CRC patient cohort. b, Serum BHB levels in 41 colon cancer patients. c, d, UMAP clustering (c) and marker gene expression (d) in single-cell RNA-sequencing data of colonic biopsies from nine CRC patients. e–h, Epithelial HOPX expression binned by serum BHB levels (e), correlation of average epithelial HOPX expression with serum BHB (f), correlation of epithelial cell cycle progression with serum BHB (g), and correlation of the proportion of cells in S phase with the proportion of HOPX-expressing epithelial cells (h) as determined by single-cell RNA-sequencing of colonic biopsies of tumour and normal tissue from nine CRC patients. Error bars indicate means ± SEM. The p- and R-values were determined by linear regression. i, Cartoon illustrating that ketogenic diet induces BHB, which in turn signals via HCAR2 to induce HOPX, decelerate proliferation of the colonic crypt, and suppress cancer development. This pathway is contrasted with the mechanisms engaged by other tumour-modulatory diets. Exact n and p-values are presented in Supplementary Table 3.
Fig. 1 |
Fig. 1 |. Inhibition of intestinal tumour growth by KDs.
a, Schematic of dietary exposure in AOM/DSS-treated mice. b, Macronutrient composition of diets. c, Tumour scores of AOM/DSS-treated mice fed six different diets. d, Schematic of dietary exposure of Cdx2CreERTApcfl/fl mice. e, Tumour score in Cdx2CreERTApcfl/fl mice fed a KD or control diet. f–k, Schematic of dietary exposure (f, i) and colonoscopy-based tumour quantification (g, h, j, k) in AOM/DSS-treated KD-fed mice in a treatment model (f–h) and a cessation model (i–k). Data are ± s.e.m. *P < 0.05, **P < 0.01, ***P < 0.001, ****P < 0.0001. Exact n and P values are presented in Supplementary Table 3.
Fig. 2 |
Fig. 2 |. Inhibition of intestinal tumour growth by BHB.
a, Schematic of organoid growth cultured with AcAc or BHB. b, c, Representative images (b) and quantification (c) of organoids exposed to AcAc or BHB. d–g, Representative images (d, f) and quantification (e, g) of wild-type (d, e) and APKS organoids (f, g) cultured with BHB. h, Serum concentrations of BHB in AOM/DSS-treated mice consuming diets with the indicated fat content. i–k, Serum BHB (i), colonoscopy-based tumour quantification (j) and histological tumour counts (k) of KD-fed or BHB-treated Cdx2CreERTApcfl/fl mice. Data are ± s.e.m. Scale bars, 68 μm (b, d) and 160 μm (f). **P < 0.01, ***P < 0.001, ****P < 0.0001. Exact n and P values are presented in Supplementary Table 3.
Fig. 3 |
Fig. 3 |. BHB-mediated inhibition of tumour growth requires Hopx.
a, Heat map of differentially expressed genes in BHB-treated and control organoids. b, Hopx expression in BHB-treated organoids. c–f, Representative images (c, e) and quantification (d, f) of wild-type (c, d) and Hopx-deficient (e, f) organoids treated with BHB. g–j, Representative images (g, i) and quantification (h, j) of wild-type (g, h) and APKS (i, j) organoids overexpressing Hopx. k, l, Colonic transcript levels of Hopx in KD-fed mice under homeostatic conditions (k) and after tumour induction (l). m, n, Colonoscopy-based tumour quantification (m) and histological tumour counts (n) of KD-fed Hopx-deficient mice and controls. Data are ± s.e.m. Scale bars, 274 μm (c), 205 μm (e), 160 μm (g) and 320 μm (i). *P < 0.05, **P < 0.01, ***P < 0.001, ****P < 0.0001. Exact n and P values are presented in Supplementary Table 3.
Fig. 4 |
Fig. 4 |. BHB induces Hopx expression and suppresses intestinal epithelial growth through Hcar2.
a, Size of organoids treated with 10 mM BHB after CRISPR-mediated gene deletion. Insets show representative organoid images from Hcar2-targeted organoids and controls. b, Size of organoids from wild-type and Hcar2-deficient mice treated with BHB, butyrate or vorinostat. c, Transcript levels of Hopx in organoids from wild-type or Hopx-deficient mice treated with 10 mM BHB or butyrate. Data are ± s.e.m. Scale bar, 68 μm. *P < 0.05, ***P < 0.001, ****P < 0.0001. Exact n and P values are presented in Supplementary Table 3.
Fig. 5 |
Fig. 5 |. Effect of BHB and HOPX on human intestinal epithelial growth.
a, Schematic of intestinal organoid growth of crypts obtained from healthy donors or patients with CRC cultured with BHB or control medium. b, c, Representative images (b) and quantification (c) of organoids from a healthy adult donor after 10 days of culturing with the indicated concentrations of BHB. d, HOPX expression in BHB-treated and control organoids from patients with CRC. Data are ± s.e.m. Scale bar, 68 μm. *P < 0.05, ****P < 0.0001. Exact n and P values are presented in Supplementary Table 3.

Comment in

References

    1. Dekker E, Tanis PJ, Vleugels JLA, Kasi PM & Wallace MB Colorectal cancer. Lancet 394, 1467–1480 (2019). - PubMed
    1. Brenner H, Kloor M & Pox CP Colorectal cancer. Lancet 383, 1490–1502 (2014). - PubMed
    1. Beyaz S et al. High-fat diet enhances stemness and tumorigenicity of intestinal progenitors. Nature 531, 53–58 (2016). - PMC - PubMed
    1. Ringel AE et al. Obesity shapes metabolism in the tumor microenvironment to suppress anti-tumor immunity. Cell 183, 1848–1866 (2020). - PMC - PubMed
    1. Xu J et al. Association between markers of glucose metabolism and risk of colorectal cancer. BMJ Open 6, e011430 (2016). - PMC - PubMed

Publication types

MeSH terms

Substances